Statistiques de base
| Propriétaires institutionnels | 789 total, 789 long only, 0 short only, 0 long/short - change of 1,02% MRQ |
| Allocation moyenne du portefeuille | 0.4621 % - change of -0,75% MRQ |
| Actions institutionnelles (Long) | 164 845 368 (ex 13D/G) - change of 15,15MM shares 10,12% MRQ |
| Valeur institutionnelle (Long) | $ 4 880 426 USD ($1000) |
Participation institutionnels et actionnaires
Schwab Strategic Trust - Schwab Emerging Markets Equity ETF (US:SCHE) détient 789 des propriétaires institutionnels et des actionnaires qui ont déposé des formulaires 13D/G ou 13F auprès de la Securities Exchange Commission (SEC). Ces institutions détiennent un total de 164,845,368 actions. Les principaux actionnaires incluent Creative Planning, Financial Engines Advisors L.L.C., HighTower Advisors, LLC, SageView Advisory Group, LLC, Northwestern Mutual Wealth Management Co, Us Bancorp \de\, FAIEX - PFM Multi-Manager International Equity Fund Institutional Class, CI Private Wealth, LLC, SWYMX - Schwab Target 2050 Index Fund, and Envestnet Asset Management Inc .
Schwab Strategic Trust - Schwab Emerging Markets Equity ETF (ARCA:SCHE) la structure de l'actionnariat institutionnel indique les positions actuelles des institutions et des fonds dans l'entreprise, ainsi que les derniers changements dans le volume des positions. Les principaux actionnaires peuvent être des investisseurs individuels, des fonds communs de placement, des fonds spéculatifs ou des institutions. L'annexe 13D indique que l'investisseur détient (ou a détenu) plus de 5 % de l'entreprise et qu'il a l'intention (ou a eu l'intention) de poursuivre activement un changement de stratégie commerciale. L'annexe 13G indique un investissement passif de plus de 5 %.
The share price as of September 8, 2025 is 32,08 / share. Previously, on September 9, 2024, the share price was 26,64 / share. This represents an increase of 20,42% over that period.

Indice de confiance des fonds
L'indice de confiance des fonds (anciennement score d'accumulation de participation) trouve les actions qui sont les plus achetées par les fonds. Il est le résultat d'un modèle quantitatif sophistiqué à plusieurs facteurs qui identifie les entreprises avec les niveaux les plus élevés d'accumulation institutionnelle. Le modèle de notation utilise une combinaison de l'augmentation totale des propriétaires déclarés, des variations des allocations de portefeuille chez ces propriétaires et d'autres indicateurs. Le chiffre varie de 0 à 100, les chiffres plus élevés indiquant un niveau d'accumulation plus élevé par rapport aux autres entreprises, 50 étant la moyenne.
Fréquence de mise à jour : Quotidienne
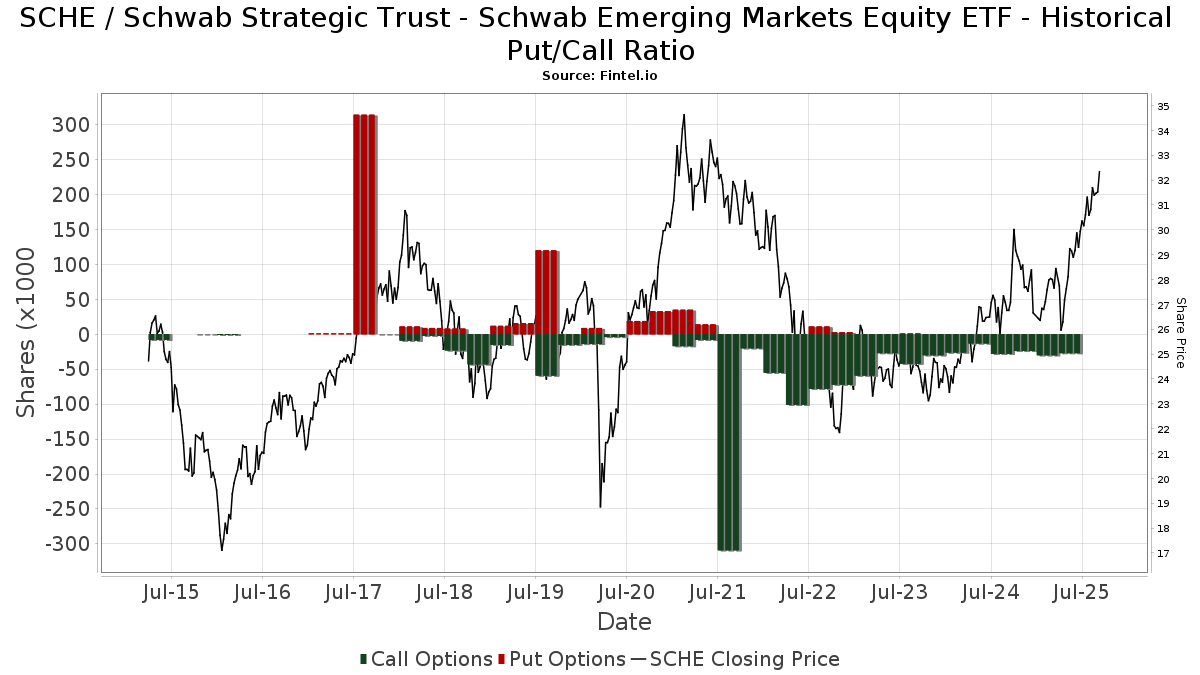
Ratio put/call institutionnel
En plus de signaler les actions et les dettes standard, les institutions ayant plus de 100 millions d'actifs sous gestion doivent également divulguer leurs positions en options de vente et d'achat. Étant donné que les options de vente indiquent généralement une confiance négative, et les options d'achat indiquent une confiance positive, nous pouvons avoir une idée de la confiance institutionnelle globale en traçant le ratio des ventes à découvert par rapport aux achats d'options. Le graphique à droite trace l'historique du ratio des ventes à découvert/achats d'options pour cet instrument.
L'utilisation du ratio put/call comme indicateur de la confiance des investisseurs permet de pallier à l'une des principales lacunes de l'utilisation de la participation institutionnelle totale, à savoir qu'une part importante des actifs sous gestion est investie passivement pour suivre les indices. Les fonds gérés passivement n'achètent généralement pas d'options, de sorte que l'indicateur du ratio put/call suit de plus près la confiance des fonds gérés activement.
Déclarations 13F et NPORT
Les détails des déclarations 13F sont gratuits. Les détails des déclarations NP nécessitent une adhésion premium. Les lignes vertes indiquent de nouvelles positions. Les lignes rouges indiquent des positions clôturées. Cliquez sur l'icône du lien pour voir l'historique complet des transactions.
Mettre à niveau
pour débloquer des données premium et les exporter vers Excel ![]() .
.
Important Note
In an effort to reduce load times for our mobile users, we are testing some ways to deliver lighter pages.
In this first test, we will deliver only the most recent 750 transactions (out of 890 for this stock). If you are interested in loading *all* the transactions for this company, click the "load all" button below. This is just a test and if you don't like it, please let us know by submitting some gentle feedback via the link at the bottom of this page.
Load All| Date de dépôt | Source | Investisseur | Type | Prix moyen (Est) |
Actions | Δ Actions (%) |
Valeur déclarée (1000 $) |
Δ Valeur (%) |
Allocation de portefeuille (%) |
|
|---|---|---|---|---|---|---|---|---|---|---|
| 2025-08-04 | 13F | HBK Sorce Advisory LLC | 1 352 414 | 19,17 | 40 762 | 30,28 | ||||
| 2025-07-15 | 13F | Patriot Investment Management Inc. | 165 182 | -1,86 | 4 979 | 7,28 | ||||
| 2025-08-04 | 13F | REDW Wealth LLC | 7 218 | 218 | ||||||
| 2025-08-11 | 13F | Diversified Portfolios, Inc. | 14 559 | -17,67 | 439 | -10,06 | ||||
| 2025-08-14 | 13F | Bnp Paribas Arbitrage, Sa | 0 | -100,00 | 0 | |||||
| 2025-08-14 | 13F | Raymond James Financial Inc | 213 009 | 5,72 | 6 420 | 15,59 | ||||
| 2025-07-21 | 13F | Cliftonlarsonallen Wealth Advisors, Llc | 160 686 | 172,21 | 4 843 | 197,66 | ||||
| 2025-08-15 | 13F | WFA of San Diego, LLC | 5 391 | -29,24 | 162 | -27,03 | ||||
| 2025-07-09 | 13F | Krilogy Financial LLC | 1 436 488 | 2,32 | 43 296 | 11,86 | ||||
| 2025-08-05 | 13F | Marshall Financial Group Inc /adv | 79 680 | -0,46 | 2 402 | 8,84 | ||||
| 2025-08-13 | 13F | Providence Capital Advisors, LLC | 396 | 12 | ||||||
| 2025-05-07 | 13F | Horan Capital Advisors, LLC. | 14 728 | -3,28 | 406 | 0,25 | ||||
| 2025-07-15 | 13F | Pine Haven Investment Counsel, Inc | 8 322 | -3,48 | 251 | 5,49 | ||||
| 2025-08-14 | 13F | Hrt Financial Lp | 59 515 | 20,17 | 2 | 0,00 | ||||
| 2025-07-28 | 13F | Hamilton Point Investment Advisors, LLC | 345 | 0,00 | 10 | 11,11 | ||||
| 2025-07-07 | 13F | Versant Capital Management, Inc | 4 937 | 0,08 | 149 | 9,63 | ||||
| 2025-07-30 | 13F | Evermay Wealth Management Llc | 15 370 | -1,02 | 463 | 8,18 | ||||
| 2025-07-08 | 13F | Parallel Advisors, LLC | 166 807 | 0,07 | 5 028 | 9,40 | ||||
| 2025-07-09 | 13F | Breakwater Investment Management | 77 522 | -3,15 | 2 337 | 5,89 | ||||
| 2025-05-16 | 13F | American Trust | 0 | -100,00 | 0 | -100,00 | ||||
| 2025-07-18 | 13F | SigFig Wealth Management, LLC | 379 446 | -2,63 | 11 425 | 108,79 | ||||
| 2025-08-12 | 13F | JMG Financial Group, Ltd. | 1 058 272 | 13,97 | 31 896 | 24,60 | ||||
| 2025-07-30 | 13F | Pittenger & Anderson Inc | 4 350 | 0,00 | 131 | 10,08 | ||||
| 2025-07-17 | 13F | Vermillion Wealth Management, Inc. | 7 779 | -0,78 | 234 | 8,33 | ||||
| 2025-07-30 | 13F | Avidian Wealth Solutions, LLC | 7 261 | -5,74 | 219 | 2,83 | ||||
| 2025-07-29 | 13F | Yoffe Investment Management, LLC | 13 228 | 0,01 | 399 | 9,34 | ||||
| 2025-04-22 | 13F | Veridan Wealth LLC | 44 762 | 1 234 | ||||||
| 2025-08-04 | 13F | Center for Financial Planning, Inc. | 0 | -100,00 | 0 | |||||
| 2025-08-04 | 13F | Hantz Financial Services, Inc. | 341 231 | 0,10 | 10 | 11,11 | ||||
| 2025-07-10 | 13F | Family Legacy Financial Solutions, LLC | 7 509 | 226 | ||||||
| 2025-07-14 | 13F | UMA Financial Services, Inc. | 1 138 | 0,00 | 34 | 9,68 | ||||
| 2025-08-14 | 13F | GWM Advisors LLC | 67 261 | 17,36 | 2 027 | 28,29 | ||||
| 2025-08-14 | 13F | Aqr Capital Management Llc | 34 463 | 145,11 | 1 039 | 168,22 | ||||
| 2025-08-13 | 13F | Kilter Group LLC | 0 | 0 | ||||||
| 2025-08-11 | 13F | Private Advisor Group, LLC | 79 348 | 1,34 | 2 392 | 10,80 | ||||
| 2025-07-15 | 13F | Evanson Asset Management, LLC | 14 066 | 0,08 | 424 | 9,30 | ||||
| 2025-04-29 | 13F | Raleigh Capital Management Inc. | 0 | -100,00 | 0 | |||||
| 2025-07-09 | 13F | VisionPoint Advisory Group, LLC | 10 924 | 33,68 | 329 | 46,22 | ||||
| 2025-08-12 | 13F | Athena Investment Management | 44 152 | -0,66 | 1 331 | 8,57 | ||||
| 2025-08-13 | 13F | Townsquare Capital Llc | 0 | -100,00 | 0 | |||||
| 2025-07-14 | 13F | CRA Financial Services, LLC | 7 007 | 211 | ||||||
| 2025-08-13 | 13F | Cheviot Value Management, LLC | 539 | 3,45 | 17 | 14,29 | ||||
| 2025-07-07 | 13F | Retirement Wealth Solutions LLC | 200 | 12,99 | 6 | 50,00 | ||||
| 2025-08-11 | 13F | HighTower Advisors, LLC | 10 141 479 | 2,91 | 305 664 | 12,50 | ||||
| 2025-07-28 | 13F | Frazier Financial Advisors, LLC | 28 | 1 | ||||||
| 2025-07-30 | 13F | Klingenstein Fields & Co Lp | 465 078 | -5,18 | 14 017 | 3,66 | ||||
| 2025-07-31 | 13F | CNB Bank | 0 | -100,00 | 0 | |||||
| 2025-07-08 | 13F | Twele Capital Management, Inc. | 10 140 | 2,77 | 306 | 12,13 | ||||
| 2025-07-11 | 13F/A | Umb Bank N A/mo | 3 495 | 336,88 | 105 | 377,27 | ||||
| 2025-08-06 | 13F | North Capital, Inc. | 618 | 0,00 | 19 | 5,88 | ||||
| 2025-08-06 | 13F | Csenge Advisory Group | 21 512 | 3,97 | 616 | 12,02 | ||||
| 2025-08-08 | 13F | Creative Planning | 19 526 618 | -2,75 | 588 532 | 6,32 | ||||
| 2025-07-29 | 13F | Clearview Wealth Advisors LLC | 20 325 | -1,19 | 613 | 7,94 | ||||
| 2025-07-17 | 13F | Charles Schwab Trust Co | 610 498 | -0,24 | 18 400 | 9,06 | ||||
| 2025-08-01 | 13F | MorganRosel Wealth Management, LLC | 317 991 | 0,64 | 9 584 | 10,02 | ||||
| 2025-07-15 | 13F | McAdam, LLC | 1 018 940 | -7,06 | 30 711 | 1,60 | ||||
| 2025-08-13 | 13F | EverSource Wealth Advisors, LLC | 539 | 1 318,42 | 16 | 1 500,00 | ||||
| 2025-08-05 | 13F | Dunhill Financial, LLC | 463 | -62,27 | 14 | -60,61 | ||||
| 2025-08-08 | 13F | Blankinship & Foster, LLC | 66 207 | 0,05 | 1 995 | 9,38 | ||||
| 2025-07-31 | 13F | CVA Family Office, LLC | 31 393 | 0,60 | 946 | 10,00 | ||||
| 2025-08-04 | 13F | NWK Group, Inc. | 14 | -6,67 | 0 | |||||
| 2025-08-13 | 13F | Jones Financial Companies Lllp | 1 209 821 | 2,18 | 36 450 | 11,60 | ||||
| 2025-08-25 | NP | SWYGX - Schwab Target 2040 Index Fund This fund is a listed as child fund of Charles Schwab Investment Management Inc and if that institution has disclosed ownership in this security, then these positions will not be double counted when calculating total shares and total value | 1 782 376 | -1,54 | 53 721 | 7,64 | ||||
| 2025-08-04 | 13F | Pensionmark Financial Group, Llc | 81 296 | 34,95 | 2 450 | 47,59 | ||||
| 2025-08-12 | 13F | Steward Partners Investment Advisory, Llc | 1 614 | -23,83 | 49 | -17,24 | ||||
| 2025-07-31 | 13F | CAP Partners, LLC | 52 472 | 64,60 | 1 582 | 80,07 | ||||
| 2025-08-14 | 13F | Hurley Capital, LLC | 2 049 | 0,10 | 62 | 8,93 | ||||
| 2025-08-07 | 13F | Resources Investment Advisors, LLC. | 49 420 | -2,09 | 1 490 | 7,05 | ||||
| 2025-07-10 | 13F | Worth Asset Management, LLC | 15 794 | 22,62 | 476 | 34,08 | ||||
| 2025-07-14 | 13F | Farmers & Merchants Investments Inc | 0 | -100,00 | 0 | |||||
| 2025-08-08 | 13F | Emerald Investment Partners, Llc | 111 902 | 1,64 | 3 373 | 11,10 | ||||
| 2025-07-15 | 13F | Boyd Wealth Management, LLC | 222 524 | 3,31 | 6 707 | 12,93 | ||||
| 2025-07-15 | 13F | Sightline Wealth Advisors, LLC | 151 163 | 4,02 | 4 556 | 13,73 | ||||
| 2025-08-13 | 13F | Certior Financial Group, Llc | 7 592 | -9,66 | 229 | -1,30 | ||||
| 2025-04-16 | 13F | Bernard Wealth Management Corp. | 0 | -100,00 | 0 | -100,00 | ||||
| 2025-07-29 | 13F | Ifrah Financial Services, Inc. | 90 362 | -0,84 | 2 724 | 8,40 | ||||
| 2025-08-14 | 13F | C M Bidwell & Associates Ltd | 31 803 | 7,23 | 959 | 17,26 | ||||
| 2025-05-15 | 13F | Ashton Thomas Securities, Llc | 0 | -100,00 | 0 | |||||
| 2025-08-14 | 13F | Guardian Wealth Advisors, Llc / Nc | 4 143 | -4,36 | 125 | 4,20 | ||||
| 2025-08-04 | 13F | Assetmark, Inc | 2 925 | 105,41 | 88 | 125,64 | ||||
| 2025-07-31 | 13F/A | Avion Wealth | 761 | -35,62 | 0 | |||||
| 2025-08-18 | 13F | Hollencrest Capital Management | 2 061 | 0,00 | 62 | 10,71 | ||||
| 2025-08-14 | 13F | Paragon Private Wealth Management, LLC | 11 806 | 27,58 | 356 | 39,22 | ||||
| 2025-07-10 | 13F | Focus Financial Network, Inc. | 60 629 | 0,02 | 1 827 | 9,34 | ||||
| 2025-08-06 | 13F | Legacy Bridge, LLC | 440 | 0,00 | 13 | 8,33 | ||||
| 2025-07-09 | 13F | Murphy, Middleton, Hinkle & Parker, Inc. | 28 852 | 0,00 | 795 | 0,00 | ||||
| 2025-07-03 | 13F | Whitcomb & Hess, Inc. | 32 126 | -0,49 | 968 | 8,76 | ||||
| 2025-08-13 | 13F | Per Stirling Capital Management, LLC. | 26 064 | 0,19 | 786 | 9,48 | ||||
| 2025-07-17 | 13F | Clay Northam Wealth Management, LLC | 48 247 | -1,53 | 1 454 | 7,70 | ||||
| 2025-08-14 | 13F | Comerica Bank | 33 644 | -3,11 | 1 014 | 5,96 | ||||
| 2025-07-16 | 13F | Motive Wealth Advisors | 15 945 | 0,00 | 481 | 9,34 | ||||
| 2025-08-06 | 13F | First Horizon Advisors, Inc. | 153 | -54,87 | 5 | -55,56 | ||||
| 2025-07-14 | 13F/A | Seek First Inc. | 103 968 | 6,20 | 3 134 | 16,08 | ||||
| 2025-08-11 | 13F | Pin Oak Investment Advisors Inc | 1 070 | 0 | ||||||
| 2025-05-14 | 13F | Clarkston Capital Partners, LLC | 0 | -100,00 | 0 | |||||
| 2025-04-23 | 13F | Eagle Strategies LLC | 0 | -100,00 | 0 | |||||
| 2025-07-24 | 13F | Brandywine Oak Private Wealth Llc | 110 236 | 3,86 | 3 323 | 13,53 | ||||
| 2025-07-18 | 13F | Victrix Investment Advisors | 17 074 | -3,60 | 515 | 9,36 | ||||
| 2025-08-25 | NP | SWB1Z - Schwab VIT Balanced Portfolio This fund is a listed as child fund of Charles Schwab Investment Management Inc and if that institution has disclosed ownership in this security, then these positions will not be double counted when calculating total shares and total value | 55 941 | -7,64 | 1 686 | 1,02 | ||||
| 2025-08-14 | 13F | Sand Hill Global Advisors, LLC | 23 792 | 0,00 | 717 | 9,47 | ||||
| 2025-08-08 | 13F | JFG Wealth Management, LLC | 40 489 | -14,75 | 1 220 | -6,80 | ||||
| 2025-08-15 | 13F | Equitable Holdings, Inc. | 8 575 | 10,60 | 258 | 21,13 | ||||
| 2025-08-05 | 13F | Snider Financial Group | 11 036 | 2,64 | 333 | 12,16 | ||||
| 2025-08-14 | 13F | UBS Group AG | 687 642 | 1,02 | 20 726 | 10,43 | ||||
| 2025-07-30 | 13F | Clune & Associates, Ltd. | 7 191 | 217 | ||||||
| 2025-08-12 | 13F | O'shaughnessy Asset Management, Llc | 16 037 | 2,81 | 483 | 12,33 | ||||
| 2025-08-08 | 13F | Altfest L J & Co Inc | 30 626 | -4,73 | 923 | 4,18 | ||||
| 2025-07-31 | 13F | Blue Sky Capital Consultants Group, Inc. | 7 414 | -4,14 | 223 | 4,69 | ||||
| 2025-07-22 | 13F | Appleton Partners Inc/ma | 11 966 | 16,84 | 0 | |||||
| 2025-07-28 | 13F | Axxcess Wealth Management, Llc | 56 760 | 7,85 | 1 711 | 17,93 | ||||
| 2025-08-06 | 13F | Bensler, LLC | 12 428 | -34,43 | 375 | -28,35 | ||||
| 2025-07-31 | 13F | Moser Wealth Advisors, LLC | 377 | 57,08 | 11 | 83,33 | ||||
| 2025-08-08 | 13F | Cetera Investment Advisers | 777 501 | 3,58 | 23 434 | 13,24 | ||||
| 2025-07-21 | 13F | Fortis Capital Advisors, LLC | 22 937 | -20,64 | 691 | -13,19 | ||||
| 2025-08-07 | 13F | CENTRAL TRUST Co | 26 | 1 | ||||||
| 2025-07-23 | 13F | Richardson Capital Management LLC | 9 377 | -1,98 | 283 | 7,22 | ||||
| 2025-07-10 | 13F | Tompkins Financial Corp | 1 358 | 0,00 | 41 | 8,11 | ||||
| 2025-08-06 | 13F | Valued Wealth Advisors LLC | 22 687 | 40,67 | 684 | 53,83 | ||||
| 2025-07-08 | 13F | FF Advisors,LLC | 18 526 | 0,00 | 558 | 7,31 | ||||
| 2025-08-12 | 13F | AlphaCore Capital LLC | 329 269 | 71 480,22 | 9 924 | 82 600,00 | ||||
| 2025-08-05 | 13F | Sunburst Financial Group, LLC | 39 195 | -0,40 | 1 181 | 8,95 | ||||
| 2025-04-29 | 13F | Callan Capital, LLC | 277 822 | -1,15 | 7 660 | 2,34 | ||||
| 2025-07-22 | 13F | Old National Bancorp /in/ | 10 985 | -34,71 | 331 | -28,51 | ||||
| 2025-08-07 | 13F | Meeder Advisory Services, Inc. | 16 556 | -36,81 | 499 | -31,02 | ||||
| 2025-07-15 | 13F | Alpha Omega Wealth Management LLC | 41 766 | -0,01 | 1 259 | 9,30 | ||||
| 2025-08-12 | 13F | DiMeo Schneider & Associates, L.L.C. | 20 138 | 607 | ||||||
| 2025-08-01 | 13F | Facet Wealth, Inc. | 7 155 | -0,49 | 218 | 5,85 | ||||
| 2025-07-25 | 13F | FIDELIS iM, LLC | 131 559 | 3,54 | 3 965 | 132 066,67 | ||||
| 2025-08-04 | 13F | Econ Financial Services Corp | 14 644 | -3,26 | 441 | 5,76 | ||||
| 2025-08-08 | 13F/A | Ignite Planners, LLC | 42 778 | 5,90 | 1 315 | 17,83 | ||||
| 2025-08-25 | NP | SWYEX - Schwab Target 2030 Index Fund This fund is a listed as child fund of Charles Schwab Investment Management Inc and if that institution has disclosed ownership in this security, then these positions will not be double counted when calculating total shares and total value | 899 161 | -2,23 | 27 101 | 6,89 | ||||
| 2025-08-04 | 13F | MeadowBrook Investment Advisors LLC | 2 905 | 0,00 | 88 | 8,75 | ||||
| 2025-08-12 | 13F | Calton & Associates, Inc. | 19 939 | -0,32 | 601 | 8,89 | ||||
| 2025-07-09 | 13F | Hardin Capital Partners, LLC | 11 660 | 0,35 | 353 | 10,00 | ||||
| 2025-08-11 | 13F | Bell Investment Advisors, Inc | 52 316 | 10,13 | 1 577 | 20,40 | ||||
| 2025-07-16 | 13F | Falcon Wealth Planning | 20 149 | -0,62 | 607 | 8,78 | ||||
| 2025-08-11 | 13F | Aspen Investment Management Inc | 22 457 | 0,00 | 1 | |||||
| 2025-08-11 | 13F | Delta Asset Management Llc/tn | 111 | 0,00 | 3 | 0,00 | ||||
| 2025-08-14 | 13F | Jane Street Group, Llc | 51 487 | -19,41 | 1 552 | -11,93 | ||||
| 2025-08-11 | 13F | Dorsey & Whitney Trust CO LLC | 14 292 | -27,04 | 431 | -20,37 | ||||
| 2025-08-12 | 13F | New Republic Capital, LLC | 721 | 0,00 | 22 | 10,53 | ||||
| 2025-07-10 | 13F | Trust Point Inc. | 39 468 | 1 190 | ||||||
| 2025-07-21 | 13F | Capital Planning LLC | 20 338 | 9,61 | 613 | 19,77 | ||||
| 2025-07-17 | 13F | Stone Point Wealth LLC | 9 296 | -3,60 | 280 | 5,66 | ||||
| 2025-08-07 | 13F | Arbor Trust Wealth Advisors, Llc | 9 259 | -32,70 | 279 | -26,39 | ||||
| 2025-07-22 | 13F | Strid Group, LLC | 196 633 | -3,98 | 5 927 | 4,98 | ||||
| 2025-08-05 | 13F | Carolinas Wealth Consulting Llc | 0 | -100,00 | 0 | |||||
| 2025-07-17 | 13F | Hengehold Capital Management Llc | 86 748 | -2,92 | 2 615 | 6,13 | ||||
| 2025-07-31 | 13F | Ballast Advisors Llc | 272 280 | -0,91 | 8 207 | 8,33 | ||||
| 2025-08-12 | 13F | Power Wealth Management Llc | 179 825 | 2,12 | 5 420 | 11,64 | ||||
| 2025-08-14 | 13F | Schwallier Wealth Management LLC | 0 | -100,00 | 0 | |||||
| 2025-07-16 | 13F | Rebalance, Llc | 1 996 502 | -5,92 | 60 175 | 2,85 | ||||
| 2025-08-04 | 13F | Joseph P. Lucia & Associates, LLC | 8 734 | -5,31 | 263 | 3,54 | ||||
| 2025-07-28 | 13F | RFG Advisory, LLC | 0 | -100,00 | 0 | |||||
| 2025-08-14 | 13F | Citadel Advisors Llc | Call | 11 700 | -3,31 | 353 | 5,71 | |||
| 2025-08-14 | 13F | Citadel Advisors Llc | 44 104 | 73,36 | 1 329 | 89,59 | ||||
| 2025-08-06 | 13F | SJA Financial Advisory, LLC | 31 060 | -0,27 | 936 | 9,09 | ||||
| 2025-04-23 | 13F | Sunesis Advisors, LLC | 12 698 | 0,00 | 350 | 3,55 | ||||
| 2025-08-14 | 13F | Benjamin Edwards Inc | 704 543 | 4,68 | 21 235 | 14,43 | ||||
| 2025-07-21 | 13F | Compass Planning Associates Inc | 3 071 | 0,13 | 93 | 9,52 | ||||
| 2025-07-16 | 13F | Kathmere Capital Management, LLC | 113 375 | 19,98 | 3 417 | 31,17 | ||||
| 2025-08-08 | 13F | Islay Capital Management, Llc | 3 157 | 0,00 | 95 | 9,20 | ||||
| 2025-07-15 | 13F | Foster Victor Wealth Advisors, LLC | 0 | -100,00 | 0 | |||||
| 2025-08-14 | 13F | Citadel Advisors Llc | Put | 0 | -100,00 | 0 | ||||
| 2025-08-13 | 13F | Northern Trust Corp | 21 524 | 1,54 | 649 | 10,96 | ||||
| 2025-06-24 | NP | SWMIX - Laudus International MarketMasters Fund Select Shares | 777 230 | -16,18 | 21 475 | -14,10 | ||||
| 2025-08-06 | 13F | Fairway Financial, LLC | 148 819 | -3,40 | 4 485 | 5,60 | ||||
| 2025-08-11 | 13F | Walter & Keenan Financial Consulting Co /mi/ /adv | 8 849 | 0,02 | 267 | 9,47 | ||||
| 2025-07-30 | 13F | Whittier Trust Co | 54 029 | -7,06 | 1 628 | 1,56 | ||||
| 2025-08-13 | 13F | Marshall Wace, Llp | 13 050 | 393 | ||||||
| 2025-08-13 | 13F | Capital Analysts, Inc. | 18 707 | 44,90 | 1 | |||||
| 2025-07-18 | 13F | RKL Wealth Management LLC | 151 391 | -41,69 | 4 563 | -36,26 | ||||
| 2025-08-14 | 13F | Wetherby Asset Management Inc | 39 145 | -8,54 | 1 180 | 3,51 | ||||
| 2025-07-18 | 13F | TPG Advisors LLC | 72 861 | 5,49 | 2 196 | 15,34 | ||||
| 2025-08-12 | 13F | Coldstream Capital Management Inc | 20 254 | -4,70 | 610 | 4,27 | ||||
| 2025-08-14 | 13F | TCG Advisory Services, LLC | 7 318 | 221 | ||||||
| 2025-08-22 | 13F | Carter Financial Group, INC. | 6 877 | 207 | ||||||
| 2025-07-25 | 13F | St. Louis Trust Co | 226 568 | 2,99 | 6 829 | 12,58 | ||||
| 2025-08-07 | 13F | Allworth Financial LP | 56 295 | -14,39 | 1 697 | -6,25 | ||||
| 2025-07-17 | 13F | Independence Bank of Kentucky | 2 | 0,00 | 0 | |||||
| 2025-08-08 | 13F | Smithfield Trust Co | 2 665 | 0,00 | 0 | |||||
| 2025-08-13 | 13F | Cerity Partners LLC | 838 237 | -4,08 | 25 266 | 4,87 | ||||
| 2025-07-16 | 13F | Gradient Capital Advisors, LLC | 14 873 | -0,76 | 448 | 8,47 | ||||
| 2025-05-14 | 13F | Toroso Investments, LLC | 0 | -100,00 | 0 | |||||
| 2025-08-01 | 13F | Y-Intercept (Hong Kong) Ltd | 34 276 | 1 033 | ||||||
| 2025-08-14 | 13F | Wilkins Miller Wealth Management, LLC | 36 251 | -1,88 | 1 093 | 7,27 | ||||
| 2025-07-18 | 13F | Pure Financial Advisors, Inc. | 13 378 | -14,78 | 403 | -6,71 | ||||
| 2025-07-22 | 13F | Grimes & Company, Inc. | 82 336 | 5,51 | 2 482 | 15,34 | ||||
| 2025-08-14 | 13F | Federation des caisses Desjardins du Quebec | 0 | -100,00 | 0 | |||||
| 2025-05-15 | 13F | Human Investing LLC | 0 | -100,00 | 0 | |||||
| 2025-08-06 | 13F | Disciplined Investors, L.L.C. | 34 258 | -1,65 | 1 033 | 7,50 | ||||
| 2025-08-14 | 13F | Two Sigma Securities, Llc | 0 | -100,00 | 0 | |||||
| 2025-08-25 | 13F/A | Promus Capital, LLC | 444 | -33,33 | 13 | -27,78 | ||||
| 2025-07-24 | 13F | FinDec Wealth Services, Inc. | 29 695 | -15,73 | 895 | -7,93 | ||||
| 2025-08-13 | 13F | Beacon Pointe Advisors, LLC | 172 420 | 2,02 | 5 197 | 11,53 | ||||
| 2025-05-06 | 13F | Quadrant Private Wealth Management, LLC | 0 | -100,00 | 0 | |||||
| 2025-08-08 | 13F | WASHINGTON TRUST Co | 0 | -100,00 | 0 | |||||
| 2025-05-14 | 13F | Van Hulzen Asset Management, LLC | 0 | -100,00 | 0 | |||||
| 2025-08-27 | 13F/A | Brinker Capital Investments, LLC | 31 469 | 19,02 | 948 | 30,22 | ||||
| 2025-08-12 | 13F | Global Retirement Partners, LLC | 35 110 | 22,45 | 1 058 | 38,66 | ||||
| 2025-05-14 | 13F | Kayne Anderson Rudnick Investment Management Llc | 0 | -100,00 | 0 | |||||
| 2025-08-13 | 13F | Ironwood Investment Management Llc | 8 200 | -1,78 | 247 | 7,39 | ||||
| 2025-08-14 | 13F | Headlands Technologies LLC | 1 436 | 43 | ||||||
| 2025-07-17 | 13F | Sage Rhino Capital Llc | 7 925 | 0,11 | 239 | 9,17 | ||||
| 2025-07-23 | 13F | Sax Wealth Advisors, Llc | 12 234 | 0,00 | 369 | 9,20 | ||||
| 2025-08-07 | 13F | Vise Technologies, Inc. | 18 092 | 545 | ||||||
| 2025-07-10 | 13F | Wealth Enhancement Advisory Services, Llc | 2 256 257 | -2,65 | 68 748 | 7,59 | ||||
| 2025-08-06 | 13F | ETF Store, Inc. | 8 880 | 0,00 | 268 | 9,43 | ||||
| 2025-08-12 | 13F | Cooper/haims Advisors, Llc | 1 267 630 | 2,12 | 38 206 | 11,64 | ||||
| 2025-07-29 | 13F | Curbstone Financial Management Corp | 86 850 | -2,20 | 2 618 | 6,90 | ||||
| 2025-08-12 | 13F | Asset Management Group, Inc. | 78 796 | 0,11 | 2 375 | 9,45 | ||||
| 2025-07-17 | 13F | Tempus Wealth Planning, LLC | 22 381 | 6,72 | 675 | 16,61 | ||||
| 2025-07-30 | 13F | Phillips Financial Management, Llc | 1 558 | 0,00 | 47 | 9,52 | ||||
| 2025-07-23 | 13F | Armbruster Capital Management, Inc. | 35 285 | -1,51 | 1 063 | 7,70 | ||||
| 2025-08-05 | 13F | GPS Wealth Strategies Group, LLC | 1 307 | -4,25 | 39 | 5,41 | ||||
| 2025-07-08 | 13F | Heartwood Wealth Advisors LLC | 1 530 631 | 0,44 | 46 133 | 9,80 | ||||
| 2025-08-01 | 13F | SYM FINANCIAL Corp | 15 869 | -4,40 | 478 | 4,60 | ||||
| 2025-07-22 | 13F | Evensky & Katz LLC | 19 035 | -3,49 | 1 | |||||
| 2025-07-18 | 13F | Trust Co Of Vermont | 33 | 0,00 | 1 | |||||
| 2025-07-31 | 13F | Cambridge Investment Research Advisors, Inc. | 297 716 | 0,33 | 9 | 0,00 | ||||
| 2025-07-16 | 13F | Badgley Phelps Wealth Managers, LLC | 98 063 | -2,55 | 2 956 | 6,52 | ||||
| 2025-08-14 | 13F | Moneta Group Investment Advisors Llc | 1 768 550 | 4,48 | 53 304 | 14,23 | ||||
| 2025-08-14 | 13F | Warren Averett Asset Management, LLC | 488 200 | 0,28 | 14 714 | 9,63 | ||||
| 2025-08-07 | 13F | Cascade Financial Partners, LLC | 119 109 | 0,00 | 3 590 | 9,32 | ||||
| 2025-07-15 | 13F | Retirement Guys Formula Llc | 119 322 | -0,04 | 3 596 | 9,27 | ||||
| 2025-05-14 | 13F | Mission Creek Capital Partners, Inc. | 0 | -100,00 | 0 | |||||
| 2025-07-11 | 13F | Pioneer Wealth Management Group | 104 790 | 14,78 | 3 158 | 25,47 | ||||
| 2025-08-12 | 13F | Franklin Resources Inc | 7 455 | 0,00 | 225 | 9,27 | ||||
| 2025-07-22 | 13F | Iron Horse Wealth Management, LLC | 727 | 0,00 | 22 | 5,00 | ||||
| 2025-08-13 | 13F | Baird Financial Group, Inc. | 24 826 | 5,65 | 748 | 15,61 | ||||
| 2025-08-11 | 13F | Plum Street Advisors, LLC | 127 498 | 24,20 | 3 843 | 35,76 | ||||
| 2025-08-12 | 13F | Wood Tarver Financial Group, LLC | 29 | 0,00 | 0 | |||||
| 2025-07-16 | 13F | MBE Wealth Management, LLC | 96 470 | 2,64 | 2 908 | 12,20 | ||||
| 2025-08-06 | 13F | Ironwood Wealth Management, LLC. | 40 835 | -38,11 | 1 231 | -32,38 | ||||
| 2025-08-14 | 13F | Murphy & Mullick Capital Management Corp | 25 529 | -3,19 | 784 | 7,84 | ||||
| 2025-08-12 | 13F | Tradition Wealth Management, LLC | 32 447 | -33,19 | 978 | -26,98 | ||||
| 2025-07-11 | 13F | Diversified Trust Co | 29 635 | 107,96 | 893 | 127,81 | ||||
| 2025-08-14 | 13F | Mariner, LLC | 1 407 161 | -0,21 | 42 412 | 9,08 | ||||
| 2025-08-14 | 13F | Old Mission Capital Llc | 12 879 | -96,55 | 388 | -96,23 | ||||
| 2025-08-14 | 13F | Greenline Partners, LLC | 42 703 | 19,96 | 1 287 | 9,35 | ||||
| 2025-08-14 | 13F | DRW Securities, LLC | 288 851 | 339,96 | 8 706 | 380,94 | ||||
| 2025-08-04 | 13F | Elite Life Management LLC | 8 927 | 269 | ||||||
| 2025-08-01 | 13F | James Investment Research Inc | 25 412 | 4,27 | 766 | 14,01 | ||||
| 2025-08-08 | 13F | Financial Gravity Companies, Inc. | 76 | 49,02 | 2 | 100,00 | ||||
| 2025-08-12 | 13F | BlackRock, Inc. | 6 752 | -0,01 | 204 | 9,14 | ||||
| 2025-08-08 | 13F | Horrell Capital Management, Inc. | 251 | 0,00 | 8 | 16,67 | ||||
| 2025-08-11 | 13F | Johnson Financial Group, LLC | 154 355 | -18,13 | 4 652 | -10,49 | ||||
| 2025-07-16 | 13F | Plancorp, LLC | 10 250 | 0,00 | 309 | 9,22 | ||||
| 2025-07-11 | 13F | Bond & Devick Financial Network, Inc. | 38 000 | 0,00 | 1 145 | 9,36 | ||||
| 2025-07-24 | 13F | Costello Asset Management, INC | 0 | -100,00 | 0 | |||||
| 2025-07-23 | 13F | Pillar Financial Advisors, LLC | 111 | 0,00 | 3 | 0,00 | ||||
| 2025-08-07 | 13F | PFG Advisors | 0 | -100,00 | 0 | |||||
| 2025-07-23 | 13F | Nbt Bank N A /ny | 342 | 0,00 | 10 | 11,11 | ||||
| 2025-08-08 | 13F | Glassman Wealth Services | 2 148 | -23,09 | 65 | -16,88 | ||||
| 2025-08-15 | 13F | Asset Allocation Strategies LLC | 99 855 | 7,74 | 3 010 | 17,77 | ||||
| 2025-07-16 | 13F | St Germain D J Co Inc | 0 | -100,00 | 0 | |||||
| 2025-07-31 | 13F | Schneider Downs Wealth Management Advisors, LP | 79 060 | 21,01 | 2 383 | 32,26 | ||||
| 2025-08-07 | 13F | Fund Evaluation Group, LLC | 918 885 | -1,34 | 27 695 | 7,85 | ||||
| 2025-07-23 | 13F | Godsey & Gibb Associates | 1 659 | 50 | ||||||
| 2025-07-23 | 13F | Roundview Capital LLC | 35 526 | -15,57 | 1 071 | -7,76 | ||||
| 2025-07-16 | 13F | Flower City Capital | 7 271 | 0,00 | 219 | 9,50 | ||||
| 2025-07-14 | 13F | BlueSky Wealth Advisors, LLC | 1 177 126 | 3,64 | 35 479 | 13,30 | ||||
| 2025-07-18 | 13F | Truist Financial Corp | 36 556 | -1,68 | 1 102 | 7,41 | ||||
| 2025-07-30 | 13F | BCK Partners, Inc. | 99 457 | -2,23 | 2 998 | 6,88 | ||||
| 2025-07-10 | 13F | Voisard Asset Management Group, Inc. | 9 206 | -28,87 | 277 | -22,19 | ||||
| 2025-07-22 | 13F | Sage Financial Group Inc | 23 237 | 38,22 | 700 | 51,19 | ||||
| 2025-05-15 | 13F | Windsor Advisory Group, LLC | 0 | -100,00 | 0 | |||||
| 2025-07-30 | 13F | Exencial Wealth Advisors, Llc | 12 297 | -1,33 | 371 | 7,87 | ||||
| 2025-08-06 | 13F | AE Wealth Management LLC | 6 395 | -8,55 | 193 | 0,00 | ||||
| 2025-08-08 | 13F | Capital Investment Advisory Services, LLC | 42 341 | 12,12 | 1 276 | 22,57 | ||||
| 2025-08-12 | 13F | CIBC Private Wealth Group, LLC | 12 788 | -12,22 | 385 | 8,45 | ||||
| 2025-08-14 | 13F | Bishop & Co Investment Management, LLC | 142 239 | -4,52 | 4 287 | 4,38 | ||||
| 2025-05-09 | 13F | McClarren Financial Advisors, Inc. | 0 | -100,00 | 0 | |||||
| 2025-05-15 | 13F | CAPROCK Group, Inc. | 8 230 | -12,56 | 227 | -9,60 | ||||
| 2025-07-14 | 13F | Maryland Capital Advisors Inc. | 22 | 0,00 | 1 | |||||
| 2025-07-23 | 13F | Watershed Private Wealth Llc | 28 254 | -16,93 | 852 | -9,18 | ||||
| 2025-08-08 | 13F | Breed's Hill Capital LLC | 78 457 | 0,00 | 2 365 | 9,29 | ||||
| 2025-08-14 | 13F | Guardian Wealth Management, Inc. | 0 | -100,00 | 0 | |||||
| 2025-08-12 | 13F | Coston, McIsaac & Partners | 67 | 0,00 | 0 | |||||
| 2025-08-12 | 13F | Clal Insurance Enterprises Holdings Ltd | 8 548 | -8,65 | 0 | |||||
| 2025-08-06 | 13F | HORAN Wealth, LLC | 15 137 | 456 | ||||||
| 2025-07-18 | 13F | Schaeffer Financial LLC | 9 832 | 0,12 | 296 | 9,63 | ||||
| 2025-08-04 | 13F | Bristlecone Advisors, LLC | 2 498 | 0,12 | 75 | 10,29 | ||||
| 2025-04-16 | 13F | Smithbridge Asset Management Inc/de | 0 | -100,00 | 0 | |||||
| 2025-07-29 | 13F | Tradewinds Capital Management, LLC | 628 | -0,63 | 19 | 5,88 | ||||
| 2025-08-01 | 13F | Advisory Alpha, LLC | 7 656 | 0,17 | 231 | 9,52 | ||||
| 2025-07-22 | 13F | Gemmer Asset Management LLC | 257 789 | 10,40 | 7 770 | 20,69 | ||||
| 2025-04-24 | 13F | Bordeaux Wealth Advisors LLC | 0 | -100,00 | 0 | |||||
| 2025-07-07 | 13F | Vishria Bird Financial Group, LLC | 11 007 | 0,00 | 332 | 9,24 | ||||
| 2025-07-30 | 13F | Crewe Advisors LLC | 3 977 | 7,69 | 120 | 17,82 | ||||
| 2025-08-14 | 13F | Apriem Advisors | 272 974 | -7,84 | 8 227 | 0,76 | ||||
| 2025-07-17 | 13F | Sound Income Strategies, LLC | 1 210 | 10,70 | 36 | 20,00 | ||||
| 2025-08-12 | 13F | Armor Investment Advisors, LLC | 136 084 | 1,35 | 4 102 | 10,81 | ||||
| 2025-08-12 | 13F | OneAscent Financial Services LLC | 27 138 | -51,41 | 1 | -100,00 | ||||
| 2025-04-23 | 13F | SOL Capital Management CO | 0 | -100,00 | 0 | |||||
| 2025-07-23 | 13F | Bellevue Asset Management, Llc | 572 | 1 230,23 | 17 | 1 600,00 | ||||
| 2025-04-22 | 13F | Rappaport Reiches Capital Management, LLC | 50 328 | 0,10 | 1 388 | 3,66 | ||||
| 2025-07-29 | 13F | BKD Wealth Advisors, LLC | 0 | -100,00 | 0 | |||||
| 2025-08-14 | 13F | Great Valley Advisor Group, Inc. | 91 130 | -5,14 | 2 747 | 3,70 | ||||
| 2025-08-14 | 13F | Fmr Llc | 1 633 262 | 2,55 | 49 227 | 12,11 | ||||
| 2025-08-06 | 13F | Legacy Wealth Managment, LLC/ID | 0 | -100,00 | 0 | |||||
| 2025-08-06 | 13F | Nicholas Hoffman & Company, LLC. | 227 256 | 7,46 | 6 849 | 17,48 | ||||
| 2025-05-07 | 13F | Vista Private Wealth Partners. LLC | 0 | -100,00 | 0 | |||||
| 2025-07-25 | 13F | Lodestar Private Asset Management Llc | 67 673 | -6,79 | 2 040 | 1,90 | ||||
| 2025-07-09 | 13F | Navigation Wealth Management, Inc. | 21 904 | 660 | ||||||
| 2025-08-04 | 13F | Savvy Advisors, Inc. | 26 340 | 26,46 | 794 | 38,15 | ||||
| 2025-08-05 | 13F | Code Waechter LLC | 0 | -100,00 | 0 | |||||
| 2025-08-08 | 13F | Omega Financial Group, LLC | 100 587 | -0,41 | 3 032 | 8,87 | ||||
| 2025-05-15 | 13F/A | Orion Portfolio Solutions, LLC | 26 440 | 14,02 | 729 | 17,99 | ||||
| 2025-07-31 | 13F | Glass Jacobson Investment Advisors llc | 2 002 | -70,58 | 60 | -66,85 | ||||
| 2025-07-29 | 13F | Private Wealth Management Group, LLC | 6 665 | 0,00 | 201 | 9,29 | ||||
| 2025-07-31 | 13F | Cardinal Point Capital Management, ULC | 0 | -100,00 | 0 | |||||
| 2025-08-14 | 13F | Sentinus, LLC | 21 958 | 6,02 | 662 | 15,76 | ||||
| 2025-05-15 | 13F | Rakuten Investment Management, Inc. | 2 013 903 | 20,74 | 55 604 | 13,04 | ||||
| 2025-07-24 | 13F | Thompson Investment Management, Inc. | 56 154 | 0,87 | 1 692 | 10,30 | ||||
| 2025-07-28 | 13F | WealthPlan Investment Management, LLC | 18 436 | -1,96 | 556 | 7,14 | ||||
| 2025-07-29 | 13F | Chicago Partners Investment Group LLC | 29 869 | -0,66 | 935 | 10,65 | ||||
| 2025-08-12 | 13F | Howe & Rusling Inc | 5 133 | 48,05 | 155 | 62,11 | ||||
| 2025-07-23 | 13F | Valmark Advisers, Inc. | 70 122 | 2,64 | 2 113 | 12,21 | ||||
| 2025-08-13 | 13F | Natixis Advisors, L.p. | 47 020 | 38,36 | 1 | |||||
| 2025-08-13 | 13F | Pinkerton Retirement Specialists, LLC | 120 864 | 9,77 | 3 643 | 20,00 | ||||
| 2025-08-19 | 13F | Anchor Investment Management, LLC | 61 212 | -11,20 | 1 845 | -2,95 | ||||
| 2025-04-15 | 13F | Wealthcare Advisory Partners LLC | 0 | -100,00 | 0 | |||||
| 2025-05-16 | 13F | Coppell Advisory Solutions LLC | 0 | -100,00 | 0 | |||||
| 2025-08-14 | 13F | Susquehanna International Group, Llp | Call | 16 000 | -12,57 | 482 | -4,37 | |||
| 2025-07-14 | 13F | Parkshore Wealth Management, Inc. | 8 248 | -9,84 | 249 | -1,59 | ||||
| 2025-08-15 | 13F | Fft Wealth Management Llc | 8 848 | -22,23 | 275 | -12,14 | ||||
| 2025-08-01 | 13F | Fort Vancouver Investment Management, LLC | 31 611 | -4,14 | 953 | 4,73 | ||||
| 2025-08-06 | 13F | Geometric Wealth Advisors | 13 148 | -12,27 | 396 | -4,12 | ||||
| 2025-05-15 | 13F | Rise Advisors, LLC | 0 | -100,00 | 0 | -100,00 | ||||
| 2025-07-09 | 13F | Fragasso Group Inc. | 23 118 | -30,30 | 697 | -23,85 | ||||
| 2025-07-16 | 13F | Tru Independence Asset Management 2, Llc | 11 910 | -14,42 | 359 | -6,53 | ||||
| 2025-08-11 | 13F | Birchbrook, Inc. | 4 966 | 0,00 | 150 | 9,56 | ||||
| 2025-07-28 | 13F | Kiker Wealth Management, LLC | 0 | -100,00 | 0 | |||||
| 2025-08-14 | 13F | Atomi Financial Group, Inc. | 10 073 | -5,79 | 304 | 3,06 | ||||
| 2025-08-07 | 13F | BOK Financial Private Wealth, Inc. | 0 | -100,00 | 0 | |||||
| 2025-07-14 | 13F | Clayton Financial Group LLC | 0 | -100,00 | 0 | |||||
| 2025-07-09 | 13F | Parkside Advisors LLC | 12 949 | 27,68 | 390 | 39,78 | ||||
| 2025-08-11 | 13F | United Advisor Group, LLC | 7 254 | 219 | ||||||
| 2025-08-13 | 13F | SCS Capital Management LLC | 749 377 | 2,12 | 22 586 | 11,64 | ||||
| 2025-08-05 | 13F | Key FInancial Inc | 452 | 0,00 | 14 | 8,33 | ||||
| 2025-08-13 | 13F | GeoWealth Management, LLC | 3 146 | 95 | ||||||
| 2025-07-08 | 13F | Goldstone Financial Group, LLC | 45 818 | 17,88 | 1 396 | 30,35 | ||||
| 2025-08-14 | 13F | Graney & King, LLC | 27 | 0,00 | 1 | |||||
| 2025-04-29 | 13F | Lee Danner & Bass Inc | 0 | -100,00 | 0 | |||||
| 2025-05-12 | 13F | Integrity Financial Corp /WA | 0 | -100,00 | 0 | -100,00 | ||||
| 2025-08-05 | 13F | NewSquare Capital LLC | 10 | 0,00 | 0 | |||||
| 2025-07-23 | 13F | Roberts Wealth Advisors, LLC | 71 950 | -1,54 | 2 169 | 7,65 | ||||
| 2025-08-12 | 13F | SRS Capital Advisors, Inc. | 704 | 1 802,70 | 21 | 2 000,00 | ||||
| 2025-07-24 | 13F | Us Bancorp \de\ | 3 445 757 | -5,69 | 103 855 | 3,10 | ||||
| 2025-08-08 | 13F | Hartland & Co., LLC | 8 398 | 0,01 | 253 | 9,52 | ||||
| 2025-07-07 | 13F | Bangor Savings Bank | 156 127 | -2,21 | 4 706 | 6,91 | ||||
| 2025-05-14 | 13F | Renaissance Technologies Llc | 0 | -100,00 | 0 | |||||
| 2025-07-14 | 13F | AdvisorNet Financial, Inc | 13 001 | 2,73 | 392 | 12,36 | ||||
| 2025-07-28 | 13F | Chesapeake Wealth Management | 73 445 | 3,28 | 2 214 | 12,91 | ||||
| 2025-07-17 | 13F | Gleason Group, Inc. | 111 154 | 0,18 | 3 350 | 9,55 | ||||
| 2025-07-16 | 13F | Dakota Wealth Management | 83 202 | 66,27 | 2 508 | 81,80 | ||||
| 2025-07-23 | 13F | Laraway Financial Inc | 17 196 | 0,00 | 518 | 9,28 | ||||
| 2025-07-21 | 13F/A | Abacus Planning Group, Inc. | 19 846 | -3,65 | 598 | 5,47 | ||||
| 2025-07-22 | 13F | Valeo Financial Advisors, LLC | 55 938 | 320,81 | 1 686 | 360,38 | ||||
| 2025-08-14 | 13F | Integrated Wealth Concepts LLC | 40 664 | 6,44 | 1 226 | 16,33 | ||||
| 2025-08-05 | 13F | Avant Financial Advisors LLC | 19 634 | 0,00 | 592 | 9,24 | ||||
| 2025-07-28 | 13F | Ritholtz Wealth Management | 82 420 | 510,56 | 2 484 | 567,74 | ||||
| 2025-07-16 | 13F | Diversified Enterprises, LLC | 57 482 | 13,59 | 1 733 | 24,16 | ||||
| 2025-08-14 | 13F | Susquehanna International Group, Llp | 0 | -100,00 | 0 | |||||
| 2025-07-29 | 13F | Gladwyn Financial Advisors, Inc. | 452 | 14 | ||||||
| 2025-08-05 | 13F | American Capital Advisory, LLC | 860 | -64,83 | 26 | -62,69 | ||||
| 2025-08-14 | 13F | Acas, Llc | 7 919 | 0,00 | 251 | 14,68 | ||||
| 2025-07-22 | 13F | Noble Family Wealth, LLC | 44 852 | -2,41 | 1 352 | 6,63 | ||||
| 2025-08-25 | NP | SWYJX - Schwab Target 2055 Index Fund This fund is a listed as child fund of Charles Schwab Investment Management Inc and if that institution has disclosed ownership in this security, then these positions will not be double counted when calculating total shares and total value | 1 720 265 | 1,72 | 51 849 | 11,21 | ||||
| 2025-07-17 | 13F | Johnson Bixby & Associates, LLC | 42 305 | -7,62 | 1 275 | 1,03 | ||||
| 2025-07-25 | 13F | RHS Financial, LLC | 7 236 | -20,88 | 218 | -13,49 | ||||
| 2025-07-16 | 13F | ORG Wealth Partners, LLC | 1 974 | 60 | ||||||
| 2025-07-22 | 13F | David Wealth Management LLC | 7 992 | 241 | ||||||
| 2025-07-21 | 13F | Rainey & Randall Investment Management Inc. | 1 045 319 | -0,55 | 31 506 | 8,72 | ||||
| 2025-07-23 | 13F | Friedenthal Financial | 2 012 | 0,40 | 61 | 9,09 | ||||
| 2025-07-25 | 13F | Apollon Wealth Management, LLC | 100 651 | -4,22 | 3 034 | 4,69 | ||||
| 2025-08-14 | 13F | Oxford Financial Group Ltd | 31 160 | 0,00 | 939 | 9,31 | ||||
| 2025-07-30 | 13F | Wbh Advisory Inc | 177 368 | -10,56 | 5 346 | -2,23 | ||||
| 2025-07-09 | 13F | Thrive Wealth Management, LLC | 8 473 | 8,81 | 255 | 19,16 | ||||
| 2025-08-05 | 13F | Freestone Capital Holdings, LLC | 9 295 | 0,98 | 280 | 10,67 | ||||
| 2025-07-25 | 13F | PrairieView Partners, LLC | 94 173 | -3,88 | 3 | 0,00 | ||||
| 2025-07-02 | 13F | Marotta Asset Management | 155 361 | -24,85 | 4 683 | -22,38 | ||||
| 2025-07-15 | 13F | Bfsg, Llc | 12 258 | -1,91 | 369 | 7,27 | ||||
| 2025-07-17 | 13F | Janney Montgomery Scott LLC | 16 681 | -67,27 | 1 | -100,00 | ||||
| 2025-07-17 | 13F | Nelson, Van Denburg & Campbell Wealth Management Group, LLC | 67 366 | -0,57 | 2 030 | 8,67 | ||||
| 2025-07-25 | 13F | Sequoia Financial Advisors, LLC | 71 608 | -64,20 | 2 158 | -60,87 | ||||
| 2025-08-14 | 13F | Hancock Whitney Corp | 64 760 | 0,17 | 1 952 | 9,48 | ||||
| 2025-04-30 | 13F | Sofos Investments, Inc. | 76 | 2 | -94,29 | |||||
| 2025-08-12 | 13F | XTX Topco Ltd | 7 537 | 227 | ||||||
| 2025-08-14 | 13F | Ancora Advisors, LLC | 12 933 | -1,79 | 390 | 7,16 | ||||
| 2025-07-08 | 13F/A | Salem Investment Counselors Inc | 14 844 | -1,94 | 447 | 7,19 | ||||
| 2025-08-12 | 13F | TCTC Holdings, LLC | 10 | 0,00 | 0 | |||||
| 2025-08-25 | NP | SWYHX - Schwab Target 2045 Index Fund This fund is a listed as child fund of Charles Schwab Investment Management Inc and if that institution has disclosed ownership in this security, then these positions will not be double counted when calculating total shares and total value | 1 431 471 | -0,91 | 43 145 | 8,32 | ||||
| 2025-08-11 | 13F | Wealthspire Advisors, LLC | 1 908 570 | 0,91 | 57 524 | 10,32 | ||||
| 2025-08-11 | 13F | North Forty Two & Co. | 81 578 | 2,64 | 2 459 | 12,19 | ||||
| 2025-07-23 | 13F | Pure Portfolios Holdings Llc | 494 578 | 1,19 | 14 907 | 10,62 | ||||
| 2025-08-06 | 13F | Summit Wealth & Retirement Planning, Inc. | 583 127 | 4,88 | 17 575 | 14,66 | ||||
| 2025-07-09 | 13F | Kearns & Associates LLC | 25 239 | 0,00 | 761 | 9,35 | ||||
| 2025-07-28 | 13F | Rosenberg Matthew Hamilton | 19 264 | -0,88 | 581 | 8,41 | ||||
| 2025-08-08 | 13F | Meridian Wealth Management, LLC | 15 013 | -3,15 | 452 | 5,85 | ||||
| 2025-08-14 | 13F | Peapack Gladstone Financial Corp | 51 510 | -2,78 | 2 | 0,00 | ||||
| 2025-07-16 | 13F | Signaturefd, Llc | 17 297 | -0,10 | 521 | 9,22 | ||||
| 2025-07-07 | 13F | Investors Research Corp | 385 | 0,00 | 12 | 10,00 | ||||
| 2025-07-07 | 13F | Wilson & Boucher Capital Management, LLC | 16 095 | 0,00 | 485 | 9,48 | ||||
| 2025-07-24 | 13F | Cyndeo Wealth Partners, LLC | 0 | -100,00 | 0 | |||||
| 2025-08-13 | 13F | Cresset Asset Management, LLC | 339 932 | -1,57 | 10 246 | 7,60 | ||||
| 2025-07-24 | 13F | Capital Advisors, Ltd. LLC | 10 913 | -12,17 | 0 | |||||
| 2025-08-25 | NP | SWYFX - Schwab Target 2035 Index Fund This fund is a listed as child fund of Charles Schwab Investment Management Inc and if that institution has disclosed ownership in this security, then these positions will not be double counted when calculating total shares and total value | 1 135 771 | -0,89 | 34 232 | 8,35 | ||||
| 2025-07-17 | 13F | HB Wealth Management, LLC | 31 422 | -10,38 | 947 | -1,97 | ||||
| 2025-08-14 | 13F | Boyer & Corporon Wealth Management, LLC | 18 297 | -3,66 | 551 | 5,35 | ||||
| 2025-08-12 | 13F | Frontier Asset Management, LLC | 26 006 | -10,72 | 784 | -2,49 | ||||
| 2025-08-06 | 13F | Golden State Wealth Management, LLC | 10 447 | -48,47 | 315 | -43,73 | ||||
| 2025-07-30 | 13F | Rehmann Capital Advisory Group | 14 683 | 0,00 | 443 | 9,41 | ||||
| 2025-08-11 | 13F | Avantax Planning Partners, Inc. | 10 639 | 1,51 | 321 | 11,11 | ||||
| 2025-04-16 | 13F | Crowley Wealth Management, Inc. | 0 | -100,00 | 0 | |||||
| 2025-07-18 | 13F | Pacific Point Advisors, LLC | 6 864 | -9,97 | 207 | -1,90 | ||||
| 2025-04-29 | 13F | Rice Partnership, LLC | 0 | -100,00 | 0 | |||||
| 2025-07-24 | 13F | Comprehensive Money Management Services LLC | 12 133 | -3,73 | 366 | 5,19 | ||||
| 2025-08-11 | 13F | Lowe Brockenbrough & Co Inc | 38 108 | -1,17 | 1 149 | 8,00 | ||||
| 2025-08-12 | 13F | Up Strategic Wealth Investment Advisors Llc | 75 786 | 9,89 | 2 284 | 20,15 | ||||
| 2025-07-01 | 13F | Harbor Investment Advisory, Llc | 15 | 0,00 | 0 | |||||
| 2025-08-11 | 13F | Alteri Wealth LLC | 7 497 | 226 | ||||||
| 2025-04-23 | 13F | Security National Bank | 0 | -100,00 | 0 | |||||
| 2025-07-14 | 13F | Abound Wealth Management | 16 681 | -8,98 | 503 | -0,59 | ||||
| 2025-08-11 | 13F | Principal Securities, Inc. | 81 707 | 281,17 | 2 463 | 331,93 | ||||
| 2025-08-05 | 13F | Huntington National Bank | 1 | -100,00 | ||||||
| 2025-07-31 | 13F | Whipplewood Advisors, LLC | 927 | 1 395,16 | 28 | 8,00 | ||||
| 2025-07-29 | 13F | Stratos Wealth Advisors, LLC | 10 010 | -40,50 | 302 | -34,99 | ||||
| 2025-08-14 | 13F | Visionary Wealth Advisors | 250 922 | -20,41 | 7 563 | -13,00 | ||||
| 2025-07-10 | 13F | Wedmont Private Capital | 281 835 | 1,56 | 8 503 | 16,23 | ||||
| 2025-07-25 | 13F | Johnson Investment Counsel Inc | 6 894 | -28,50 | 208 | -21,89 | ||||
| 2025-07-09 | 13F | Procyon Private Wealth Partners, LLC | 15 617 | -20,60 | 471 | -13,28 | ||||
| 2025-07-07 | 13F | Peterson Wealth Advisors, LLC | 9 795 | 3,72 | 295 | 27,16 | ||||
| 2025-07-25 | 13F | Ackerman Capital Advisors, LLC | 225 814 | -0,61 | 6 806 | 8,67 | ||||
| 2025-08-04 | 13F | Spire Wealth Management | 364 | 0,00 | 11 | 0,00 | ||||
| 2025-08-05 | 13F | Strategic Financial Concepts, LLC | 13 739 | -1,78 | 414 | 7,53 | ||||
| 2025-07-29 | 13F | Private Trust Co Na | 10 972 | -7,32 | 331 | 1,23 | ||||
| 2025-07-16 | 13F | Newton One Investments LLC | 4 865 | 0,12 | 147 | 9,77 | ||||
| 2025-08-08 | 13F | Bailard, Inc. | 50 199 | -7,34 | 1 513 | 1,27 | ||||
| 2025-08-12 | 13F | Ameritas Investment Partners, Inc. | 24 165 | -0,19 | 728 | 9,15 | ||||
| 2025-08-14 | 13F | Smartleaf Asset Management LLC | 19 515 | -10,79 | 588 | -2,65 | ||||
| 2025-08-12 | 13F | Aspiring Ventures, LLC | 16 202 | 0,00 | 488 | 7,25 | ||||
| 2025-06-12 | 13F/A | Deutsche Bank Ag\ | 0 | -100,00 | 0 | |||||
| 2025-08-08 | 13F | Firestone Capital Management | 27 917 | -2,23 | 841 | 6,86 | ||||
| 2025-08-14 | 13F | IHT Wealth Management, LLC | 324 196 | 1 505,01 | 9 771 | 1 657,37 | ||||
| 2025-08-04 | 13F | Clear Investment Research, Llc | 3 878 | -0,26 | 117 | 8,41 | ||||
| 2025-07-29 | 13F | Sigma Investment Counselors Inc | 10 430 | 33,72 | 314 | 46,05 | ||||
| 2025-04-25 | 13F | EnRich Financial Partners LLC | 0 | -100,00 | 0 | |||||
| 2025-08-11 | 13F | VSM Wealth Advisory, LLC | 9 972 | 0,04 | 301 | 9,49 | ||||
| 2025-08-14 | 13F/A | Rockefeller Capital Management L.P. | 22 894 | 97,33 | 690 | 116,30 | ||||
| 2025-08-12 | 13F | BWM Planning, LLC | 17 828 | 0,00 | 537 | 9,37 | ||||
| 2025-07-17 | 13F | Wolff Wiese Magana Llc | 24 | 1 | ||||||
| 2025-08-13 | 13F | Continuum Advisory, LLC | 0 | -100,00 | 0 | |||||
| 2025-05-02 | 13F | United Community Bank | 0 | -100,00 | 0 | |||||
| 2025-07-18 | 13F | Bridge Generations Wealth Management Llc | 0 | -100,00 | 0 | |||||
| 2025-07-16 | 13F | Perigon Wealth Management, LLC | 141 572 | 0,99 | 4 267 | 10,40 | ||||
| 2025-08-04 | 13F | Roble, Belko & Company, Inc | 11 524 | 0,01 | 0 | |||||
| 2025-07-11 | 13F | Pinnacle Bancorp, Inc. | 4 403 | 0,00 | 133 | 9,09 | ||||
| 2025-08-11 | 13F | Ritter Daniher Financial Advisory LLC / DE | 320 | 0,00 | 10 | 12,50 | ||||
| 2025-07-10 | 13F | Global Financial Private Client, LLC | 36 571 | 6,43 | 1 102 | 16,37 | ||||
| 2025-07-22 | 13F | Belpointe Asset Management LLC | 22 937 | -20,64 | 691 | -13,19 | ||||
| 2025-07-24 | 13F | PDS Planning, Inc | 9 153 | 0,82 | 276 | 10,00 | ||||
| 2025-07-28 | 13F | Revolve Wealth Partners, LLC | 0 | -100,00 | 0 | |||||
| 2025-05-15 | 13F | Lgl Partners, Llc | 0 | -100,00 | 0 | |||||
| 2025-08-12 | 13F | Allen Capital Group, LLC | 54 819 | 1,13 | 1 652 | 10,58 | ||||
| 2025-08-11 | 13F | Morling Financial Advisors, LLC | 29 392 | -0,48 | 886 | 8,72 | ||||
| 2025-08-14 | 13F | Betterment LLC | 105 595 | 17,93 | 3 | 50,00 | ||||
| 2025-07-29 | 13F | TFC Financial Management | 1 307 | 0,00 | 39 | 8,33 | ||||
| 2025-08-04 | 13F | JDM Financial Group LLC | 2 029 | 0,00 | 61 | 10,91 | ||||
| 2025-07-22 | 13F | DBK Financial Counsel, LLC | 8 240 | 0,00 | 248 | 9,25 | ||||
| 2025-08-12 | 13F | J.w. Cole Advisors, Inc. | 9 720 | 26,73 | 293 | 38,39 | ||||
| 2025-07-16 | 13F/A | CX Institutional | 174 090 | 0,00 | 5 | 25,00 | ||||
| 2025-07-29 | 13F | Lyell Wealth Management, Lp | 31 315 | 9,57 | 944 | 19,82 | ||||
| 2025-07-11 | 13F | Seacrest Wealth Management, Llc | 37 541 | -3,18 | 1 131 | 5,90 | ||||
| 2025-08-06 | 13F | Commonwealth Equity Services, Llc | 432 000 | 23,98 | 13 | 44,44 | ||||
| 2025-07-31 | 13F | FSM Wealth Advisors, LLC | 38 241 | 117,77 | 1 152 | 138,02 | ||||
| 2025-08-11 | 13F | Bellwether Advisors, LLC | 3 676 | 0,00 | 111 | 8,91 | ||||
| 2025-08-01 | 13F | Envestnet Asset Management Inc | 2 276 317 | -0,06 | 68 608 | 9,26 | ||||
| 2025-07-31 | 13F | Guardian Financial Partners, LLC | 201 254 | 2,39 | 6 066 | 11,94 | ||||
| 2025-08-11 | 13F | Aptus Capital Advisors, LLC | 51 228 | 1,37 | 1 544 | 10,84 | ||||
| 2025-08-05 | 13F | Mission Wealth Management, Lp | 180 113 | 420,77 | 5 429 | 469,57 | ||||
| 2025-07-31 | 13F | BIP Alliance, LLC | 21 202 | -2,77 | 639 | 6,32 | ||||
| 2025-07-15 | 13F | Main Street Group, LTD | 613 | 0,16 | 18 | 12,50 | ||||
| 2025-08-14 | 13F | DecisionPoint Financial, LLC | 0 | -100,00 | 0 | |||||
| 2025-08-13 | 13F | Northwestern Mutual Wealth Management Co | 3 693 479 | 86,75 | 111 321 | 104,16 | ||||
| 2025-08-14 | 13F | Destination Wealth Management | 101 543 | -8,31 | 3 061 | 0,23 | ||||
| 2025-08-13 | 13F | Flow Traders U.s. Llc | 0 | -100,00 | 0 | |||||
| 2025-08-25 | NP | SWYNX - Schwab Target 2060 Index Fund This fund is a listed as child fund of Charles Schwab Investment Management Inc and if that institution has disclosed ownership in this security, then these positions will not be double counted when calculating total shares and total value | 2 101 562 | 1,44 | 63 341 | 10,89 | ||||
| 2025-08-05 | 13F | Bank of New York Mellon Corp | 100 982 | 2,48 | 3 044 | 12,04 | ||||
| 2025-07-24 | 13F | Jfs Wealth Advisors, Llc | 166 552 | -2,95 | 5 020 | 6,09 | ||||
| 2025-07-25 | 13F | Midwest Capital Advisors, LLC | 0 | -100,00 | 0 | |||||
| 2025-07-24 | 13F | IFP Advisors, Inc | 25 568 | 12,51 | 771 | 23,00 | ||||
| 2025-07-14 | 13F | Acropolis Investment Management, LLC | 16 512 | -1,56 | 498 | 7,58 | ||||
| 2025-07-10 | 13F | Mogy Joel R Investment Counsel Inc | 488 | 15 | ||||||
| 2025-08-05 | 13F | Gilbert & Cook, Inc. | 11 030 | -3,05 | 332 | 6,07 | ||||
| 2025-07-18 | 13F | Bourgeon Capital Management Llc | 23 896 | -0,15 | 720 | 9,26 | ||||
| 2025-08-11 | 13F | Strategic Wealth Partners, Ltd. | 233 | 7 | ||||||
| 2025-08-08 | 13F | Compass Wealth Management LLC | 0 | -100,00 | 0 | |||||
| 2025-07-09 | 13F | Act Wealth Management, Llc | 17 292 | -3,63 | 521 | 5,47 | ||||
| 2025-08-12 | 13F | Sherwood Financial Partners, LLC | 226 464 | -3,52 | 6 826 | 5,47 | ||||
| 2025-07-22 | 13F | Carolina Wealth Advisors, LLC | 36 469 | -3,12 | 1 099 | 5,98 | ||||
| 2025-08-06 | 13F | SOUTH STATE Corp | 5 447 | -19,29 | 164 | -11,83 | ||||
| 2025-07-23 | 13F | L.K. Benson & Company, P.C. | 34 440 | 0,08 | 1 038 | 9,49 | ||||
| 2025-08-14 | 13F | Sunbelt Securities, Inc. | 108 597 | 0,12 | 2 892 | -3,31 | ||||
| 2025-08-27 | NP | FAIEX - PFM Multi-Manager International Equity Fund Institutional Class | 3 410 752 | -5,72 | 102 800 | 3,07 | ||||
| 2025-08-14 | 13F | Goldman Sachs Group Inc | 297 760 | 1 462,96 | 8 974 | 1 609,33 | ||||
| 2025-07-18 | 13F | BSW Wealth Partners | 11 397 | -11,09 | 344 | -2,83 | ||||
| 2025-08-08 | 13F | Your Advocates Ltd., LLP | 1 189 | 0,00 | 36 | 9,38 | ||||
| 2025-07-15 | 13F | Capital Investment Advisors, LLC | 0 | -100,00 | 0 | |||||
| 2025-07-30 | 13F | Sterling Investment Management, Inc. | 9 395 | -1,74 | 283 | 7,60 | ||||
| 2025-07-15 | 13F | Ballentine Partners, LLC | 709 215 | 0,06 | 21 376 | 9,39 | ||||
| 2025-07-24 | 13F | Stonebridge Financial Group, LLC | 0 | -100,00 | 0 | |||||
| 2025-08-08 | 13F | Keyvantage Wealth, Llc | 32 520 | -7,23 | 980 | 1,45 | ||||
| 2025-07-07 | 13F | Modus Advisors, LLC | 15 971 | -2,23 | 481 | 6,89 | ||||
| 2025-07-15 | 13F | Accurate Wealth Management, LLC | 83 842 | 13,00 | 2 536 | 29,72 | ||||
| 2025-08-07 | 13F | Sierra Ocean, Llc | 280 849 | 2,94 | 8 465 | 12,54 | ||||
| 2025-07-17 | 13F | Elwood & Goetz Wealth Advisory Group, LLC | 20 315 | 19,09 | 612 | 30,21 | ||||
| 2025-08-01 | 13F | Zhang Financial LLC | 8 482 | -9,56 | 256 | -1,16 | ||||
| 2025-08-13 | 13F | Brown Advisory Inc | 23 038 | 1,58 | 694 | 11,04 | ||||
| 2025-07-15 | 13F | Sheets Smith Wealth Management | 14 726 | -2,66 | 444 | 6,24 | ||||
| 2025-08-14 | 13F | EP Wealth Advisors, Inc. | 95 094 | 1,29 | 2 866 | 10,74 | ||||
| 2025-08-12 | 13F | Argent Trust Co | 9 864 | 0,00 | 297 | 9,59 | ||||
| 2025-08-14 | 13F | Stifel Financial Corp | 202 696 | -2,20 | 6 109 | 6,91 | ||||
| 2025-08-07 | 13F | Everhart Financial Group, Inc. | 25 635 | -3,29 | 773 | 5,75 | ||||
| 2025-08-13 | 13F | Summit Financial, LLC | 15 827 | 477 | ||||||
| 2025-08-12 | 13F | Wayfinding Financial, LLC | 0 | -100,00 | 0 | |||||
| 2025-07-24 | 13F | Ronald Blue Trust, Inc. | 777 | 0,00 | 23 | 9,52 | ||||
| 2025-08-14 | 13F | Royal Bank Of Canada | 141 297 | -1,34 | 4 259 | 7,93 | ||||
| 2025-07-16 | 13F | Highline Wealth Partners Llc | 87 | 3 | ||||||
| 2025-08-25 | NP | SWYMX - Schwab Target 2050 Index Fund This fund is a listed as child fund of Charles Schwab Investment Management Inc and if that institution has disclosed ownership in this security, then these positions will not be double counted when calculating total shares and total value | 2 324 427 | -0,33 | 70 058 | 8,96 | ||||
| 2025-08-13 | 13F | My Purposeful Wealth Corp. | 8 100 | 250 | ||||||
| 2025-07-14 | 13F | Park Avenue Securities Llc | 12 526 | -17,89 | 0 | |||||
| 2025-07-18 | 13F | SimpliFi, Inc. | 14 433 | 5,85 | 435 | 16,00 | ||||
| 2025-08-14 | 13F | First Manhattan Co | 23 044 | 1,42 | 695 | 10,86 | ||||
| 2025-07-23 | 13F | Element Wealth, LLC | 31 496 | -2,43 | 949 | 6,75 | ||||
| 2025-07-22 | 13F | Warwick Investment Management, Inc. | 11 848 | -1,02 | 357 | 8,18 | ||||
| 2025-08-06 | 13F | Savant Capital, LLC | 152 783 | -2,46 | 4 605 | 6,62 | ||||
| 2025-08-05 | 13F | Sebold Capital Management, Inc. | 37 169 | -2,14 | 1 120 | 6,97 | ||||
| 2025-07-23 | 13F | Values Added Financial LLC | 39 980 | 51,35 | 1 205 | 65,38 | ||||
| 2025-07-18 | 13F/A | MJT & Associates Financial Advisory Group, Inc. | 10 073 | 0,00 | 304 | 9,39 | ||||
| 2025-08-15 | 13F | Captrust Financial Advisors | 262 346 | -6,58 | 7 907 | 2,13 | ||||
| 2025-08-14 | 13F | Quantinno Capital Management LP | 34 567 | 120,52 | 1 042 | 140,97 | ||||
| 2025-08-14 | 13F | Vivaldi Capital Management, LLC | 120 135 | 0,16 | 3 621 | 9,50 | ||||
| 2025-07-16 | 13F | Embree Financial Group | 77 474 | -13,86 | 2 335 | -5,81 | ||||
| 2025-07-30 | 13F | Bogart Wealth, LLC | 132 759 | -0,01 | 4 001 | 9,32 | ||||
| 2025-08-05 | 13F | Blue Barn Wealth, LLC | 15 603 | -10,25 | 470 | -1,88 | ||||
| 2025-07-11 | 13F | SILVER OAK SECURITIES, Inc | 44 607 | -3,02 | 1 344 | 5,91 | ||||
| 2025-07-22 | 13F | Joule Financial, LLC | 166 782 | 1,25 | 5 027 | 10,68 | ||||
| 2025-08-13 | 13F | Jackson Creek Investment Advisors LLC | 57 177 | -3,88 | 2 | 0,00 | ||||
| 2025-08-12 | 13F/A | Brightwater Advisory LLC | 161 053 | -0,50 | 4 854 | 8,79 | ||||
| 2025-08-08 | 13F | Glaxis Capital Management, LLC | 8 351 | 0,11 | 252 | 9,61 | ||||
| 2025-08-13 | 13F | American Investment Services, Inc. | 29 483 | -0,03 | 889 | 9,23 | ||||
| 2025-07-15 | 13F | BCS Wealth Management | 41 191 | 10,32 | 1 | 0,00 | ||||
| 2025-08-05 | 13F | Sigma Planning Corp | 25 951 | 0,48 | 782 | 9,83 | ||||
| 2025-07-22 | 13F | Simplicity Wealth,LLC | 0 | -100,00 | 0 | |||||
| 2025-08-06 | 13F | Adviser Investments LLC | 163 299 | 0,32 | 4 922 | 9,67 | ||||
| 2025-08-07 | 13F | Gs Investments, Inc. | 1 490 | 0,00 | 45 | 7,32 | ||||
| 2025-08-14 | 13F | Glenmede Investment Management, LP | 21 909 | 660 | ||||||
| 2025-08-12 | 13F | Vawter Financial, Ltd. | 0 | -100,00 | 0 | |||||
| 2025-08-12 | 13F | Passive Capital Management, LLC. | 54 586 | -0,99 | 1 651 | 8,69 | ||||
| 2025-07-18 | 13F | Liberty Capital Management, Inc. | 7 037 | 212 | ||||||
| 2025-07-25 | 13F | Atria Wealth Solutions, Inc. | 0 | -100,00 | 0 | |||||
| 2025-08-15 | 13F | Orcam Financial Group | 85 838 | 0,05 | 2 587 | 9,39 | ||||
| 2025-08-06 | 13F | Soltis Investment Advisors LLC | 41 232 | -7,16 | 1 243 | 1,47 | ||||
| 2025-07-15 | 13F | Cordant, Inc. | 8 508 | 2,49 | 256 | 12,28 | ||||
| 2025-08-08 | 13F | Tortoise Investment Management, LLC | 77 981 | 0,87 | 2 350 | 10,28 | ||||
| 2025-08-05 | 13F | Westside Investment Management, Inc. | 323 | 0,00 | 10 | 12,50 | ||||
| 2025-07-17 | 13F | Beacon Capital Management, LLC | 571 | -20,36 | 17 | -10,53 | ||||
| 2025-05-09 | 13F | Washington Growth Strategies Llc | 0 | -100,00 | 0 | |||||
| 2025-07-09 | 13F | Westmount Partners, LLC | 27 508 | 0,00 | 829 | 9,37 | ||||
| 2025-07-21 | 13F | Empirical Financial Services, LLC d.b.a. Empirical Wealth Management | 662 657 | 1,39 | 19 972 | 10,84 | ||||
| 2025-07-10 | 13F | Oldfather Financial Services, LLC | 13 954 | -0,84 | 421 | 8,53 | ||||
| 2025-07-07 | 13F | Upper Left Wealth Management, LLC | 156 440 | 3,19 | 4 715 | 12,83 | ||||
| 2025-07-30 | 13F | Gables Capital Management Inc. | 500 | 0,00 | 15 | 15,38 | ||||
| 2025-08-11 | 13F | Empowered Funds, LLC | 84 966 | 2 561 | ||||||
| 2025-08-13 | 13F | Lido Advisors, LLC | 0 | -100,00 | 0 | |||||
| 2025-08-18 | 13F | Geneos Wealth Management Inc. | 245 601 | -0,78 | 7 402 | 8,26 | ||||
| 2025-08-05 | 13F | Cassaday & Co Wealth Management LLC | 12 164 | -22,24 | 367 | -15,08 | ||||
| 2025-07-16 | 13F | Arkansas Financial Group, Inc. | 215 636 | -1,09 | 6 523 | 16,97 | ||||
| 2025-07-30 | 13F | Retirement Planning Group | 14 231 | 4,51 | 429 | 14,13 | ||||
| 2025-05-22 | 13F | Mattson Financial Services, LLC | 0 | -100,00 | 0 | |||||
| 2025-07-31 | 13F | Buckingham Strategic Partners | 30 144 | 7,31 | 909 | 17,31 | ||||
| 2025-08-08 | 13F | Kingsview Wealth Management, LLC | 10 424 | -3,51 | 314 | 5,72 | ||||
| 2025-08-01 | 13F | Rossby Financial, LCC | 3 349 | -0,89 | 101 | 8,70 | ||||
| 2025-08-14 | 13F | Glen Eagle Advisors, LLC | 73 | 0,00 | 2 | 0,00 | ||||
| 2025-07-09 | 13F | Dynamic Advisor Solutions LLC | 9 818 | -9,83 | 296 | -1,67 | ||||
| 2025-08-01 | 13F | Koss-Olinger Consulting, LLC | 0 | -100,00 | 0 | |||||
| 2025-08-12 | 13F | Pathstone Holdings, LLC | 732 846 | -0,82 | 13 388 | -34,28 | ||||
| 2025-07-16 | 13F | Tenret Co LLC | 54 462 | 188,34 | 1 641 | 215,58 | ||||
| 2025-07-17 | 13F | Cornerstone Wealth Advisors, Inc. | 199 511 | -2,42 | 6 013 | 6,67 | ||||
| 2025-08-07 | 13F | Sollinda Capital Management LLC | 66 838 | 33,46 | 2 014 | 45,94 | ||||
| 2025-08-12 | 13F | Clearwater Capital Advisors, LLC | 28 747 | -95,97 | 866 | -95,59 | ||||
| 2025-05-09 | 13F | Wade Financial Advisory, Inc | 15 234 | -6,30 | 420 | -2,78 | ||||
| 2025-08-14 | 13F | Hamilton Capital, LLC | 72 015 | 5,69 | 2 171 | 15,55 | ||||
| 2025-07-25 | 13F | Almanack Investment Partners, LLC. | 41 694 | 1 257 | ||||||
| 2025-07-23 | 13F | Madden Advisory Services, Inc. | 40 069 | -2,18 | 1 208 | 6,91 | ||||
| 2025-08-14 | 13F | Group One Trading, L.p. | 100 | 3 | ||||||
| 2025-07-29 | 13F | Creekside Partners | 115 876 | 12,81 | 3 492 | 23,35 | ||||
| 2025-04-22 | 13F | Synergy Financial Management, LLC | 0 | -100,00 | 0 | |||||
| 2025-07-29 | 13F | Signature Estate & Investment Advisors Llc | 32 739 | 1,80 | 987 | 11,29 | ||||
| 2025-07-29 | 13F | Stratos Wealth Partners, LTD. | 8 136 | -0,10 | 245 | 9,38 | ||||
| 2025-07-25 | 13F | Keener Financial Planning LLC | 1 330 | 5 945,45 | 0 | |||||
| 2025-08-07 | 13F | Fonville Wealth Management LLC | 24 367 | 0,02 | 734 | 9,55 | ||||
| 2025-08-25 | NP | SWYOX - Schwab Target 2065 Index Fund | 623 430 | 5,88 | 18 790 | 15,74 | ||||
| 2025-08-04 | 13F | Atria Investments Llc | 247 722 | 11,27 | 7 466 | 21,66 | ||||
| 2025-08-05 | 13F | WorthPointe, LLC | 11 528 | 347 | ||||||
| 2025-07-14 | 13F | Wooster Corthell Wealth Management, Inc. | 453 615 | -1,14 | 13 672 | 8,07 | ||||
| 2025-08-11 | 13F | Rockbridge Investment Management, LCC | 178 588 | -1,81 | 5 383 | 7,34 | ||||
| 2025-08-11 | 13F | FSA Wealth Management LLC | 1 | 0,00 | 0 | |||||
| 2025-07-22 | 13F/A | Elser Financial Planning, Inc | 28 190 | -2,52 | 850 | 6,52 | ||||
| 2025-08-11 | 13F | One Capital Management, LLC | 18 174 | -0,16 | 548 | 9,18 | ||||
| 2025-08-14 | 13F/A | Skopos Labs, Inc. | 1 039 | 31 | ||||||
| 2025-07-23 | 13F | Ami Investment Management Inc | 62 308 | 2,55 | 1 878 | 12,06 | ||||
| 2025-07-15 | 13F | Financial Management Professionals, Inc. | 4 535 | 573,85 | 137 | 655,56 | ||||
| 2025-07-25 | 13F | Courage Miller Partners, LLC | 227 292 | 2,25 | 6 851 | 11,78 | ||||
| 2025-07-15 | 13F | Mather Group, Llc. | 2 114 862 | 0,05 | 63 742 | 9,38 | ||||
| 2025-08-04 | 13F | Continental Investors Services, Inc. | 14 709 | 9,43 | 472 | 27,22 | ||||
| 2025-08-12 | 13F | Fortem Financial Group, Llc | 0 | -100,00 | 0 | |||||
| 2025-08-12 | 13F | Proequities, Inc. | 0 | 0 | ||||||
| 2025-07-31 | 13F | Wealthfront Advisers Llc | 15 056 | -10,77 | 454 | -2,58 | ||||
| 2025-07-31 | 13F | Guardian Wealth Advisors, LLC | 8 634 | 0,06 | 260 | 9,70 | ||||
| 2025-08-13 | 13F | Prossimo Advisors, LLC | 0 | -100,00 | 0 | |||||
| 2025-06-03 | 13F | Invst, LLC | 251 250 | -46,34 | 6 927 | -44,45 | ||||
| 2025-08-12 | 13F | Integrated Advisors Network LLC | 12 424 | -2,05 | 374 | 7,16 | ||||
| 2025-08-18 | 13F | Front Row Advisors LLC | 10 331 | 5,52 | 311 | 15,61 | ||||
| 2025-08-13 | 13F | Nicolet Bankshares Inc | 14 342 | 39,35 | 432 | 52,65 | ||||
| 2025-08-04 | 13F | Putney Financial Group LLC | 0 | -100,00 | 0 | |||||
| 2025-08-14 | 13F | Mercer Global Advisors Inc /adv | 1 628 282 | -6,44 | 49 076 | 2,28 | ||||
| 2025-07-24 | 13F | Game Plan Financial Advisors, LLC | 2 055 | 24,17 | 62 | 35,56 | ||||
| 2025-07-08 | 13F | Arlington Trust Co LLC | 12 061 | 0,00 | 364 | 9,34 | ||||
| 2025-08-06 | 13F | Ethos Financial Group, LLC | 124 163 | 9,13 | 3 742 | 23,54 | ||||
| 2025-08-06 | 13F | SNS Financial Group, LLC | 98 540 | -4,01 | 2 970 | 4,91 | ||||
| 2025-08-08 | 13F | Larson Financial Group LLC | 16 999 | 169,10 | 512 | 194,25 | ||||
| 2025-07-08 | 13F | Adamsbrown Wealth Consultants Llc | 409 084 | -4,64 | 12 330 | 4,24 | ||||
| 2025-08-14 | 13F | L2 Asset Management, LLC | 75 184 | 80,32 | 2 266 | 97,21 | ||||
| 2025-07-31 | 13F | Gill Capital Partners, Llc | 9 473 | 0,00 | 286 | 9,20 | ||||
| 2025-08-11 | 13F | Heritage Wealth Advisors | 0 | -100,00 | 0 | |||||
| 2025-07-17 | 13F | Summit Financial Strategies, Inc. | 13 860 | -2,21 | 418 | 6,92 | ||||
| 2025-05-06 | 13F | Kathleen S. Wright Associates Inc. | 0 | -100,00 | 0 | |||||
| 2025-07-21 | 13F | Ameritas Advisory Services, LLC | 7 010 | -49,16 | 211 | -43,13 | ||||
| 2025-07-31 | 13F | Oak Harbor Wealth Partners, Llc | 2 | 0 | ||||||
| 2025-07-24 | 13F | M1 Capital Management LLC | 14 806 | 62,26 | 446 | 77,69 | ||||
| 2025-08-06 | 13F | Modera Wealth Management, LLC | 44 301 | -1,60 | 1 335 | 7,57 | ||||
| 2025-08-07 | 13F/A | Joseph Group Capital Management | 1 249 | 0,00 | 38 | 8,82 | ||||
| 2025-07-29 | 13F | Koshinski Asset Management, Inc. | 28 639 | -6,82 | 863 | 1,89 | ||||
| 2025-08-07 | 13F | Rollins Financial Advisors, LLC | 7 306 | 220 | ||||||
| 2025-08-12 | 13F | Bokf, Na | 0 | -100,00 | 0 | |||||
| 2025-07-30 | 13F | Bleakley Financial Group, LLC | 91 342 | 2 753 | ||||||
| 2025-07-18 | 13F | Naples Global Advisors, Llc | 437 596 | 4,62 | 13 189 | 14,38 | ||||
| 2025-07-08 | 13F | Boltwood Capital Management | 240 631 | 0,28 | 7 253 | 9,63 | ||||
| 2025-08-07 | 13F | HC Advisors, LLC | 336 801 | -1,47 | 10 151 | 7,73 | ||||
| 2025-05-14 | 13F | Truvestments Capital Llc | 0 | -100,00 | 0 | |||||
| 2025-07-17 | 13F | SWS Partners | 13 364 | 0,01 | 403 | 9,24 | ||||
| 2025-07-30 | 13F | Fairway Wealth LLC | 483 | -2,03 | 15 | 7,69 | ||||
| 2025-07-18 | 13F | TruNorth Capital Management, LLC | 415 568 | 20,34 | 12 525 | 31,57 | ||||
| 2025-07-22 | 13F | Valley National Advisers Inc | 144 107 | 4,99 | 4 | 33,33 | ||||
| 2025-08-29 | 13F | Total Investment Management Inc | 139 | 4 | ||||||
| 2025-08-08 | 13F | Empower Advisory Group, LLC | 45 536 | 2,69 | 1 372 | 12,27 | ||||
| 2025-07-10 | 13F | Stonekeep Investments, LLC | 111 409 | 4,95 | 3 358 | 14,73 | ||||
| 2025-07-15 | 13F | GSB Wealth Management, LLC | 12 655 | -2,32 | 381 | 6,72 | ||||
| 2025-08-05 | 13F | Bank Of Montreal /can/ | 44 285 | 5,33 | 1 335 | 15,10 | ||||
| 2025-08-15 | 13F | Tower Research Capital LLC (TRC) | 324 | -89,69 | 10 | -89,53 | ||||
| 2025-07-24 | 13F | Lee Financial Co | 97 708 | 1,80 | 2 945 | 11,26 | ||||
| 2025-05-15 | 13F | Beaird Harris Wealth Management, LLC | 0 | -100,00 | 0 | |||||
| 2025-07-31 | 13F | Leavell Investment Management, Inc. | 95 212 | -1,67 | 2 870 | 7,49 | ||||
| 2025-08-07 | 13F | Cahill Financial Advisors Inc | 33 357 | -0,24 | 1 005 | 9,12 | ||||
| 2025-07-30 | 13F | Atlantic Edge Private Wealth Management, LLC | 592 | 0,00 | 18 | 6,25 | ||||
| 2025-08-07 | 13F | Alliance Wealth Management Group | 521 628 | -2,15 | 15 722 | 6,97 | ||||
| 2025-07-22 | 13F | Capital Advisors Inc/ok | 20 068 | 605 | ||||||
| 2025-08-11 | 13F | Mill Creek Capital Advisors, LLC | 56 455 | 52,09 | 1 702 | 66,28 | ||||
| 2025-04-10 | 13F | Richard P Slaughter Associates Inc | 0 | -100,00 | 0 | |||||
| 2025-08-06 | 13F | Rialto Wealth Management, LLC | 49 223 | 0,01 | 1 484 | 9,37 | ||||
| 2025-08-19 | 13F | Advisory Services Network, LLC | 30 315 | 42,59 | 923 | 57,34 | ||||
| 2025-07-16 | 13F | Kiley Juergens Wealth Management, Llc | 37 782 | -0,96 | 1 139 | 8,28 | ||||
| 2025-07-25 | 13F | Northwest Capital Management Inc | 63 099 | -34,62 | 1 902 | -28,53 | ||||
| 2025-07-22 | 13F | White & Co Financial Planning Inc | 132 764 | 0,90 | 3 998 | 10,05 | ||||
| 2025-08-07 | 13F | Apeiron RIA LLC | 12 982 | 0,88 | 391 | 10,45 | ||||
| 2025-07-31 | 13F | Brighton Jones Llc | 45 505 | 0,35 | 1 372 | 9,68 | ||||
| 2025-08-25 | NP | SWC1Z - Schwab VIT Balanced with Growth Portfolio This fund is a listed as child fund of Charles Schwab Investment Management Inc and if that institution has disclosed ownership in this security, then these positions will not be double counted when calculating total shares and total value | 185 696 | -6,20 | 5 597 | 2,55 | ||||
| 2025-08-06 | 13F | Financial Advisory Corp /ut/ /adv | 35 804 | -10,13 | 1 | 0,00 | ||||
| 2025-08-05 | 13F | Cherry Tree Wealth Management, LLC | 16 146 | -0,24 | 487 | 8,97 | ||||
| 2025-08-01 | 13F | Cobblestone Capital Advisors Llc /ny/ | 98 352 | 2,08 | 2 964 | 11,60 | ||||
| 2025-08-14 | 13F | Private Capital Management, LLC | 8 332 | 0,07 | 251 | 9,61 | ||||
| 2025-08-06 | 13F | Atlantic Union Bankshares Corp | 126 | 4 | ||||||
| 2025-08-13 | 13F | Russell Investments Group, Ltd. | 1 778 | 183,12 | 54 | 211,76 | ||||
| 2025-09-04 | 13F | ZynergyRetirementPlanningLLC | 115 021 | 2,01 | 3 467 | 15,46 | ||||
| 2025-08-08 | 13F | Pnc Financial Services Group, Inc. | 18 399 | -2,39 | 555 | 6,74 | ||||
| 2025-08-14 | 13F | Waterford Advisors, LLC | 3 | -99,99 | 1 230 | -10,68 | ||||
| 2025-08-19 | 13F | Asset Dedication, LLC | 22 180 | -0,44 | 669 | 8,79 | ||||
| 2025-08-14 | 13F | Creegan & Nassoura Financial Group, LLC | 11 640 | -0,64 | 351 | 8,70 | ||||
| 2025-08-14 | 13F | Financial Engines Advisors L.L.C. | 17 603 682 | -3,04 | 530 575 | 6,00 | ||||
| 2025-08-07 | 13F | Winthrop Capital Management, LLC | 56 960 | 0,01 | 2 | 0,00 | ||||
| 2025-07-10 | 13F | Orgel Wealth Management, LLC | 1 950 673 | 4,33 | 58 793 | 14,05 | ||||
| 2025-07-25 | 13F | Hazlett, Burt & Watson, Inc. | 317 | -45,16 | 0 | |||||
| 2025-07-11 | 13F | Coastwise Capital Group, LLC | 16 227 | -1,28 | 489 | 7,95 | ||||
| 2025-08-13 | 13F | Strategic Financial Planning, Inc. | 105 162 | -0,37 | 3 170 | 8,90 | ||||
| 2025-07-16 | 13F | Jentner Corp | 20 182 | -3,41 | 608 | 5,56 | ||||
| 2025-08-06 | 13F | Wedbush Securities Inc | 6 641 | 0 | ||||||
| 2025-08-12 | 13F | Kohmann Bosshard Financial Services, LLC | 185 129 | 2,62 | 5 580 | 12,12 | ||||
| 2025-08-06 | 13F | Reston Wealth Management Llc | 19 816 | -1,58 | 597 | 7,57 | ||||
| 2025-07-02 | 13F | Howard Financial Services, Ltd. | 82 254 | -1,58 | 2 479 | 7,60 | ||||
| 2025-07-24 | 13F | Morton Brown Family Wealth, LLC | 401 | 0,00 | 12 | 9,09 | ||||
| 2025-05-09 | 13F | NBZ Investment Advisors LLC | 0 | -100,00 | 0 | |||||
| 2025-03-12 | 13F/A | Private Capital Management Llc | 15 686 | 4,35 | 417 | 9,76 | ||||
| 2025-07-22 | 13F | Windward Private Wealth Management Inc. | 47 030 | -0,88 | 1 417 | 8,33 | ||||
| 2025-07-25 | 13F | Concurrent Investment Advisors, LLC | 31 268 | 54,25 | 942 | 68,82 | ||||
| 2025-08-12 | 13F | Indie Asset Partners, LLC | 47 942 | 348,39 | 1 445 | 391,16 | ||||
| 2025-08-14 | 13F | LifePlan Investment Advisors, Inc. | 179 966 | -1,37 | 5 424 | 7,83 | ||||
| 2025-07-15 | 13F | Droms Strauss Advisors Inc /mo/ /adv | 58 966 | 5,51 | 1 777 | 15,39 | ||||
| 2025-07-31 | 13F | Jackson Hole Capital Partners, LLC | 4 000 | 0,00 | 121 | 9,09 | ||||
| 2025-07-14 | 13F | Ridgewood Investments LLC | 122 | 0,00 | 4 | 0,00 | ||||
| 2025-08-14 | 13F | Wells Fargo & Company/mn | 1 325 780 | -1,04 | 39 959 | 8,19 | ||||
| 2025-08-14 | 13F | TT Capital Management LLC | 76 124 | 2 169 | ||||||
| 2025-07-28 | 13F | Sterling Financial Planning, Inc. | 16 208 | -10,07 | 488 | -1,61 | ||||
| 2025-08-05 | 13F | C2P Capital Advisory Group, LLC d.b.a. Prosperity Capital Advisors | 0 | -100,00 | 0 | |||||
| 2025-07-29 | 13F | APCM Wealth Management for Individuals | 25 512 | 2,49 | 769 | 11,95 | ||||
| 2025-07-28 | 13F | Harbour Investments, Inc. | 8 712 | -3,73 | 263 | 5,22 | ||||
| 2025-08-25 | NP | SWG1Z - Schwab VIT Growth Portfolio This fund is a listed as child fund of Charles Schwab Investment Management Inc and if that institution has disclosed ownership in this security, then these positions will not be double counted when calculating total shares and total value | 310 116 | -5,52 | 9 347 | 3,28 | ||||
| 2025-08-15 | 13F | WealthCollab, LLC | 2 807 | -0,78 | 85 | 9,09 | ||||
| 2025-07-30 | 13F | Brookstone Capital Management | 21 158 | 2,77 | 638 | 12,35 | ||||
| 2025-07-29 | 13F | Empirical Asset Management, LLC | 10 551 | -1,70 | 318 | 7,46 | ||||
| 2025-07-09 | 13F | OLIO Financial Planning | 46 429 | -14,76 | 1 399 | -6,80 | ||||
| 2025-08-14 | 13F | Operose Advisors LLC | 772 | 0,13 | 23 | 9,52 | ||||
| 2025-07-15 | 13F | MCF Advisors LLC | 23 052 | 0,11 | 695 | 9,46 | ||||
| 2025-07-24 | 13F | Etesian Wealth Advisors, Inc. | 75 247 | -10,51 | 2 268 | -2,20 | ||||
| 2025-08-19 | 13F | Cape Investment Advisory, Inc. | 118 319 | 0,29 | 3 566 | 9,66 | ||||
| 2025-07-09 | 13F | Riversedge Advisors, Llc | 9 775 | -13,09 | 295 | -5,16 | ||||
| 2025-05-07 | 13F | Objective Capital Management, LLC | 0 | -100,00 | 0 | |||||
| 2025-08-14 | 13F | Ieq Capital, Llc | 9 147 | -52,06 | 276 | -47,72 | ||||
| 2025-08-12 | 13F | North Star Asset Management Inc | 321 806 | -2,02 | 9 699 | 7,11 | ||||
| 2025-08-27 | 13F | Seneca Financial Advisors LLC | 299 987 | -0,60 | 9 042 | 8,67 | ||||
| 2025-07-22 | 13F | Global Strategic Investment Solutions, LLC | 9 644 | -55,04 | 291 | -50,93 | ||||
| 2025-07-22 | 13F | Red Tortoise LLC | 302 081 | -6,82 | 9 105 | 1,87 | ||||
| 2025-08-05 | 13F | Oakwell Private Wealth Management, LLC | 70 151 | 0,00 | 2 114 | 9,31 | ||||
| 2025-08-14 | 13F | Main Street Financial Solutions, LLC | 285 937 | 2,47 | 8 618 | 12,02 | ||||
| 2025-07-22 | 13F | Miracle Mile Advisors, LLC | 120 481 | 0,37 | 3 631 | 9,73 | ||||
| 2025-07-22 | 13F | Red Door Wealth Management, LLC | 10 617 | 0,01 | 320 | 9,25 | ||||
| 2025-08-05 | 13F | Tiaa Trust, National Association | 7 227 | 218 | ||||||
| 2025-08-14 | 13F | Advisor OS, LLC | 10 011 | 302 | ||||||
| 2025-08-14 | 13F | Prudent Investors Network | 6 754 | 204 | ||||||
| 2025-07-24 | 13F | Blair William & Co/il | 28 719 | 25,75 | 866 | 37,52 | ||||
| 2025-07-16 | 13F | Strategic Investment Solutions, Inc. /IL | 802 | 0,00 | 24 | 9,09 | ||||
| 2025-07-21 | 13F | Warner Financial, Inc | 9 119 | 2,87 | 0 | |||||
| 2025-07-29 | 13F | International Assets Investment Management, Llc | 8 835 | 266 | ||||||
| 2025-07-22 | 13F | Merit Financial Group, LLC | 23 149 | -0,26 | 698 | 9,08 | ||||
| 2025-08-14 | 13F | Financial Advisory Service, Inc. | 87 508 | 0,16 | 2 638 | 9,51 | ||||
| 2025-05-14 | 13F | Oarsman Capital, Inc. | 0 | -100,00 | 0 | |||||
| 2025-08-13 | 13F | Financial Freedom, LLC | 271 | 0,00 | 8 | 14,29 | ||||
| 2025-08-15 | 13F | Chapman Financial Group, Llc | 4 702 | -4,08 | 142 | 8,46 |