Statistiques de base
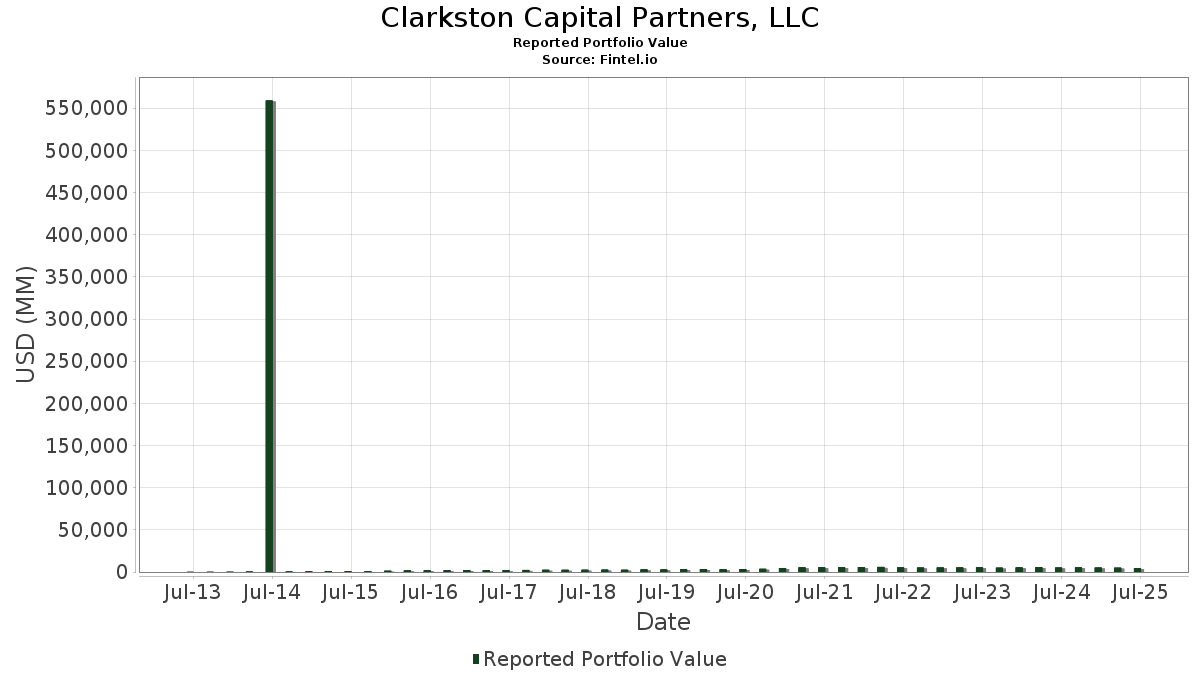
| Valeur du portefeuille | $ 4 709 793 187 |
| Positions actuelles | 151 |
Dernières positions, performances, ASG (à partir des dépôts 13F, 13D)
Clarkston Capital Partners, LLC a déclaré un total de 151 positions dans ses derniers dépôts auprès de la SEC. La valeur la plus récente du portefeuille est calculée à 4 709 793 187 USD. Les actifs sous gestion réels (ASG) sont cette valeur plus les liquidités (qui ne sont pas divulguées). Les principales positions de Clarkston Capital Partners, LLC sont Post Holdings, Inc. (US:POST) , Clarivate Plc (US:CLVT) , Affiliated Managers Group, Inc. (US:AMG) , LPL Financial Holdings Inc. (US:LPLA) , and US Foods Holding Corp. (US:USFD) . Les nouvelles positions de Clarkston Capital Partners, LLC incluent Medpace Holdings, Inc. (US:MEDP) , IDEX Corporation (US:IEX) , Ralliant Corporation (US:RAL) , Gartner, Inc. (US:IT) , and W.W. Grainger, Inc. (US:GWW) . Les principales industries de Clarkston Capital Partners, LLC sont "Oil And Gas Extraction" (sic 13) , "Paper And Allied Products" (sic 26) , and "Pipelines, Except Natural Gas" (sic 46) .
Meilleures augmentations ce trimestre
Nous utilisons la variation de l'allocation du portefeuille car il s'agit de l'indicateur le plus significatif. Les changements peuvent être dus à des transactions ou à des variations de prix des actions.
| Titre | Actions (en millions) |
Valeur ($ en millions) |
% du portefeuille | ΔPortefeuille % |
|---|---|---|---|---|
| 13,98 | 188,20 | 3,9959 | 0,9284 | |
| 0,13 | 40,57 | 0,8614 | 0,8614 | |
| 0,26 | 41,28 | 0,8756 | 0,7921 | |
| 8,41 | 79,18 | 1,6794 | 0,7765 | |
| 1,44 | 282,43 | 5,9902 | 0,7349 | |
| 0,30 | 51,11 | 1,0841 | 0,6879 | |
| 70,03 | 301,13 | 6,3937 | 0,6153 | |
| 0,20 | 27,22 | 0,5772 | 0,5772 | |
| 0,60 | 224,53 | 4,7672 | 0,4157 | |
| 0,10 | 17,56 | 0,3729 | 0,3729 |
Principales baisses ce trimestre
Nous utilisons la variation de l'allocation du portefeuille car il s'agit de l'indicateur le plus significatif. Les changements peuvent être dus à des transactions ou à des variations de prix des actions.
| Titre | Actions (en millions) |
Valeur ($ en millions) |
% du portefeuille | ΔPortefeuille % |
|---|---|---|---|---|
| 3,60 | 173,21 | 3,6736 | -1,7942 | |
| 3,06 | 154,64 | 3,2797 | -1,0171 | |
| 1,89 | 84,46 | 1,7914 | -0,8930 | |
| 3,04 | 331,86 | 7,0385 | -0,6851 | |
| 0,75 | 82,71 | 1,7541 | -0,5791 | |
| 1,42 | 135,91 | 2,8826 | -0,4750 | |
| 4,79 | 96,55 | 2,0478 | -0,4348 | |
| 3,35 | 67,17 | 1,4246 | -0,3665 | |
| 0,47 | 144,60 | 3,0702 | -0,3339 | |
| 1,03 | 71,11 | 1,5082 | -0,3114 |
Déclarations 13D/G
Il s'agit d'une liste des déclarations 13D et 13G déposées au cours de la dernière année (le cas échéant). Cliquez sur l'icône du lien pour voir l'historique complet des transactions. Les lignes vertes indiquent de nouvelles positions. Les lignes rouges indiquent des positions fermées.
| Date de dépôt | Formulaire | Titre | Actions précédentes |
Actions actuelles |
ΔActions % | % de participation |
% ΔParticipation | |
|---|---|---|---|---|---|---|---|---|
| 2025-08-13 | NEOG / Neogen Corporation | 14 005 725 | 6,44 | |||||
| 2025-08-13 | WLY / John Wiley & Sons, Inc. | 3 288 240 | 1 892 495 | -42,45 | 4,24 | -41,60 | ||
| 2025-08-13 | HI / Hillenbrand, Inc. | 4 409 076 | 3 346 801 | -24,09 | 4,74 | -24,52 | ||
| 2025-08-06 | LESL / Leslie's, Inc. | 14 037 110 | 80 000 | -99,43 | 0,04 | -99,47 | ||
| 2025-07-08 | CABO / Cable One, Inc. | 357 192 | 250 | -99,93 | 0,00 | -100,00 | ||
| 2025-02-14 | AMG / Affiliated Managers Group, Inc. | 2 229 049 | 1 572 189 | -29,47 | 5,20 | -21,09 | ||
| 2024-12-05 | CLVT / Clarivate Plc | 56 341 399 | 72 209 043 | 28,16 | 10,16 | 19,67 | ||
| 2024-11-08 | SRCL / Stericycle, Inc. | 6 472 501 | 3 822 473 | -40,94 | 4,12 | -41,14 |
Déclarations 13F et dépôts de fonds
Ce formulaire a été déposé le 2025-08-13 pour la période de déclaration 2025-06-30. Cliquez sur l'icône du lien pour voir l'historique complet des transactions.
Mettre à niveau pour débloquer les données premium et exporter vers Excel ![]() .
.
| Titre | Type | Prix moyen de l'action | Actions (en millions) |
ΔActions (%) |
ΔActions (%) |
Valeur ($ en millions) |
Portefeuille (%) |
ΔPortefeuille (%) |
|
|---|---|---|---|---|---|---|---|---|---|
| POST / Post Holdings, Inc. | 3,04 | -9,53 | 331,86 | -15,23 | 7,0385 | -0,6851 | |||
| CLVT / Clarivate Plc | 70,03 | -6,03 | 301,13 | 2,81 | 6,3937 | 0,6153 | |||
| AMG / Affiliated Managers Group, Inc. | 1,44 | -9,46 | 282,43 | 6,03 | 5,9902 | 0,7349 | |||
| LPLA / LPL Financial Holdings Inc. | 0,60 | -11,19 | 224,53 | 1,79 | 4,7672 | 0,4157 | |||
| USFD / US Foods Holding Corp. | 2,71 | -20,35 | 208,56 | -6,29 | 4,4233 | 0,0325 | |||
| AVTR / Avantor, Inc. | 13,98 | 45,77 | 188,20 | 21,04 | 3,9959 | 0,9284 | |||
| LW / Lamb Weston Holdings, Inc. | 3,41 | -8,45 | 176,65 | -10,94 | 3,7466 | -0,1667 | |||
| TAP.A / Molson Coors Beverage Company | 3,60 | -20,90 | 173,21 | -37,50 | 3,6736 | -1,7942 | |||
| GFL / GFL Environmental Inc. | 3,06 | -32,02 | 154,64 | -29,00 | 3,2797 | -1,0171 | |||
| WTW / Willis Towers Watson Public Limited Company | 0,47 | -7,60 | 144,60 | -16,20 | 3,0702 | -0,3339 | |||
| SYY / Sysco Corporation | 1,89 | -11,78 | 143,06 | -10,96 | 3,0342 | -0,1356 | |||
| CHRW / C.H. Robinson Worldwide, Inc. | 1,42 | -14,77 | 135,91 | -20,14 | 2,8826 | -0,4750 | |||
| HSIC / Henry Schein, Inc. | 1,59 | -9,35 | 115,99 | -3,31 | 2,4600 | 0,0933 | |||
| MIDD / The Middleby Corporation | 0,69 | 0,61 | 99,76 | -4,67 | 2,1158 | 0,0512 | |||
| LKQ / LKQ Corporation | 2,61 | 3,90 | 96,68 | -9,61 | 2,0505 | -0,0596 | |||
| ENR / Energizer Holdings, Inc. | 4,79 | 13,87 | 96,55 | -23,27 | 2,0478 | -0,4348 | |||
| NVST / Envista Holdings Corporation | 4,70 | 0,35 | 91,90 | 13,61 | 1,9492 | 0,3533 | |||
| WLY / John Wiley & Sons, Inc. | 1,89 | -38,02 | 84,46 | -37,92 | 1,7914 | -0,8930 | |||
| BRO / Brown & Brown, Inc. | 0,75 | -21,53 | 82,71 | -30,07 | 1,7541 | -0,5791 | |||
| SCHW / The Charles Schwab Corporation | 0,90 | -1,20 | 82,51 | 15,15 | 1,7500 | 0,3364 | |||
| CCCS / CCC Intelligent Solutions Holdings Inc. | 8,41 | 66,03 | 79,18 | 73,01 | 1,6794 | 0,7765 | |||
| FDX / FedEx Corporation | 0,34 | -0,65 | 77,34 | -7,37 | 1,6403 | -0,0068 | |||
| BUD / Anheuser-Busch InBev SA/NV - Depositary Receipt (Common Stock) | 1,03 | -30,93 | 71,11 | -22,90 | 1,5082 | -0,3114 | |||
| HI / Hillenbrand, Inc. | 3,35 | -11,01 | 67,17 | -26,02 | 1,4246 | -0,3665 | |||
| NEOG / Neogen Corporation | 14,01 | 123,16 | 66,95 | 23,03 | 1,4215 | 0,3479 | |||
| WBD / Warner Bros. Discovery, Inc. | 4,72 | 0,05 | 54,06 | 6,85 | 1,1467 | 0,1485 | |||
| BDX / Becton, Dickinson and Company | 0,30 | 238,50 | 51,11 | 154,55 | 1,0841 | 0,6879 | |||
| MSFT / Microsoft Corporation | 0,10 | -2,42 | 49,92 | 29,30 | 1,0589 | 0,2971 | |||
| COF / Capital One Financial Corporation | 0,23 | -2,10 | 49,42 | 16,17 | 1,0481 | 0,2088 | |||
| AXP / American Express Company | 0,15 | -1,92 | 46,63 | 16,29 | 0,9900 | 0,1989 | |||
| IQV / IQVIA Holdings Inc. | 0,26 | 991,56 | 41,28 | 875,75 | 0,8756 | 0,7921 | |||
| MEDP / Medpace Holdings, Inc. | 0,13 | 40,57 | 0,8614 | 0,8614 | |||||
| CMCSA / Comcast Corporation | 0,98 | -2,30 | 34,82 | -5,50 | 0,7385 | 0,0116 | |||
| AAPL / Apple Inc. | 0,16 | -0,40 | 31,94 | -8,01 | 0,6775 | -0,0076 | |||
| USB / U.S. Bancorp | 0,69 | -2,29 | 31,14 | 4,73 | 0,6605 | 0,0738 | |||
| MAA / Mid-America Apartment Communities, Inc. | 0,21 | 0,00 | 31,08 | -11,68 | 0,6592 | -0,0351 | |||
| DIS / The Walt Disney Company | 0,25 | 1,89 | 30,40 | 28,02 | 0,6447 | 0,1763 | |||
| PAYX / Paychex, Inc. | 0,20 | -2,33 | 29,69 | -7,92 | 0,6298 | -0,0064 | |||
| FTV / Fortive Corporation | 0,57 | 67,73 | 29,52 | 19,48 | 0,6261 | 0,1387 | |||
| GOOGL / Alphabet Inc. | 0,17 | -2,20 | 29,24 | 11,45 | 0,6201 | 0,1026 | |||
| KVUE / Kenvue Inc. | 1,34 | -2,41 | 27,99 | -14,83 | 0,5937 | -0,0547 | |||
| LSTR / Landstar System, Inc. | 0,20 | 27,22 | 0,5772 | 0,5772 | |||||
| PEP / PepsiCo, Inc. | 0,20 | 2,99 | 26,69 | -9,30 | 0,5660 | -0,0145 | |||
| UPS / United Parcel Service, Inc. | 0,23 | -20,45 | 23,31 | -27,00 | 0,4944 | -0,1356 | |||
| MA / Mastercard Incorporated | 0,04 | -2,92 | 23,18 | -0,47 | 0,4917 | 0,0322 | |||
| ALGN / Align Technology, Inc. | 0,11 | 17,30 | 21,27 | 39,80 | 0,4512 | 0,1510 | |||
| DEO / Diageo plc - Depositary Receipt (Common Stock) | 0,19 | -0,54 | 19,63 | -4,30 | 0,4164 | 0,0117 | |||
| KDP / Keurig Dr Pepper Inc. | 0,59 | -2,09 | 19,48 | -5,41 | 0,4132 | 0,0069 | |||
| PG / The Procter & Gamble Company | 0,12 | -2,38 | 19,31 | -8,74 | 0,4095 | -0,0079 | |||
| MDT / Medtronic plc | 0,22 | -20,64 | 18,93 | -23,01 | 0,4016 | -0,0836 | |||
| JNJ / Johnson & Johnson | 0,12 | -2,03 | 18,61 | -9,76 | 0,3948 | -0,0122 | |||
| IEX / IDEX Corporation | 0,10 | 17,56 | 0,3729 | 0,3729 | |||||
| WM / Waste Management, Inc. | 0,07 | -3,87 | 16,14 | -4,99 | 0,3424 | 0,0072 | |||
| DHR / Danaher Corporation | 0,08 | 5 542,79 | 15,61 | 5 337,28 | 0,3310 | 0,3253 | |||
| ABNB / Airbnb, Inc. | 0,11 | 19,11 | 14,09 | 31,95 | 0,2989 | 0,0882 | |||
| TMO / Thermo Fisher Scientific Inc. | 0,03 | 4 859,56 | 13,57 | 3 951,64 | 0,2879 | 0,2813 | |||
| BIL / SPDR Series Trust - SPDR Bloomberg 1-3 Month T-Bill ETF | 0,15 | -41,63 | 13,56 | -41,63 | 0,2875 | -0,1707 | |||
| META / Meta Platforms, Inc. | 0,02 | -0,18 | 11,97 | 27,82 | 0,2539 | 0,0691 | |||
| IFF / International Flavors & Fragrances Inc. | 0,16 | 11,94 | 0,2532 | 0,2532 | |||||
| BX / Blackstone Inc. | 0,08 | 0,00 | 11,27 | 7,02 | 0,2390 | 0,0312 | |||
| OTIS / Otis Worldwide Corporation | 0,10 | -1,52 | 9,43 | -5,51 | 0,1999 | 0,0031 | |||
| SFBS / ServisFirst Bancshares, Inc. | 0,12 | 0,00 | 9,30 | -6,16 | 0,1973 | 0,0017 | |||
| RAL / Ralliant Corporation | 0,19 | 9,15 | 0,1943 | 0,1943 | |||||
| IT / Gartner, Inc. | 0,02 | 8,88 | 0,1886 | 0,1886 | |||||
| LLY / Eli Lilly and Company | 0,01 | 0,50 | 7,83 | -5,15 | 0,1662 | 0,0032 | |||
| GS / The Goldman Sachs Group, Inc. | 0,01 | 0,00 | 7,08 | 29,57 | 0,1501 | 0,0423 | |||
| EPD / Enterprise Products Partners L.P. - Limited Partnership | 0,20 | 0,00 | 6,25 | -9,16 | 0,1325 | -0,0032 | |||
| XOM / Exxon Mobil Corporation | 0,05 | 0,00 | 5,93 | -9,35 | 0,1257 | -0,0033 | |||
| LESL / Leslie's, Inc. | 14,04 | -39,47 | 5,89 | -65,45 | 0,1251 | -0,2114 | |||
| CSCO / Cisco Systems, Inc. | 0,08 | 0,00 | 5,39 | 12,43 | 0,1143 | 0,0197 | |||
| FIS / Fidelity National Information Services, Inc. | 0,06 | 0,00 | 5,13 | 9,01 | 0,1088 | 0,0160 | |||
| PM / Philip Morris International Inc. | 0,03 | 0,00 | 4,72 | 14,74 | 0,1000 | 0,0189 | |||
| BRK.A / Berkshire Hathaway Inc. | 0,00 | 0,00 | 4,37 | -8,73 | 0,0927 | -0,0018 | |||
| COST / Costco Wholesale Corporation | 0,00 | 7,31 | 3,75 | 12,35 | 0,0795 | 0,0137 | |||
| IVV / iShares Trust - iShares Core S&P 500 ETF | 0,01 | -0,59 | 3,74 | 9,85 | 0,0793 | 0,0121 | |||
| VOO / Vanguard Index Funds - Vanguard S&P 500 ETF | 0,01 | -0,10 | 3,47 | 10,45 | 0,0736 | 0,0117 | |||
| AMZN / Amazon.com, Inc. | 0,01 | -7,33 | 2,77 | 6,87 | 0,0587 | 0,0076 | |||
| SO / The Southern Company | 0,03 | 0,00 | 2,75 | -0,15 | 0,0584 | 0,0040 | |||
| SPY / SPDR S&P 500 ETF | 0,00 | 4,47 | 2,67 | 15,42 | 0,0567 | 0,0110 | |||
| CVX / Chevron Corporation | 0,02 | 41,85 | 2,65 | 21,44 | 0,0561 | 0,0131 | |||
| NUE / Nucor Corporation | 0,02 | 0,00 | 2,59 | 7,65 | 0,0549 | 0,0075 | |||
| BAC / Bank of America Corporation | 0,05 | -1,28 | 2,56 | 11,96 | 0,0542 | 0,0092 | |||
| HD / The Home Depot, Inc. | 0,01 | 0,00 | 2,49 | 0,04 | 0,0529 | 0,0037 | |||
| DUK / Duke Energy Corporation | 0,02 | 0,00 | 2,38 | -3,29 | 0,0506 | 0,0019 | |||
| KO / The Coca-Cola Company | 0,03 | 0,00 | 2,19 | -1,22 | 0,0464 | 0,0027 | |||
| BMY / Bristol-Myers Squibb Company | 0,05 | 0,00 | 2,13 | -24,10 | 0,0452 | -0,0102 | |||
| ET / Energy Transfer LP - Limited Partnership | 0,12 | 15,00 | 2,08 | 12,10 | 0,0442 | 0,0075 | |||
| IBM / International Business Machines Corporation | 0,01 | 0,00 | 2,08 | 18,54 | 0,0441 | 0,0095 | |||
| CACC / Credit Acceptance Corporation | 0,00 | 0,00 | 2,04 | -1,36 | 0,0432 | 0,0025 | |||
| PFE / Pfizer Inc. | 0,08 | 22,49 | 1,98 | 17,23 | 0,0420 | 0,0087 | |||
| VICI / VICI Properties Inc. | 0,06 | 0,00 | 1,96 | -0,05 | 0,0415 | 0,0029 | |||
| IWF / iShares Trust - iShares Russell 1000 Growth ETF | 0,00 | -0,30 | 1,85 | 17,27 | 0,0392 | 0,0081 | |||
| GOOG / Alphabet Inc. | 0,01 | -4,22 | 1,83 | 8,73 | 0,0388 | 0,0056 | |||
| MCD / McDonald's Corporation | 0,01 | 4,63 | 1,65 | -2,14 | 0,0350 | 0,0017 | |||
| PRU / Prudential Financial, Inc. | 0,01 | 20,00 | 1,61 | 15,40 | 0,0342 | 0,0066 | |||
| SYK / Stryker Corporation | 0,00 | 14,00 | 1,61 | 21,22 | 0,0342 | 0,0079 | |||
| MRK / Merck & Co., Inc. | 0,02 | 11,84 | 1,60 | -1,42 | 0,0340 | 0,0019 | |||
| SPDW / SPDR Index Shares Funds - SPDR Portfolio Developed World ex-US ETF | 0,04 | 0,00 | 1,60 | 11,20 | 0,0339 | 0,0055 | |||
| ES / Eversource Energy | 0,03 | 0,00 | 1,59 | 2,45 | 0,0337 | 0,0031 | |||
| AWK / American Water Works Company, Inc. | 0,01 | 0,00 | 1,39 | -5,69 | 0,0295 | 0,0004 | |||
| ORCL / Oracle Corporation | 0,01 | -1,08 | 1,36 | 54,72 | 0,0289 | 0,0115 | |||
| ISRG / Intuitive Surgical, Inc. | 0,00 | 0,00 | 1,35 | 9,68 | 0,0286 | 0,0044 | |||
| V / Visa Inc. | 0,00 | 3,72 | 1,34 | 5,11 | 0,0283 | 0,0033 | |||
| ORLY / O'Reilly Automotive, Inc. | 0,01 | 1 792,16 | 1,30 | 19,09 | 0,0277 | 0,0061 | |||
| BRK.B / Berkshire Hathaway Inc. | 0,00 | 15,24 | 1,29 | 5,16 | 0,0273 | 0,0031 | |||
| FRME / First Merchants Corporation | 0,03 | 0,00 | 1,19 | -5,33 | 0,0253 | 0,0005 | |||
| TXN / Texas Instruments Incorporated | 0,01 | 0,00 | 1,08 | 15,52 | 0,0229 | 0,0045 | |||
| NVDA / NVIDIA Corporation | 0,01 | -1,98 | 1,07 | 42,88 | 0,0228 | 0,0080 | |||
| TSLA / Tesla, Inc. | 0,00 | 0,00 | 1,01 | 22,63 | 0,0214 | 0,0052 | |||
| DVA / DaVita Inc. | 0,01 | 0,00 | 0,99 | -6,87 | 0,0210 | 0,0000 | |||
| ABT / Abbott Laboratories | 0,01 | 15,15 | 0,93 | 18,02 | 0,0197 | 0,0042 | |||
| ONB / Old National Bancorp | 0,04 | 0,00 | 0,80 | 0,76 | 0,0169 | 0,0013 | |||
| ACN / Accenture plc | 0,00 | 0,00 | 0,79 | -4,12 | 0,0168 | 0,0005 | |||
| ITW / Illinois Tool Works Inc. | 0,00 | 0,00 | 0,70 | -0,28 | 0,0149 | 0,0010 | |||
| BSX / Boston Scientific Corporation | 0,01 | 0,00 | 0,70 | 6,56 | 0,0148 | 0,0019 | |||
| ADP / Automatic Data Processing, Inc. | 0,00 | 0,00 | 0,70 | 0,87 | 0,0148 | 0,0012 | |||
| IJH / iShares Trust - iShares Core S&P Mid-Cap ETF | 0,01 | 0,00 | 0,69 | 6,16 | 0,0146 | 0,0018 | |||
| PLTR / Palantir Technologies Inc. | 0,00 | 0,00 | 0,66 | 61,73 | 0,0139 | 0,0059 | |||
| JPM / JPMorgan Chase & Co. | 0,00 | 0,33 | 0,62 | 18,51 | 0,0132 | 0,0028 | |||
| EEM / iShares, Inc. - iShares MSCI Emerging Markets ETF | 0,01 | 0,00 | 0,59 | 10,28 | 0,0125 | 0,0020 | |||
| LBRDK / Liberty Broadband Corporation | 0,01 | 0,00 | 0,59 | 15,69 | 0,0125 | 0,0025 | |||
| IWM / iShares Trust - iShares Russell 2000 ETF | 0,00 | 0,00 | 0,56 | 8,30 | 0,0119 | 0,0017 | |||
| EFA / iShares Trust - iShares MSCI EAFE ETF | 0,01 | 0,00 | 0,54 | 9,41 | 0,0114 | 0,0017 | |||
| SCHD / Schwab Strategic Trust - Schwab U.S. Dividend Equity ETF | 0,02 | -0,09 | 0,52 | -5,44 | 0,0111 | 0,0002 | |||
| PHM / PulteGroup, Inc. | 0,00 | 0,00 | 0,51 | 2,62 | 0,0108 | 0,0010 | |||
| ABBV / AbbVie Inc. | 0,00 | 0,00 | 0,50 | -11,33 | 0,0106 | -0,0005 | |||
| IEFA / iShares Trust - iShares Core MSCI EAFE ETF | 0,01 | 0,00 | 0,49 | 10,27 | 0,0105 | 0,0016 | |||
| MMC / Marsh & McLennan Companies, Inc. | 0,00 | 28,99 | 0,49 | 15,71 | 0,0103 | 0,0020 | |||
| VGT / Vanguard World Fund - Vanguard Information Technology ETF | 0,00 | 0,00 | 0,48 | 22,25 | 0,0102 | 0,0024 | |||
| USL / United States 12 Month Oil Fund, LP | 0,01 | 0,00 | 0,44 | -8,18 | 0,0093 | -0,0001 | |||
| MMI / Marcus & Millichap, Inc. | 0,01 | 0,00 | 0,42 | -10,94 | 0,0088 | -0,0004 | |||
| QCOM / QUALCOMM Incorporated | 0,00 | 0,00 | 0,41 | 3,84 | 0,0086 | 0,0009 | |||
| F / Ford Motor Company | 0,04 | 0,00 | 0,39 | 8,31 | 0,0083 | 0,0012 | |||
| WMT / Walmart Inc. | 0,00 | 0,00 | 0,39 | 11,59 | 0,0082 | 0,0013 | |||
| NFLX / Netflix, Inc. | 0,00 | 0,00 | 0,36 | 43,87 | 0,0077 | 0,0027 | |||
| GD / General Dynamics Corporation | 0,00 | 0,00 | 0,32 | 7,14 | 0,0067 | 0,0009 | |||
| DE / Deere & Company | 0,00 | 0,00 | 0,31 | 8,54 | 0,0065 | 0,0009 | |||
| QQQ / Invesco QQQ Trust, Series 1 | 0,00 | 9,15 | 0,30 | 28,51 | 0,0064 | 0,0018 | |||
| CM / Canadian Imperial Bank of Commerce | 0,00 | 0,00 | 0,28 | 25,78 | 0,0060 | 0,0016 | |||
| RY / Royal Bank of Canada | 0,00 | 0,00 | 0,28 | 16,88 | 0,0059 | 0,0012 | |||
| FICO / Fair Isaac Corporation | 0,00 | 0,00 | 0,27 | -0,72 | 0,0058 | 0,0004 | |||
| RTX / RTX Corporation | 0,00 | 0,00 | 0,27 | 10,12 | 0,0058 | 0,0009 | |||
| INTU / Intuit Inc. | 0,00 | 0,00 | 0,27 | 28,30 | 0,0058 | 0,0016 | |||
| ADC / Agree Realty Corporation | 0,00 | 0,00 | 0,24 | -5,12 | 0,0051 | 0,0001 | |||
| BA / The Boeing Company | 0,00 | 0,23 | 0,0049 | 0,0049 | |||||
| CMA / Comerica Incorporated | 0,00 | 0,00 | 0,22 | 0,94 | 0,0046 | 0,0004 | |||
| WFC / Wells Fargo & Company | 0,00 | 0,21 | 0,0045 | 0,0045 | |||||
| GWW / W.W. Grainger, Inc. | 0,00 | 0,21 | 0,0044 | 0,0044 | |||||
| VZ / Verizon Communications Inc. | 0,00 | 0,21 | 0,0044 | 0,0044 | |||||
| TGT / Target Corporation | 0,00 | -10,10 | 0,21 | -14,81 | 0,0044 | -0,0004 | |||
| GAUZ / Gauzy Ltd. | 0,01 | 0,11 | 0,0022 | 0,0022 | |||||
| DG / Dollar General Corporation | 0,00 | -100,00 | 0,00 | 0,0000 | |||||
| ABCL / AbCellera Biologics Inc. | 0,00 | -100,00 | 0,00 | 0,0000 | |||||
| MCK / McKesson Corporation | 0,00 | -100,00 | 0,00 | 0,0000 | |||||
| ICLR / ICON Public Limited Company | 0,00 | -100,00 | 0,00 | 0,0000 | |||||
| AMGN / Amgen Inc. | 0,00 | -100,00 | 0,00 | 0,0000 | |||||
| CABO / Cable One, Inc. | 0,00 | -100,00 | 0,00 | 0,0000 |