Statistiques de base
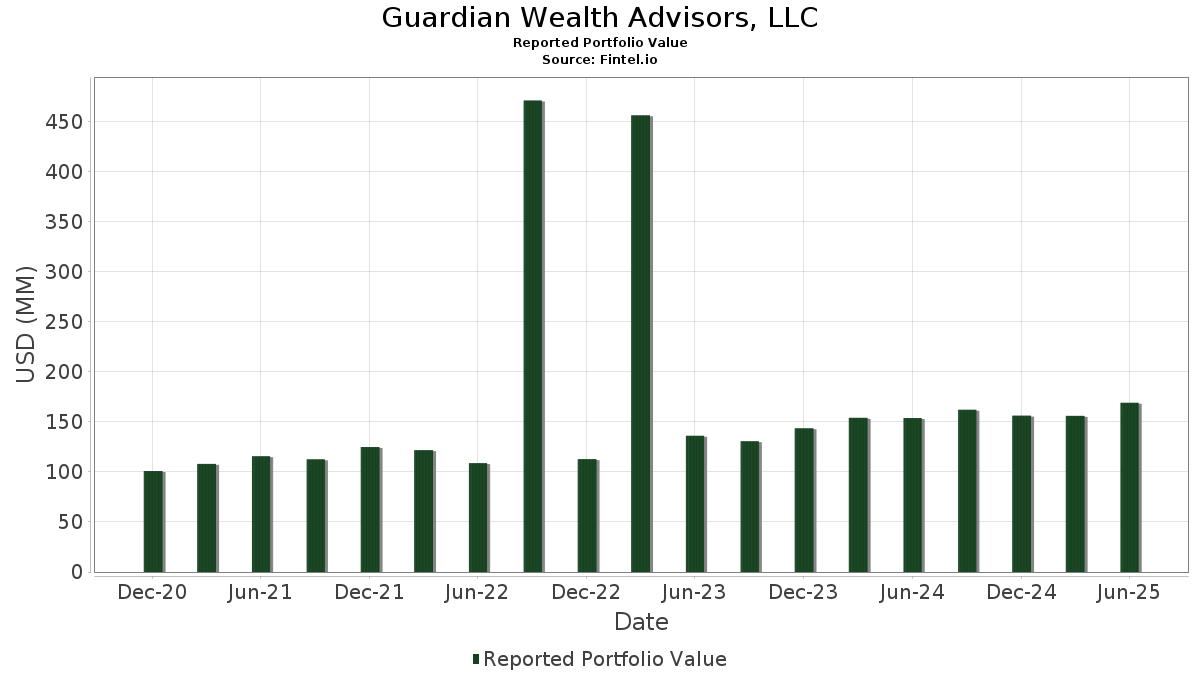
| Valeur du portefeuille | $ 168 926 103 |
| Positions actuelles | 74 |
Dernières positions, performances, ASG (à partir des dépôts 13F, 13D)
Guardian Wealth Advisors, LLC a déclaré un total de 74 positions dans ses derniers dépôts auprès de la SEC. La valeur la plus récente du portefeuille est calculée à 168 926 103 USD. Les actifs sous gestion réels (ASG) sont cette valeur plus les liquidités (qui ne sont pas divulguées). Les principales positions de Guardian Wealth Advisors, LLC sont SPDR S&P 500 ETF (US:SPY) , Vanguard Tax-Managed Funds - Vanguard FTSE Developed Markets ETF (US:VEA) , iShares Trust - iShares Russell 2000 ETF (US:IWM) , iShares Trust - iShares Core S&P Mid-Cap ETF (US:IJH) , and SPDR Series Trust - SPDR Portfolio S&P 500 Growth ETF (US:SPYG) .
Meilleures augmentations ce trimestre
Nous utilisons la variation de l'allocation du portefeuille car il s'agit de l'indicateur le plus significatif. Les changements peuvent être dus à des transactions ou à des variations de prix des actions.
| Titre | Actions (en millions) |
Valeur ($ en millions) |
% du portefeuille | ΔPortefeuille % |
|---|---|---|---|---|
| 0,10 | 9,98 | 5,9087 | 1,3468 | |
| 0,18 | 9,58 | 5,6684 | 0,7492 | |
| 0,39 | 22,06 | 13,0578 | 0,6494 | |
| 0,04 | 24,71 | 14,6259 | 0,5428 | |
| 0,24 | 14,95 | 8,8510 | 0,5140 | |
| 0,08 | 17,24 | 10,2031 | 0,3893 | |
| 0,02 | 9,31 | 5,5136 | 0,3644 | |
| 0,14 | 6,68 | 3,9556 | 0,2111 | |
| 0,00 | 0,22 | 0,1321 | 0,1321 | |
| 0,00 | 0,21 | 0,1239 | 0,1239 |
Principales baisses ce trimestre
Nous utilisons la variation de l'allocation du portefeuille car il s'agit de l'indicateur le plus significatif. Les changements peuvent être dus à des transactions ou à des variations de prix des actions.
| Titre | Actions (en millions) |
Valeur ($ en millions) |
% du portefeuille | ΔPortefeuille % |
|---|---|---|---|---|
| 0,03 | 5,39 | 3,1888 | -0,7178 | |
| 0,05 | 2,67 | 1,5824 | -0,4310 | |
| 0,14 | 3,50 | 2,0748 | -0,4082 | |
| 0,06 | 1,75 | 1,0364 | -0,3711 | |
| 0,06 | 6,19 | 3,6643 | -0,3138 | |
| 0,02 | 2,08 | 1,2305 | -0,2641 | |
| 0,00 | 0,27 | 0,1589 | -0,2007 | |
| 0,00 | 0,21 | 0,1253 | -0,1939 | |
| 0,00 | 0,56 | 0,3341 | -0,1776 | |
| 0,01 | 1,11 | 0,6561 | -0,1709 |
Déclarations 13F et dépôts de fonds
Ce formulaire a été déposé le 2025-07-31 pour la période de déclaration 2025-06-30. Cliquez sur l'icône du lien pour voir l'historique complet des transactions.
Mettre à niveau pour débloquer les données premium et exporter vers Excel ![]() .
.
| Titre | Type | Prix moyen de l'action | Actions (en millions) |
ΔActions (%) |
ΔActions (%) |
Valeur ($ en millions) |
Portefeuille (%) |
ΔPortefeuille (%) |
|
|---|---|---|---|---|---|---|---|---|---|
| SPY / SPDR S&P 500 ETF | 0,04 | 1,91 | 24,71 | 12,55 | 14,6259 | 0,5428 | |||
| VEA / Vanguard Tax-Managed Funds - Vanguard FTSE Developed Markets ETF | 0,39 | 1,69 | 22,06 | 14,05 | 13,0578 | 0,6494 | |||
| IWM / iShares Trust - iShares Russell 2000 ETF | 0,08 | 4,17 | 17,24 | 12,68 | 10,2031 | 0,3893 | |||
| IJH / iShares Trust - iShares Core S&P Mid-Cap ETF | 0,24 | 8,25 | 14,95 | 15,06 | 8,8510 | 0,5140 | |||
| SPYG / SPDR Series Trust - SPDR Portfolio S&P 500 Growth ETF | 0,10 | 18,36 | 9,98 | 40,38 | 5,9087 | 1,3468 | |||
| SPYV / SPDR Series Trust - SPDR Portfolio S&P 500 Value ETF | 0,18 | 21,85 | 9,58 | 24,89 | 5,6684 | 0,7492 | |||
| QQQ / Invesco QQQ Trust, Series 1 | 0,02 | -1,36 | 9,31 | 16,04 | 5,5136 | 0,3644 | |||
| VERSX / Vanguard Emerging Markets Stock Index Fund | 0,14 | 4,77 | 6,68 | 14,48 | 3,9556 | 0,2111 | |||
| IVW / iShares Trust - iShares S&P 500 Growth ETF | 0,06 | -15,83 | 6,19 | -0,16 | 3,6643 | -0,3138 | |||
| IVE / iShares Trust - iShares S&P 500 Value ETF | 0,03 | -13,73 | 5,39 | -11,55 | 3,1888 | -0,7178 | |||
| SJNK / SPDR Series Trust - SPDR Bloomberg Short Term High Yield Bond ETF | 0,14 | -10,58 | 3,50 | -9,46 | 2,0748 | -0,4082 | |||
| NEAR / iShares U.S. ETF Trust - iShares Short Duration Bond Active ETF | 0,05 | -15,20 | 2,67 | -14,82 | 1,5824 | -0,4310 | |||
| JPST / J.P. Morgan Exchange-Traded Fund Trust - JPMorgan Ultra-Short Income ETF | 0,05 | 7,97 | 2,37 | 8,11 | 1,4043 | -0,0039 | |||
| IWR / iShares Trust - iShares Russell Mid-Cap ETF | 0,02 | -17,47 | 2,08 | -10,78 | 1,2305 | -0,2641 | |||
| ICSH / iShares U.S. ETF Trust - iShares Ultra Short Duration Bond Active ETF | 0,04 | -4,70 | 1,90 | -4,71 | 1,1264 | -0,1543 | |||
| PFF / iShares Trust - iShares Preferred and Income Securities ETF | 0,06 | -20,07 | 1,75 | -20,20 | 1,0364 | -0,3711 | |||
| CHRW / C.H. Robinson Worldwide, Inc. | 0,02 | 0,00 | 1,60 | -6,32 | 0,9483 | -0,1485 | |||
| CAH / Cardinal Health, Inc. | 0,01 | -1,17 | 1,12 | 20,58 | 0,6628 | 0,0668 | |||
| ABBV / AbbVie Inc. | 0,01 | -2,94 | 1,11 | -14,04 | 0,6561 | -0,1709 | |||
| SPGI / S&P Global Inc. | 0,00 | -4,46 | 0,96 | -0,83 | 0,5684 | -0,0528 | |||
| JNJ / Johnson & Johnson | 0,01 | 0,80 | 0,94 | -7,19 | 0,5587 | -0,0935 | |||
| CINF / Cincinnati Financial Corporation | 0,01 | -1,93 | 0,93 | -1,06 | 0,5518 | -0,0530 | |||
| CVX / Chevron Corporation | 0,01 | 2,59 | 0,88 | -12,21 | 0,5196 | -0,1216 | |||
| ABT / Abbott Laboratories | 0,01 | -0,33 | 0,87 | 2,11 | 0,5161 | -0,0313 | |||
| ECL / Ecolab Inc. | 0,00 | -0,81 | 0,86 | 5,39 | 0,5101 | -0,0142 | |||
| XOM / Exxon Mobil Corporation | 0,01 | 0,72 | 0,78 | -8,74 | 0,4639 | -0,0868 | |||
| PG / The Procter & Gamble Company | 0,00 | 5,62 | 0,72 | -1,23 | 0,4272 | -0,0418 | |||
| GGG / Graco Inc. | 0,01 | 0,64 | 0,65 | 3,50 | 0,3853 | -0,0178 | |||
| LOW / Lowe's Companies, Inc. | 0,00 | -1,17 | 0,64 | -6,03 | 0,3788 | -0,0578 | |||
| VO / Vanguard Index Funds - Vanguard Mid-Cap ETF | 0,00 | -3,86 | 0,61 | 4,07 | 0,3635 | -0,0152 | |||
| PEP / PepsiCo, Inc. | 0,00 | 1,65 | 0,60 | -10,42 | 0,3566 | -0,0751 | |||
| EMR / Emerson Electric Co. | 0,00 | 0,69 | 0,60 | 22,45 | 0,3557 | 0,0409 | |||
| MSFT / Microsoft Corporation | 0,00 | -2,13 | 0,57 | 29,55 | 0,3379 | 0,0556 | |||
| ED / Consolidated Edison, Inc. | 0,01 | -4,84 | 0,57 | -13,68 | 0,3366 | -0,0859 | |||
| SCHF / Schwab Strategic Trust - Schwab International Equity ETF | 0,03 | 0,18 | 0,57 | 12,03 | 0,3364 | 0,0107 | |||
| AAPL / Apple Inc. | 0,00 | -23,39 | 0,56 | -29,23 | 0,3341 | -0,1776 | |||
| HYG / iShares Trust - iShares iBoxx $ High Yield Corporate Bond ETF | 0,01 | -3,84 | 0,56 | -1,60 | 0,3287 | -0,0337 | |||
| IBM / International Business Machines Corporation | 0,00 | 7,66 | 0,55 | 27,61 | 0,3261 | 0,0492 | |||
| MMM / 3M Company | 0,00 | -24,51 | 0,54 | -21,79 | 0,3211 | -0,1236 | |||
| SYY / Sysco Corporation | 0,01 | -0,73 | 0,50 | 0,20 | 0,2981 | -0,0244 | |||
| FAST / Fastenal Company | 0,01 | 238,02 | 0,50 | 83,15 | 0,2964 | 0,1209 | |||
| TROW / T. Rowe Price Group, Inc. | 0,00 | -16,44 | 0,45 | -12,23 | 0,2639 | -0,0619 | |||
| VOO / Vanguard Index Funds - Vanguard S&P 500 ETF | 0,00 | -1,52 | 0,44 | 8,91 | 0,2606 | 0,0011 | |||
| GPC / Genuine Parts Company | 0,00 | 1,39 | 0,43 | 3,33 | 0,2571 | -0,0128 | |||
| GIS / General Mills, Inc. | 0,01 | 2,72 | 0,41 | -10,92 | 0,2418 | -0,0526 | |||
| TGT / Target Corporation | 0,00 | 1,71 | 0,41 | -3,80 | 0,2401 | -0,0306 | |||
| WMT / Walmart Inc. | 0,00 | -3,30 | 0,38 | 7,93 | 0,2256 | -0,0015 | |||
| APD / Air Products and Chemicals, Inc. | 0,00 | -5,94 | 0,37 | -10,07 | 0,2169 | -0,0444 | |||
| ADP / Automatic Data Processing, Inc. | 0,00 | -4,96 | 0,35 | -4,07 | 0,2097 | -0,0273 | |||
| SCHM / Schwab Strategic Trust - Schwab U.S. Mid-Cap ETF | 0,01 | 2,74 | 0,33 | 9,87 | 0,1983 | 0,0029 | |||
| IVV / iShares Trust - iShares Core S&P 500 ETF | 0,00 | -9,78 | 0,33 | -0,30 | 0,1966 | -0,0171 | |||
| MDT / Medtronic plc | 0,00 | -3,58 | 0,32 | -6,41 | 0,1903 | -0,0302 | |||
| CB / Chubb Limited | 0,00 | 2,04 | 0,30 | -1,94 | 0,1800 | -0,0194 | |||
| BRK.B / Berkshire Hathaway Inc. | 0,00 | -0,97 | 0,30 | -9,73 | 0,1763 | -0,0352 | |||
| CLX / The Clorox Company | 0,00 | -13,13 | 0,30 | -29,19 | 0,1753 | -0,0929 | |||
| CTAS / Cintas Corporation | 0,00 | -29,01 | 0,30 | -22,92 | 0,1753 | -0,0715 | |||
| MCD / McDonald's Corporation | 0,00 | -7,35 | 0,29 | -13,27 | 0,1743 | -0,0437 | |||
| PNR / Pentair plc | 0,00 | -0,50 | 0,29 | 17,14 | 0,1700 | 0,0123 | |||
| KMB / Kimberly-Clark Corporation | 0,00 | -8,32 | 0,28 | -16,96 | 0,1656 | -0,0504 | |||
| NOBL / ProShares Trust - ProShares S&P 500 Dividend Aristocrats ETF | 0,00 | 9,05 | 0,27 | 7,57 | 0,1601 | -0,0013 | |||
| UNH / UnitedHealth Group Incorporated | 0,00 | -19,63 | 0,27 | -52,14 | 0,1589 | -0,2007 | |||
| SCHE / Schwab Strategic Trust - Schwab Emerging Markets Equity ETF | 0,01 | 0,06 | 0,26 | 9,70 | 0,1541 | 0,0014 | |||
| SCHX / Schwab Strategic Trust - Schwab U.S. Large-Cap ETF | 0,01 | 0,00 | 0,25 | 10,53 | 0,1497 | 0,0031 | |||
| EXPD / Expeditors International of Washington, Inc. | 0,00 | -1,03 | 0,24 | -5,88 | 0,1424 | -0,0217 | |||
| BSX / Boston Scientific Corporation | 0,00 | 0,00 | 0,24 | 6,22 | 0,1420 | -0,0025 | |||
| KO / The Coca-Cola Company | 0,00 | -14,83 | 0,23 | -15,94 | 0,1376 | -0,0397 | |||
| FDS / FactSet Research Systems Inc. | 0,00 | 0,22 | 0,1321 | 0,1321 | |||||
| IGSB / iShares Trust - iShares 1-5 Year Investment Grade Corporate Bond ETF | 0,00 | -7,18 | 0,22 | -6,44 | 0,1293 | -0,0206 | |||
| COST / Costco Wholesale Corporation | 0,00 | -9,47 | 0,22 | -5,24 | 0,1289 | -0,0185 | |||
| AMZN / Amazon.com, Inc. | 0,00 | -63,10 | 0,21 | -57,55 | 0,1253 | -0,1939 | |||
| SPSM / SPDR Series Trust - SPDR Portfolio S&P 600 Small Cap ETF | 0,00 | 0,00 | 0,21 | 4,50 | 0,1241 | -0,0046 | |||
| SPMD / SPDR Series Trust - SPDR Portfolio S&P 400 Mid Cap ETF | 0,00 | 0,21 | 0,1239 | 0,1239 | |||||
| HRL / Hormel Foods Corporation | 0,01 | -9,33 | 0,21 | -11,26 | 0,1216 | -0,0271 | |||
| SHW / The Sherwin-Williams Company | 0,00 | 2,57 | 0,21 | 0,99 | 0,1216 | -0,0090 | |||
| AFL / Aflac Incorporated | 0,00 | -100,00 | 0,00 | 0,0000 |