Statistiques de base
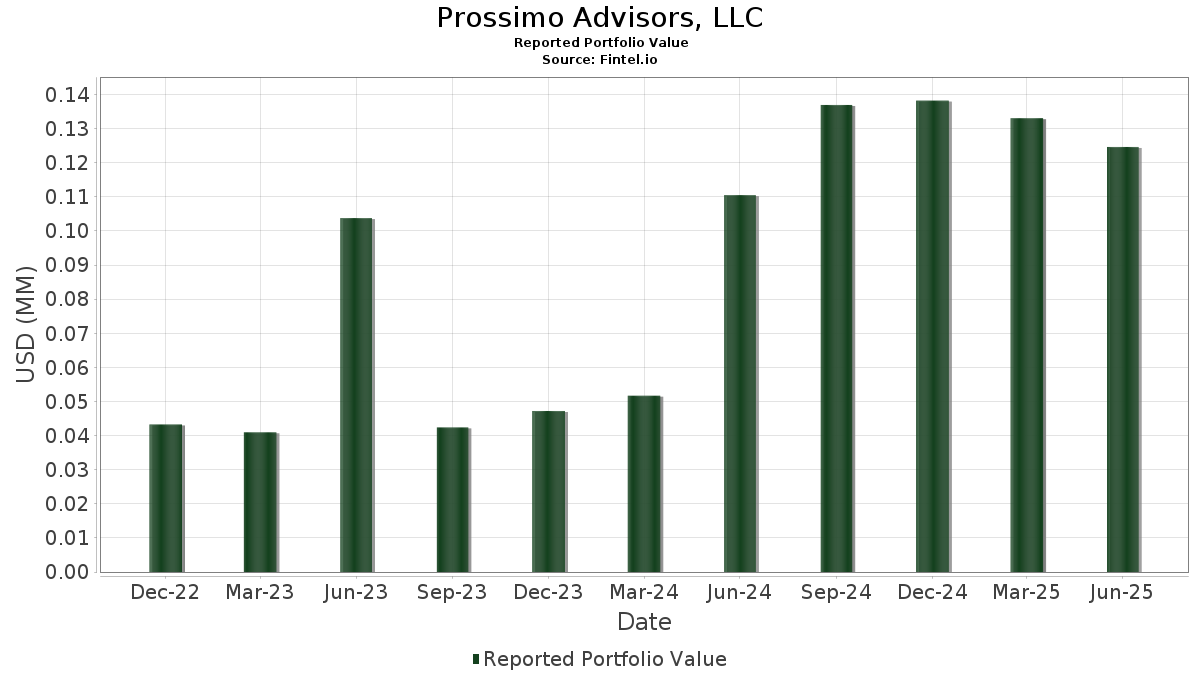
| Valeur du portefeuille | $ 124 609 |
| Positions actuelles | 127 |
Dernières positions, performances, ASG (à partir des dépôts 13F, 13D)
Prossimo Advisors, LLC a déclaré un total de 127 positions dans ses derniers dépôts auprès de la SEC. La valeur la plus récente du portefeuille est calculée à 124 609 USD. Les actifs sous gestion réels (ASG) sont cette valeur plus les liquidités (qui ne sont pas divulguées). Les principales positions de Prossimo Advisors, LLC sont Microsoft Corporation (US:MSFT) , Apple Inc. (US:AAPL) , Visa Inc. (US:V) , NVIDIA Corporation (US:NVDA) , and Amazon.com, Inc. (US:AMZN) . Les nouvelles positions de Prossimo Advisors, LLC incluent iShares Trust - iShares Russell Mid-Cap ETF (US:IWR) , iShares Trust - iShares Russell 2000 ETF (US:IWM) , KLA Corporation (US:KLAC) , Eli Lilly and Company (US:LLY) , and Seagate Technology Holdings plc (US:STX) .
Meilleures augmentations ce trimestre
Nous utilisons la variation de l'allocation du portefeuille car il s'agit de l'indicateur le plus significatif. Les changements peuvent être dus à des transactions ou à des variations de prix des actions.
| Titre | Actions (en millions) |
Valeur ($ en millions) |
% du portefeuille | ΔPortefeuille % |
|---|---|---|---|---|
| 0,02 | 0,01 | 7,9457 | 2,3296 | |
| 0,04 | 0,01 | 5,0831 | 1,8369 | |
| 0,02 | 0,01 | 4,3368 | 0,8335 | |
| 0,01 | 0,00 | 0,8226 | 0,8226 | |
| 0,01 | 0,00 | 0,8137 | 0,8137 | |
| 0,03 | 0,01 | 4,1979 | 0,7938 | |
| 0,00 | 0,00 | 0,6581 | 0,6581 | |
| 0,00 | 0,00 | 1,3715 | 0,4500 | |
| 0,01 | 0,00 | 2,0552 | 0,4287 | |
| 0,00 | 0,00 | 1,0015 | 0,4070 |
Principales baisses ce trimestre
Nous utilisons la variation de l'allocation du portefeuille car il s'agit de l'indicateur le plus significatif. Les changements peuvent être dus à des transactions ou à des variations de prix des actions.
| Titre | Actions (en millions) |
Valeur ($ en millions) |
% du portefeuille | ΔPortefeuille % |
|---|---|---|---|---|
| 0,00 | 0,00 | 0,3708 | -0,9987 | |
| 0,01 | 0,00 | 0,8234 | -0,9121 | |
| 0,01 | 0,00 | 1,6853 | -0,6169 | |
| 0,00 | 0,00 | 0,6091 | -0,4349 | |
| 0,00 | 0,00 | 0,2769 | -0,3763 | |
| 0,01 | 0,00 | 0,9839 | -0,3593 | |
| 0,00 | 0,00 | 0,4462 | -0,3265 | |
| 0,00 | 0,00 | 0,2504 | -0,2637 | |
| 0,00 | 0,00 | 0,2881 | -0,2583 | |
| 0,00 | 0,00 | 0,3716 | -0,2478 |
Déclarations 13F et dépôts de fonds
Ce formulaire a été déposé le 2025-08-13 pour la période de déclaration 2025-06-30. Cliquez sur l'icône du lien pour voir l'historique complet des transactions.
Mettre à niveau pour débloquer les données premium et exporter vers Excel ![]() .
.
| Titre | Type | Prix moyen de l'action | Actions (en millions) |
ΔActions (%) |
ΔActions (%) |
Valeur ($ en millions) |
Portefeuille (%) |
ΔPortefeuille (%) |
|
|---|---|---|---|---|---|---|---|---|---|
| MSFT / Microsoft Corporation | 0,02 | 0,00 | 0,01 | 28,57 | 7,9457 | 2,3296 | |||
| AAPL / Apple Inc. | 0,03 | 1,53 | 0,01 | -14,29 | 5,3479 | 0,0062 | |||
| V / Visa Inc. | 0,02 | -0,18 | 0,01 | 0,00 | 5,2532 | 0,3880 | |||
| NVDA / NVIDIA Corporation | 0,04 | 0,61 | 0,01 | 50,00 | 5,0831 | 1,8369 | |||
| AMZN / Amazon.com, Inc. | 0,02 | 0,54 | 0,01 | 25,00 | 4,3368 | 0,8335 | |||
| GOOGL / Alphabet Inc. | 0,03 | 1,35 | 0,01 | 25,00 | 4,1979 | 0,7938 | |||
| COST / Costco Wholesale Corporation | 0,00 | -8,82 | 0,00 | 0,00 | 3,0303 | 0,0569 | |||
| JPM / JPMorgan Chase & Co. | 0,01 | 0,11 | 0,00 | 0,00 | 2,0552 | 0,4287 | |||
| HD / The Home Depot, Inc. | 0,01 | -5,63 | 0,00 | 0,00 | 1,9541 | 0,0149 | |||
| CTAS / Cintas Corporation | 0,01 | -36,78 | 0,00 | -33,33 | 1,6853 | -0,6169 | |||
| WMT / Walmart Inc. | 0,02 | -17,96 | 0,00 | 0,00 | 1,6508 | -0,0411 | |||
| MA / Mastercard Incorporated | 0,00 | -6,35 | 0,00 | 0,00 | 1,6355 | 0,0398 | |||
| TT / Trane Technologies plc | 0,00 | -5,53 | 0,00 | 0,00 | 1,4806 | 0,3502 | |||
| BRK.A / Berkshire Hathaway Inc. | 0,00 | -2,37 | 0,00 | 0,00 | 1,4156 | -0,0733 | |||
| PWR / Quanta Services, Inc. | 0,00 | -6,28 | 0,00 | 0,00 | 1,3715 | 0,4500 | |||
| WMB / The Williams Companies, Inc. | 0,02 | 1,05 | 0,00 | 0,00 | 1,2335 | 0,1459 | |||
| TMUS / T-Mobile US, Inc. | 0,01 | -2,11 | 0,00 | 0,00 | 1,1636 | -0,0825 | |||
| SPY / SPDR S&P 500 ETF | 0,00 | 0,00 | 0,00 | 0,00 | 1,0168 | 0,1547 | |||
| META / Meta Platforms, Inc. | 0,00 | 23,32 | 0,00 | 1,0015 | 0,4070 | ||||
| HIG / The Hartford Insurance Group, Inc. | 0,01 | -33,13 | 0,00 | 0,00 | 0,9839 | -0,3593 | |||
| PM / Philip Morris International Inc. | 0,01 | -0,51 | 0,00 | 0,9149 | 0,1640 | ||||
| TJX / The TJX Companies, Inc. | 0,01 | -5,81 | 0,00 | 0,00 | 0,8796 | 0,0167 | |||
| TSLA / Tesla, Inc. | 0,00 | -16,05 | 0,00 | 0,00 | 0,8739 | 0,0787 | |||
| GJR / Strats Trust For Procter & Gambel Security - Preferred Security | 0,01 | -0,17 | 0,00 | 0,00 | 0,8266 | -0,0025 | |||
| VBR / Vanguard Index Funds - Vanguard Small-Cap Value ETF | 0,01 | -57,53 | 0,00 | -50,00 | 0,8234 | -0,9121 | |||
| IWR / iShares Trust - iShares Russell Mid-Cap ETF | 0,01 | 0,00 | 0,8226 | 0,8226 | |||||
| HYG / iShares Trust - iShares iBoxx $ High Yield Corporate Bond ETF | 0,01 | 0,00 | 0,8137 | 0,8137 | |||||
| ASML / ASML Holding N.V. - Depositary Receipt (Common Stock) | 0,00 | -32,24 | 0,00 | -100,00 | 0,7953 | -0,1134 | |||
| ETR / Entergy Corporation | 0,01 | 0,66 | 0,00 | -100,00 | 0,7921 | 0,0337 | |||
| PAYX / Paychex, Inc. | 0,01 | 0,00 | 0,00 | -100,00 | 0,7897 | 0,0050 | |||
| GOOG / Alphabet Inc. | 0,01 | -3,22 | 0,00 | 0,7744 | 0,1145 | ||||
| KO / The Coca-Cola Company | 0,01 | -3,26 | 0,00 | 0,7544 | 0,0148 | ||||
| CINF / Cincinnati Financial Corporation | 0,01 | -15,32 | 0,00 | -100,00 | 0,7471 | -0,0729 | |||
| MCD / McDonald's Corporation | 0,00 | -14,18 | 0,00 | -100,00 | 0,7239 | -0,1210 | |||
| AVGO / Broadcom Inc. | 0,00 | 28,24 | 0,00 | 0,7174 | 0,3995 | ||||
| VRTX / Vertex Pharmaceuticals Incorporated | 0,00 | -3,89 | 0,00 | 0,7054 | -0,0432 | ||||
| PEP / PepsiCo, Inc. | 0,01 | -14,44 | 0,00 | -100,00 | 0,7014 | -0,1705 | |||
| IWM / iShares Trust - iShares Russell 2000 ETF | 0,00 | 0,00 | 0,6581 | 0,6581 | |||||
| DUK / Duke Energy Corporation | 0,01 | -2,47 | 0,00 | 0,6508 | 0,0052 | ||||
| SNPS / Synopsys, Inc. | 0,00 | -11,86 | 0,00 | 0,6420 | 0,0715 | ||||
| PH / Parker-Hannifin Corporation | 0,00 | -5,57 | 0,00 | 0,6179 | 0,0843 | ||||
| CRM / Salesforce, Inc. | 0,00 | -17,30 | 0,00 | 0,6123 | -0,0702 | ||||
| VOT / Vanguard Index Funds - Vanguard Mid-Cap Growth ETF | 0,00 | -52,98 | 0,00 | -100,00 | 0,6091 | -0,4349 | |||
| AEP / American Electric Power Company, Inc. | 0,01 | -2,49 | 0,00 | 0,6067 | -0,0074 | ||||
| LIN / Linde plc | 0,00 | 7,74 | 0,00 | 0,6027 | 0,0833 | ||||
| IWS / iShares Trust - iShares Russell Mid-Cap Value ETF | 0,01 | -20,86 | 0,00 | 0,6027 | -0,0768 | ||||
| VOE / Vanguard Index Funds - Vanguard Mid-Cap Value ETF | 0,00 | -21,16 | 0,00 | 0,5882 | -0,0942 | ||||
| CVX / Chevron Corporation | 0,01 | -7,36 | 0,00 | 0,5874 | -0,1063 | ||||
| DIS / The Walt Disney Company | 0,01 | -32,97 | 0,00 | 0,5866 | -0,0658 | ||||
| T / AT&T Inc. | 0,03 | -12,74 | 0,00 | 0,5810 | -0,0278 | ||||
| USB / U.S. Bancorp | 0,02 | 0,00 | 0,00 | 0,5770 | 0,0727 | ||||
| FITB / Fifth Third Bancorp | 0,02 | -14,92 | 0,00 | 0,5770 | -0,0280 | ||||
| SPGI / S&P Global Inc. | 0,00 | -14,81 | 0,00 | 0,5497 | -0,0328 | ||||
| IBM / International Business Machines Corporation | 0,00 | -2,78 | 0,00 | 0,5465 | 0,1023 | ||||
| MET / MetLife, Inc. | 0,01 | -2,91 | 0,00 | 0,5425 | 0,0201 | ||||
| SAP / SAP SE - Depositary Receipt (Common Stock) | 0,00 | 0,00 | 0,00 | 0,5329 | 0,0924 | ||||
| LMT / Lockheed Martin Corporation | 0,00 | -22,99 | 0,00 | 0,5297 | -0,0912 | ||||
| NFLX / Netflix, Inc. | 0,00 | 21,05 | 0,00 | 0,5192 | 0,2396 | ||||
| IGIB / iShares Trust - iShares 5-10 Year Investment Grade Corporate Bond ETF | 0,01 | -14,06 | 0,00 | 0,5088 | -0,0376 | ||||
| COF / Capital One Financial Corporation | 0,00 | 5,49 | 0,00 | 0,5088 | 0,1277 | ||||
| SCHP / Schwab Strategic Trust - Schwab U.S. TIPS ETF | 0,02 | 0,00 | 0,00 | 0,4927 | 0,0282 | ||||
| NOC / Northrop Grumman Corporation | 0,00 | -7,63 | 0,00 | 0,4759 | -0,0179 | ||||
| EOG / EOG Resources, Inc. | 0,00 | -16,25 | 0,00 | 0,4687 | -0,0935 | ||||
| ICSH / iShares U.S. ETF Trust - iShares Ultra Short Duration Bond Active ETF | 0,01 | 0,00 | 0,00 | 0,4606 | 0,0292 | ||||
| JPST / J.P. Morgan Exchange-Traded Fund Trust - JPMorgan Ultra-Short Income ETF | 0,01 | 0,00 | 0,00 | 0,4574 | 0,0298 | ||||
| ADBE / Adobe Inc. | 0,00 | -46,42 | 0,00 | -100,00 | 0,4462 | -0,3265 | |||
| C / Citigroup Inc. | 0,01 | -3,63 | 0,00 | 0,4382 | 0,0827 | ||||
| IP / International Paper Company | 0,01 | -2,07 | 0,00 | 0,4285 | -0,0382 | ||||
| CFG / Citizens Financial Group, Inc. | 0,01 | -1,32 | 0,00 | 0,4109 | 0,0539 | ||||
| UNM / Unum Group | 0,01 | -2,10 | 0,00 | 0,4021 | 0,0142 | ||||
| VZ / Verizon Communications Inc. | 0,01 | -16,31 | 0,00 | 0,3972 | -0,0688 | ||||
| NI / NiSource Inc. | 0,01 | -8,93 | 0,00 | 0,3940 | -0,0088 | ||||
| HCA / HCA Healthcare, Inc. | 0,00 | -19,01 | 0,00 | 0,3876 | -0,0168 | ||||
| MO / Altria Group, Inc. | 0,01 | -4,19 | 0,00 | 0,3788 | -0,0008 | ||||
| TMO / Thermo Fisher Scientific Inc. | 0,00 | -30,94 | 0,00 | 0,3716 | -0,2478 | ||||
| UNH / UnitedHealth Group Incorporated | 0,00 | -57,42 | 0,00 | -100,00 | 0,3708 | -0,9987 | |||
| BUD / Anheuser-Busch InBev SA/NV - Depositary Receipt (Common Stock) | 0,01 | -27,62 | 0,00 | 0,3667 | -0,0587 | ||||
| ROP / Roper Technologies, Inc. | 0,00 | -10,36 | 0,00 | 0,3659 | -0,0317 | ||||
| RF / Regions Financial Corporation | 0,02 | -1,23 | 0,00 | 0,3627 | 0,0448 | ||||
| PANW / Palo Alto Networks, Inc. | 0,00 | -22,29 | 0,00 | 0,3571 | -0,0022 | ||||
| NEE / NextEra Energy, Inc. | 0,01 | -20,17 | 0,00 | 0,3338 | -0,0660 | ||||
| FE / FirstEnergy Corp. | 0,01 | -3,44 | 0,00 | 0,3298 | 0,0081 | ||||
| ORCL / Oracle Corporation | 0,00 | 19,81 | 0,00 | 0,3282 | 0,1644 | ||||
| MRK / Merck & Co., Inc. | 0,01 | -6,95 | 0,00 | 0,3250 | -0,0463 | ||||
| PSE / Public Service Enterprise Group Incorporated | 0,00 | -5,86 | 0,00 | 0,3114 | 0,0085 | ||||
| AMT / American Tower Corporation | 0,00 | -51,38 | 0,00 | 0,2881 | -0,2583 | ||||
| CME / CME Group Inc. | 0,00 | -6,16 | 0,00 | 0,2865 | 0,0114 | ||||
| PRU / Prudential Financial, Inc. | 0,00 | 48,50 | 0,00 | 0,2865 | 0,0986 | ||||
| GIS / General Mills, Inc. | 0,01 | -9,13 | 0,00 | 0,2777 | -0,0530 | ||||
| AJG / Arthur J. Gallagher & Co. | 0,00 | 0,00 | 0,00 | 0,2777 | -0,0027 | ||||
| XOM / Exxon Mobil Corporation | 0,00 | -56,18 | 0,00 | 0,2769 | -0,3763 | ||||
| WEC / WEC Energy Group, Inc. | 0,00 | -34,30 | 0,00 | 0,2753 | -0,1351 | ||||
| FNF / Fidelity National Financial, Inc. | 0,01 | -35,73 | 0,00 | 0,2704 | -0,1865 | ||||
| ABBV / AbbVie Inc. | 0,00 | -3,97 | 0,00 | 0,2672 | -0,0266 | ||||
| ACN / Accenture plc | 0,00 | -31,28 | 0,00 | 0,2672 | -0,1131 | ||||
| MMC / Marsh & McLennan Companies, Inc. | 0,00 | -24,19 | 0,00 | 0,2576 | -0,0979 | ||||
| BAC / Bank of America Corporation | 0,01 | -25,11 | 0,00 | 0,2544 | -0,0267 | ||||
| NVO / Novo Nordisk A/S - Depositary Receipt (Common Stock) | 0,00 | -54,10 | 0,00 | 0,2504 | -0,2637 | ||||
| XEL / Xcel Energy Inc. | 0,00 | 59,34 | 0,00 | 0,2488 | 0,0970 | ||||
| MPLX / MPLX LP - Limited Partnership | 0,01 | 0,00 | 0,00 | 0,2480 | 0,0067 | ||||
| ES / Eversource Energy | 0,00 | -15,07 | 0,00 | 0,2432 | -0,0184 | ||||
| KLAC / KLA Corporation | 0,00 | 0,00 | 0,2432 | 0,2432 | |||||
| LLY / Eli Lilly and Company | 0,00 | 0,00 | 0,2359 | 0,2359 | |||||
| DTE / DTE Energy Company | 0,00 | -4,73 | 0,00 | 0,2351 | -0,0061 | ||||
| CSX / CSX Corporation | 0,01 | -11,75 | 0,00 | 0,2351 | 0,0104 | ||||
| NXPI / NXP Semiconductors N.V. | 0,00 | -38,39 | 0,00 | 0,2335 | -0,0754 | ||||
| F / Ford Motor Company | 0,03 | 29,09 | 0,00 | 0,2295 | 0,0754 | ||||
| SRE / Sempra | 0,00 | -40,25 | 0,00 | 0,2263 | -0,1074 | ||||
| EPD / Enterprise Products Partners L.P. - Limited Partnership | 0,01 | 0,00 | 0,00 | 0,2191 | -0,0064 | ||||
| D / Dominion Energy, Inc. | 0,00 | 20,42 | 0,00 | 0,2151 | 0,0497 | ||||
| ARCC / Ares Capital Corporation | 0,01 | -42,35 | 0,00 | 0,2127 | -0,1361 | ||||
| ET / Energy Transfer LP - Limited Partnership | 0,01 | 0,00 | 0,00 | 0,2119 | 0,0082 | ||||
| STX / Seagate Technology Holdings plc | 0,00 | 0,00 | 0,2103 | 0,2103 | |||||
| TFC / Truist Financial Corporation | 0,01 | 0,00 | 0,1982 | 0,1982 | |||||
| SHYG / iShares Trust - iShares 0-5 Year High Yield Corporate Bond ETF | 0,01 | -13,48 | 0,00 | 0,1926 | -0,0133 | ||||
| HTGC / Hercules Capital, Inc. | 0,01 | -25,03 | 0,00 | 0,1918 | -0,0600 | ||||
| GILD / Gilead Sciences, Inc. | 0,00 | 0,00 | 0,1902 | 0,1902 | |||||
| ISRG / Intuitive Surgical, Inc. | 0,00 | -3,21 | 0,00 | 0,1838 | 0,0214 | ||||
| CB / Chubb Limited | 0,00 | 5,38 | 0,00 | 0,1822 | 0,0138 | ||||
| PAA / Plains All American Pipeline, L.P. - Limited Partnership | 0,01 | 0,00 | 0,00 | 0,1814 | -0,0043 | ||||
| HRB / H&R Block, Inc. | 0,00 | -4,71 | 0,00 | 0,1790 | 0,0023 | ||||
| AWK / American Water Works Company, Inc. | 0,00 | -53,91 | 0,00 | 0,1766 | -0,2045 | ||||
| KMB / Kimberly-Clark Corporation | 0,00 | 0,00 | 0,1741 | 0,1741 | |||||
| QCOM / QUALCOMM Incorporated | 0,00 | -10,01 | 0,00 | 0,1685 | -0,0013 | ||||
| SON / Sonoco Products Company | 0,00 | 1,53 | 0,00 | 0,1677 | 0,0001 | ||||
| WES / Western Midstream Partners, LP - Limited Partnership | 0,01 | 0,00 | 0,00 | 0,1677 | 0,0009 | ||||
| KMI / Kinder Morgan, Inc. | 0,01 | 0,00 | 0,1645 | 0,1645 | |||||
| EQIX / Equinix, Inc. | 0,00 | -100,00 | 0,00 | 0,0000 | |||||
| GPC / Genuine Parts Company | 0,00 | -100,00 | 0,00 | 0,0000 | |||||
| SCHE / Schwab Strategic Trust - Schwab Emerging Markets Equity ETF | 0,00 | -100,00 | 0,00 | 0,0000 | |||||
| PFG / Principal Financial Group, Inc. | 0,00 | -100,00 | 0,00 | 0,0000 | |||||
| ENB / Enbridge Inc. | 0,00 | -100,00 | 0,00 | 0,0000 | |||||
| VYM / Vanguard Whitehall Funds - Vanguard High Dividend Yield ETF | 0,00 | -100,00 | 0,00 | 0,0000 | |||||
| LPLA / LPL Financial Holdings Inc. | 0,00 | -100,00 | 0,00 | 0,0000 | |||||
| AMGN / Amgen Inc. | 0,00 | -100,00 | 0,00 | 0,0000 | |||||
| PFE / Pfizer Inc. | 0,00 | -100,00 | 0,00 | 0,0000 | |||||
| MPC / Marathon Petroleum Corporation | 0,00 | -100,00 | 0,00 | 0,0000 | |||||
| SCHD / Schwab Strategic Trust - Schwab U.S. Dividend Equity ETF | 0,00 | -100,00 | 0,00 | 0,0000 | |||||
| IVV / iShares Trust - iShares Core S&P 500 ETF | 0,00 | -100,00 | 0,00 | 0,0000 | |||||
| HPQ / HP Inc. | 0,00 | -100,00 | 0,00 | 0,0000 | |||||
| GLPI / Gaming and Leisure Properties, Inc. | 0,00 | -100,00 | 0,00 | 0,0000 | |||||
| ZTS / Zoetis Inc. | 0,00 | -100,00 | 0,00 | 0,0000 | |||||
| JNJ / Johnson & Johnson | 0,00 | -100,00 | 0,00 | 0,0000 | |||||
| LYB / LyondellBasell Industries N.V. | 0,00 | -100,00 | 0,00 | 0,0000 |