Statistiques de base
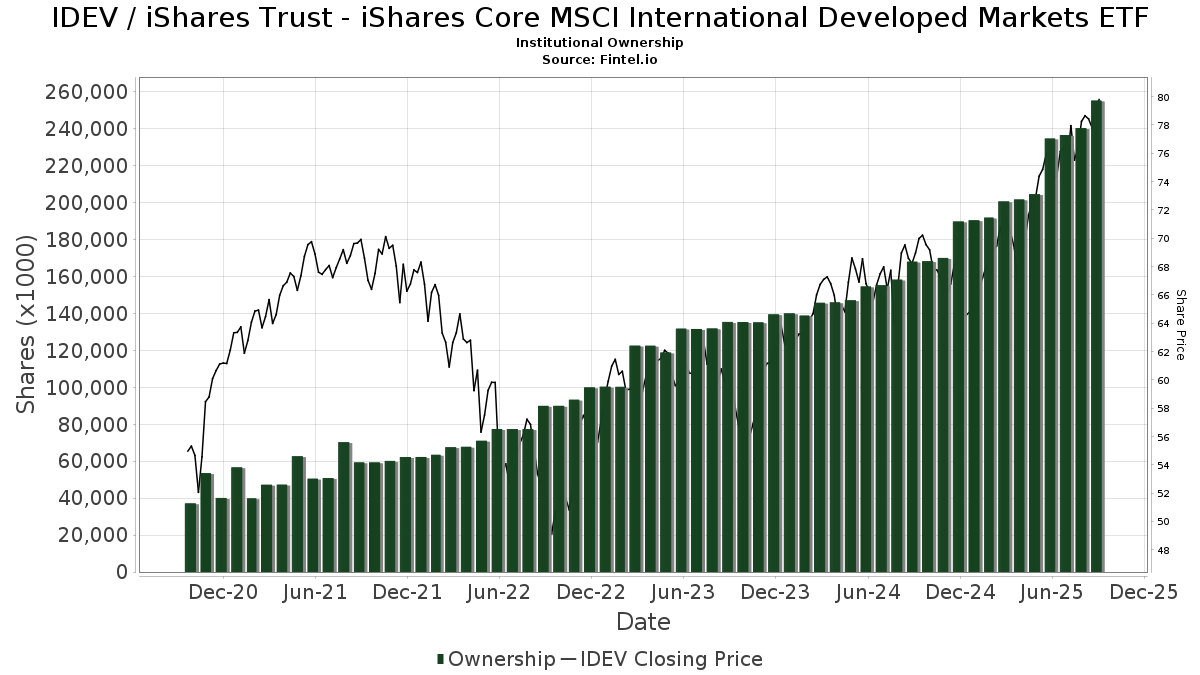
| Propriétaires institutionnels | 598 total, 598 long only, 0 short only, 0 long/short - change of 8,32% MRQ |
| Allocation moyenne du portefeuille | 1.7535 % - change of 10,97% MRQ |
| Actions institutionnelles (Long) | 255 284 258 (ex 13D/G) - change of 20,55MM shares 8,76% MRQ |
| Valeur institutionnelle (Long) | $ 18 901 830 USD ($1000) |
Participation institutionnels et actionnaires
iShares Trust - iShares Core MSCI International Developed Markets ETF (US:IDEV) détient 598 des propriétaires institutionnels et des actionnaires qui ont déposé des formulaires 13D/G ou 13F auprès de la Securities Exchange Commission (SEC). Ces institutions détiennent un total de 255,284,258 actions. Les principaux actionnaires incluent Bank Of America Corp /de/, BlackRock, Inc., Creative Planning, Sei Investments Co, Morgan Stanley, AOA - iShares Core Aggressive Allocation ETF, Pnc Financial Services Group, Inc., Ameriprise Financial Inc, Bank of Finland, and AOR - iShares Core Growth Allocation ETF .
iShares Trust - iShares Core MSCI International Developed Markets ETF (ARCA:IDEV) la structure de l'actionnariat institutionnel indique les positions actuelles des institutions et des fonds dans l'entreprise, ainsi que les derniers changements dans le volume des positions. Les principaux actionnaires peuvent être des investisseurs individuels, des fonds communs de placement, des fonds spéculatifs ou des institutions. L'annexe 13D indique que l'investisseur détient (ou a détenu) plus de 5 % de l'entreprise et qu'il a l'intention (ou a eu l'intention) de poursuivre activement un changement de stratégie commerciale. L'annexe 13G indique un investissement passif de plus de 5 %.
The share price as of September 5, 2025 is 78,70 / share. Previously, on September 9, 2024, the share price was 68,07 / share. This represents an increase of 15,62% over that period.
Indice de confiance des fonds
L'indice de confiance des fonds (anciennement score d'accumulation de participation) trouve les actions qui sont les plus achetées par les fonds. Il est le résultat d'un modèle quantitatif sophistiqué à plusieurs facteurs qui identifie les entreprises avec les niveaux les plus élevés d'accumulation institutionnelle. Le modèle de notation utilise une combinaison de l'augmentation totale des propriétaires déclarés, des variations des allocations de portefeuille chez ces propriétaires et d'autres indicateurs. Le chiffre varie de 0 à 100, les chiffres plus élevés indiquant un niveau d'accumulation plus élevé par rapport aux autres entreprises, 50 étant la moyenne.
Fréquence de mise à jour : Quotidienne
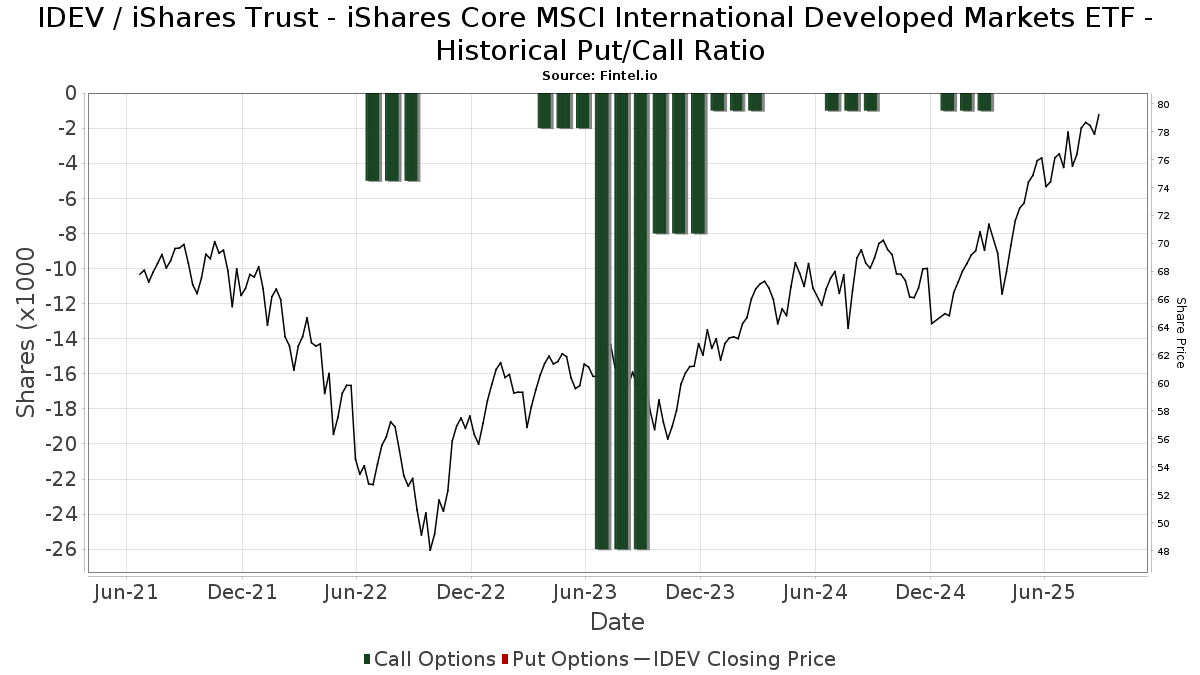
Ratio put/call institutionnel
En plus de signaler les actions et les dettes standard, les institutions ayant plus de 100 millions d'actifs sous gestion doivent également divulguer leurs positions en options de vente et d'achat. Étant donné que les options de vente indiquent généralement une confiance négative, et les options d'achat indiquent une confiance positive, nous pouvons avoir une idée de la confiance institutionnelle globale en traçant le ratio des ventes à découvert par rapport aux achats d'options. Le graphique à droite trace l'historique du ratio des ventes à découvert/achats d'options pour cet instrument.
L'utilisation du ratio put/call comme indicateur de la confiance des investisseurs permet de pallier à l'une des principales lacunes de l'utilisation de la participation institutionnelle totale, à savoir qu'une part importante des actifs sous gestion est investie passivement pour suivre les indices. Les fonds gérés passivement n'achètent généralement pas d'options, de sorte que l'indicateur du ratio put/call suit de plus près la confiance des fonds gérés activement.
Déclarations 13D/G
Nous présentons les dépôts 13D/G séparément des dépôts 13F en raison de leur traitement différent par la SEC. Les déclarations 13D/G peuvent être déposées par des groupes d'investisseurs (avec un leader), ce qui n'est pas le cas des déclarations 13F. Il en résulte des situations dans lesquelles un investisseur peut déposer une déclaration 13D/G indiquant une valeur pour le total des actions (représentant toutes les actions détenues par le groupe d'investisseurs), mais déposer ensuite une déclaration 13F indiquant une valeur différente pour le total des actions (représentant strictement ses propres actions). Cela signifie que l'actionnariat des déclarations 13D/G et des déclarations 13F n'est souvent pas directement comparable, c'est pourquoi nous les présentons séparément.
Note : À compter du 16 mai 2021, nous n'affichons plus les propriétaires qui n'ont pas déposé de déclaration 13D/G au cours de l'année écoulée. Auparavant, nous montrions l'historique complet des déclarations 13D/G. En général, les entités qui sont tenues de déposer des déclarations 13D/G doivent le faire au moins une fois par an avant de soumettre une déclaration de clôture. Cependant, il arrive que des fonds sortent de positions sans soumettre de déclaration de clôture (c'est-à-dire qu'ils procèdent à une liquidation), de sorte que l'affichage de l'historique complet pouvait prêter à confusion quant à l'actionnariat actuel. Pour éviter toute confusion, nous n'affichons désormais que les propriétaires "actuels", c'est-à-dire les propriétaires qui ont déposé des documents au cours de l'année écoulée.
Upgrade to unlock premium data.
| Date de dépôt | Formulaire | Investisseur | Actions précédentes |
Actions actuelles |
&Delta ; Actions (Pourcentage) |
Participation (Pourcentage) |
&Delta ; Participation (Pourcentage) |
|
|---|---|---|---|---|---|---|---|---|
| 2025-04-17 | BlackRock, Inc. | 16,866,984 | 15,749,451 | -6.63 | 5.90 | -25.32 |
Déclarations 13F et NPORT
Les détails des déclarations 13F sont gratuits. Les détails des déclarations NP nécessitent une adhésion premium. Les lignes vertes indiquent de nouvelles positions. Les lignes rouges indiquent des positions clôturées. Cliquez sur l'icône du lien pour voir l'historique complet des transactions.
Mettre à niveau
pour débloquer des données premium et les exporter vers Excel ![]() .
.
| Date de dépôt | Source | Investisseur | Type | Prix moyen (Est) |
Actions | Δ Actions (%) |
Valeur déclarée (1000 $) |
Δ Valeur (%) |
Allocation de portefeuille (%) |
|
|---|---|---|---|---|---|---|---|---|---|---|
| 2025-07-18 | 13F | USA Financial Portformulas Corp | 12 297 | 935 | ||||||
| 2025-08-06 | 13F | Rialto Wealth Management, LLC | 602 | 0,00 | 46 | 9,76 | ||||
| 2025-07-16 | 13F | Independent Wealth Network Inc. | 9 340 | 53,24 | 710 | 69,45 | ||||
| 2025-07-18 | 13F | BSW Wealth Partners | 315 345 | 4,39 | 23 979 | 15,22 | ||||
| 2025-08-05 | 13F | Westside Investment Management, Inc. | 260 | 0,00 | 20 | 11,76 | ||||
| 2025-07-16 | 13F | Five Oceans Advisors | 3 648 | 0,00 | 277 | 10,36 | ||||
| 2025-07-15 | 13F | Fifth Third Bancorp | 3 690 | 123,23 | 281 | 147,79 | ||||
| 2025-08-14 | 13F | Tudor Financial Inc. | 11 836 | -1,54 | 900 | 8,70 | ||||
| 2025-04-24 | 13F | Mirae Asset Global Investments Co., Ltd. | 0 | -100,00 | 0 | |||||
| 2025-08-05 | 13F | Elyxium Wealth, LLC | 6 085 | -30,66 | 463 | -23,51 | ||||
| 2025-08-14 | 13F | Bnp Paribas Arbitrage, Sa | 46 900 | 3 566 | ||||||
| 2025-08-05 | 13F | BEAM Asset Management, LLC | 38 298 | -10,38 | 2 912 | -1,05 | ||||
| 2025-07-23 | 13F | Venturi Wealth Management, LLC | 3 001 | 0,00 | 228 | 10,68 | ||||
| 2025-08-13 | 13F | Beacon Pointe Advisors, LLC | 37 278 | -10,75 | 2 835 | -1,49 | ||||
| 2025-08-08 | 13F | Citizens Financial Group Inc/ri | 157 316 | 13,25 | 11 962 | 25,01 | ||||
| 2025-08-13 | 13F | Transce3nd, LLC | 149 | -1,32 | 11 | 10,00 | ||||
| 2025-07-21 | 13F | Fairvoy Private Wealth, LLC | 4 051 | -4,50 | 308 | 5,48 | ||||
| 2025-07-09 | 13F | VisionPoint Advisory Group, LLC | 4 430 | 337 | ||||||
| 2025-07-09 | 13F | Fermata Advisors, LLC | 4 385 | 0,00 | 333 | 10,26 | ||||
| 2025-07-31 | 13F | Buckingham Strategic Partners | 3 135 166 | 2,37 | 238 376 | 12,98 | ||||
| 2025-08-11 | 13F | Kirtland Hills Capital Management, Llc | 11 615 | 0,00 | 883 | 10,93 | ||||
| 2025-08-12 | 13F | BlackRock, Inc. | 19 930 898 | 5,57 | 1 515 545 | 16,52 | ||||
| 2025-08-05 | 13F | AAFCPAs Wealth Management, LLC | 390 492 | 1,68 | 29 693 | 12,24 | ||||
| 2025-07-28 | 13F | Frazier Financial Advisors, LLC | 54 | 4 | ||||||
| 2025-08-15 | 13F | Binnacle Investments Inc | 13 884 | -2,12 | 1 056 | 7,98 | ||||
| 2025-07-16 | 13F | Beaumont Financial Advisors, LLC | 5 260 | 400 | ||||||
| 2025-04-24 | 13F | Wingate Wealth Advisors, Inc. | 0 | -100,00 | 0 | |||||
| 2025-08-07 | 13F | Allworth Financial LP | 154 091 | -24,45 | 11 717 | -18,81 | ||||
| 2025-04-10 | 13F | Amplius Wealth Advisors, LLC | 0 | -100,00 | 0 | -100,00 | ||||
| 2025-08-08 | 13F | Principal Financial Group Inc | 163 467 | 12 430 | ||||||
| 2025-08-18 | 13F/A | National Bank Of Canada /fi/ | 778 | 0,00 | 59 | 11,32 | ||||
| 2025-07-07 | 13F | Trust Co | 2 641 | -2,44 | 201 | 7,53 | ||||
| 2025-08-14 | 13F | Raymond James Financial Inc | 1 863 704 | 12,30 | 141 716 | 23,95 | ||||
| 2025-07-17 | 13F | Stockman Wealth Management, Inc. | 403 344 | -0,74 | 30 670 | 9,56 | ||||
| 2025-08-14 | 13F | Fmr Llc | 50 996 | 55,07 | 3 878 | 71,17 | ||||
| 2025-07-15 | 13F | Accurate Wealth Management, LLC | 7 350 | 0,80 | 562 | 15,20 | ||||
| 2025-07-17 | 13F | Crane Advisory, LLC | 116 089 | 8 796 | ||||||
| 2025-07-03 | 13F | Higgins & Schmidt Wealth Strategies LLC | 91 489 | 3,00 | 6 957 | 13,70 | ||||
| 2025-07-07 | 13F | Accelerate Investment Advisors LLC | 154 055 | 5,53 | 11 714 | 16,49 | ||||
| 2025-08-19 | 13F | Delos Wealth Advisors, LLC | 2 | 0 | ||||||
| 2025-06-23 | NP | ITDJ - iShares LifePath Target Date 2070 ETF | 10 057 | 37,00 | 720 | 45,75 | ||||
| 2025-06-27 | NP | INTL - Main International ETF | 700 650 | 50 181 | ||||||
| 2025-07-08 | 13F | Charis Legacy Partners, LLC | 3 710 | 0,00 | 282 | 10,59 | ||||
| 2025-04-25 | 13F | Uniting Wealth Partners, LLC | 0 | -100,00 | 0 | |||||
| 2025-08-11 | 13F | United Advisor Group, LLC | 22 112 | 173,26 | 1 681 | 201,80 | ||||
| 2025-08-07 | 13F | Everhart Financial Group, Inc. | 6 407 | 14,62 | 487 | 26,49 | ||||
| 2025-08-14 | 13F | Diversify Advisory Services, LLC | 99 661 | 471,39 | 7 760 | 521,22 | ||||
| 2025-06-23 | NP | ITDB - iShares LifePath Target Date 2030 ETF | 36 888 | 17,47 | 2 642 | 24,93 | ||||
| 2025-08-11 | 13F | Morling Financial Advisors, LLC | 1 | 0,00 | 0 | |||||
| 2025-07-15 | 13F | Main Street Group, LTD | 437 | 0,00 | 33 | 10,00 | ||||
| 2025-08-14 | 13F | Qube Research & Technologies Ltd | 462 | 23 000,00 | 35 | |||||
| 2025-08-14 | 13F | Mml Investors Services, Llc | 36 021 | -1,05 | 3 | 0,00 | ||||
| 2025-08-14 | 13F | Ancora Advisors, LLC | 382 | 1,60 | 29 | 16,00 | ||||
| 2025-08-11 | 13F | Portside Wealth Group, LLC | 3 618 | 0,00 | 275 | 10,44 | ||||
| 2025-08-19 | 13F | Advisory Services Network, LLC | 24 622 | -17,53 | 1 843 | -10,41 | ||||
| 2025-08-12 | 13F | Steward Partners Investment Advisory, Llc | 147 074 | 12,62 | 11 184 | 24,31 | ||||
| 2025-08-13 | 13F | Gateway Wealth Partners, LLC | 15 294 | 19,37 | 1 163 | 31,75 | ||||
| 2025-08-04 | 13F | One Day In July LLC | 8 111 | 0,00 | 617 | 10,39 | ||||
| 2025-07-18 | 13F | Dogwood Wealth Management LLC | 0 | -100,00 | 0 | |||||
| 2025-07-23 | 13F | Opulen Financial Group LLC | 5 115 | 1,73 | 389 | 12,14 | ||||
| 2025-07-01 | 13F | Kera Capital Partners, Inc. | 21 366 | 183,63 | 1 625 | 213,51 | ||||
| 2025-08-14 | 13F | Jane Street Group, Llc | 1 948 751 | 200,01 | 148 183 | 231,16 | ||||
| 2025-08-14 | 13F | Glen Eagle Advisors, LLC | 143 | 0,00 | 11 | 11,11 | ||||
| 2025-07-21 | 13F | Empirical Financial Services, LLC d.b.a. Empirical Wealth Management | 5 320 | 405 | ||||||
| 2025-07-25 | 13F | Tranquility Partners, LLC | 12 518 | 4,62 | 952 | 15,41 | ||||
| 2025-08-07 | 13F | Vise Technologies, Inc. | 3 926 | 299 | ||||||
| 2025-07-28 | 13F | Axxcess Wealth Management, Llc | 1 258 824 | 0,21 | 95 721 | 10,61 | ||||
| 2025-07-14 | 13F | Sowell Financial Services LLC | 4 125 | 35,96 | 314 | 49,76 | ||||
| 2025-08-07 | 13F | Howard Bailey Securities, Llc | 25 668 | -17,76 | 1 952 | -9,26 | ||||
| 2025-08-14 | 13F | Evercore Wealth Management, LLC | 3 491 | 0,00 | 265 | 10,42 | ||||
| 2025-08-14 | 13F | IHT Wealth Management, LLC | 10 429 | 3,39 | 793 | 9,38 | ||||
| 2025-08-11 | 13F | Summit Wealth Partners, LLC | 59 615 | 22,00 | 4 533 | 34,67 | ||||
| 2025-07-07 | 13F | Investors Research Corp | 200 | -62,05 | 15 | -58,33 | ||||
| 2025-07-15 | 13F | Family Wealth Partners, Llc | 124 468 | 2,55 | 9 465 | 13,19 | ||||
| 2025-07-24 | 13F | JNBA Financial Advisors | 0 | -100,00 | 0 | |||||
| 2025-08-14 | 13F | Royal Bank Of Canada | 849 753 | 29,06 | 64 615 | 42,46 | ||||
| 2025-08-07 | 13F | PFG Advisors | 11 001 | 836 | ||||||
| 2025-08-08 | 13F | Cetera Investment Advisers | 1 772 283 | 92,03 | 134 764 | 111,96 | ||||
| 2025-08-12 | 13F | Heritage Trust Co | 17 012 | 0,00 | 1 294 | 10,42 | ||||
| 2025-08-18 | 13F | Geneos Wealth Management Inc. | 172 375 | -2,89 | 13 107 | 7,19 | ||||
| 2025-07-23 | 13F | Joel Isaacson & Co., LLC | 3 751 | 1,27 | 285 | 11,76 | ||||
| 2025-07-31 | 13F | Red Wave Investments LLC | 78 288 | -0,14 | 5 953 | 10,22 | ||||
| 2025-04-14 | 13F | Greenspring Advisors, LLC | 18 722 | 0,00 | 1 290 | 6,79 | ||||
| 2025-07-07 | 13F | OMNI 360 Wealth, Inc. | 90 320 | -4,09 | 6 868 | 5,86 | ||||
| 2025-08-04 | 13F | AlphaStar Capital Management, LLC | 0 | -100,00 | 0 | |||||
| 2025-04-28 | 13F | Clear Creek Financial Management, LLC | 0 | -100,00 | 0 | |||||
| 2025-07-11 | 13F | SILVER OAK SECURITIES, Inc | 64 | 0,00 | 5 | 0,00 | ||||
| 2025-07-17 | 13F | Halbert Hargrove Global Advisors, Llc | 852 | 0,00 | 65 | 10,34 | ||||
| 2025-07-31 | 13F | Manuka Financial, LLC | 9 447 | 0,00 | 718 | 10,46 | ||||
| 2025-07-28 | 13F | Eq Wealth Advisors, Llc | 45 | 9,76 | 3 | 50,00 | ||||
| 2025-08-13 | 13F | Johnson Financial Group, Inc. | 85 | 6 | ||||||
| 2025-08-14 | 13F | Comerica Bank | 26 204 | 7,94 | 1 993 | 19,14 | ||||
| 2025-08-14 | 13F | Citadel Advisors Llc | Call | 0 | -100,00 | 0 | ||||
| 2025-08-12 | 13F | LPL Financial LLC | 1 082 413 | 0,68 | 82 307 | 11,13 | ||||
| 2025-08-26 | 13F/A | Thrivent Financial For Lutherans | 3 042 | 0 | ||||||
| 2025-08-11 | 13F | Strategic Wealth Partners, Ltd. | 254 | 19 | ||||||
| 2025-08-07 | 13F | FDx Advisors, Inc. | 220 047 | -3,15 | 17 | 6,67 | ||||
| 2025-08-13 | 13F | Baird Financial Group, Inc. | 55 180 | -54,30 | 4 196 | -49,56 | ||||
| 2025-08-19 | 13F | Asset Dedication, LLC | 35 925 | 3,46 | 2 732 | 14,17 | ||||
| 2025-08-14 | 13F | DRW Securities, LLC | 206 238 | 15 682 | ||||||
| 2025-05-15 | 13F/A | Orion Portfolio Solutions, LLC | 241 682 | 0,14 | 16 649 | 7,01 | ||||
| 2025-08-05 | 13F | Hi-Line Capital Management, LLC | 288 319 | 27,10 | 21 924 | 40,29 | ||||
| 2025-07-15 | 13F | Kraft Asset Management, Llc | 20 255 | -37,55 | 1 540 | -31,07 | ||||
| 2025-08-12 | 13F | Choate Investment Advisors | 5 494 | 0,00 | 418 | 10,32 | ||||
| 2025-08-11 | 13F | Empowered Funds, LLC | 1 313 439 | -8,52 | 99 874 | 0,98 | ||||
| 2025-07-11 | 13F | Rockwood Wealth Management, LLC | 7 689 | 585 | ||||||
| 2025-08-11 | 13F | Pineridge Advisors LLC | 810 | 1,00 | 62 | 10,91 | ||||
| 2025-08-11 | 13F | HighTower Advisors, LLC | 541 114 | 29,02 | 41 146 | 42,41 | ||||
| 2025-08-14 | 13F | Sunbelt Securities, Inc. | 3 708 | -1,98 | 239 | -8,08 | ||||
| 2025-07-23 | 13F | Matisse Capital | 9 632 | -0,84 | 732 | 9,42 | ||||
| 2025-08-14 | 13F | Integrated Wealth Concepts LLC | 64 776 | -19,69 | 4 926 | -11,36 | ||||
| 2025-07-28 | 13F | Copia Wealth Management | 9 | 0,00 | 1 | |||||
| 2025-08-11 | 13F | WPG Advisers, LLC | 3 253 | -2,98 | 247 | 7,39 | ||||
| 2025-08-08 | 13F | Nixon Peabody Trust Co | 1 154 156 | -3,72 | 87 762 | 6,28 | ||||
| 2025-08-14 | 13F | Icon Wealth Advisors, LLC | 1 597 | 5,48 | 121 | 16,35 | ||||
| 2025-08-08 | 13F | Emerald Investment Partners, Llc | 40 686 | 13,73 | 3 094 | 25,53 | ||||
| 2025-08-13 | 13F | EverSource Wealth Advisors, LLC | 198 | 112,90 | 15 | 150,00 | ||||
| 2025-06-23 | NP | IRTR - iShares LifePath Retirement ETF | 18 625 | 4,80 | 1 334 | 11,45 | ||||
| 2025-08-06 | 13F | Prospera Financial Services Inc | 5 132 | 6,03 | 390 | 17,12 | ||||
| 2025-08-06 | 13F | DDFG, Inc | 347 211 | -0,57 | 26 402 | 9,75 | ||||
| 2025-07-10 | 13F | Tompkins Financial Corp | 25 | 0,00 | 2 | 0,00 | ||||
| 2025-07-21 | 13F | Riverview Trust Co | 6 543 | 0,00 | 498 | 10,44 | ||||
| 2025-07-30 | 13F/A | Old Point Trust & Financial Services N A | 9 390 | 64,02 | 714 | 81,22 | ||||
| 2025-08-14 | 13F | Visionary Wealth Advisors | 6 038 | 18,49 | 459 | 30,77 | ||||
| 2025-08-12 | 13F | Change Path, LLC | 81 397 | -7,26 | 6 189 | 2,37 | ||||
| 2025-08-27 | 13F/A | Squarepoint Ops LLC | 10 078 | 766 | ||||||
| 2025-07-22 | 13F | Duncan Williams Asset Management, LLC | 79 928 | 6 078 | ||||||
| 2025-07-22 | 13F | Verus Wealth Management, Llc | 15 269 | 22,96 | 1 161 | 35,79 | ||||
| 2025-08-05 | 13F | Dravo Bay Llc | 63 731 | -0,87 | 5 189 | 17,19 | ||||
| 2025-07-29 | 13F | Kondo Wealth Advisors, Inc. | 249 086 | 3,83 | 18 906 | 14,40 | ||||
| 2025-07-11 | 13F | Deane Retirement Strategies, Inc. | 272 | 0,00 | 21 | 11,11 | ||||
| 2025-07-16 | 13F | Colton Groome Financial Advisors, Llc | 13 768 | 20,93 | 1 047 | 28,34 | ||||
| 2025-04-16 | 13F | Armbruster Capital Management, Inc. | 0 | -100,00 | 0 | |||||
| 2025-07-17 | 13F | Janney Montgomery Scott LLC | 18 766 | -17,02 | 1 | 0,00 | ||||
| 2025-07-25 | 13F | Atria Wealth Solutions, Inc. | 4 179 | -91,66 | 318 | -90,81 | ||||
| 2025-08-13 | 13F | Northwestern Mutual Wealth Management Co | 770 868 | 11,59 | 58 617 | 23,17 | ||||
| 2025-07-31 | 13F | Brighton Jones Llc | 6 439 | 0,00 | 490 | 10,38 | ||||
| 2025-07-08 | 13F | Peirce Capital Management, LLC | 165 433 | -6,08 | 12 579 | 3,67 | ||||
| 2025-08-08 | 13F | Financial Gravity Companies, Inc. | 241 | 18 | ||||||
| 2025-08-06 | 13F | Bensler, LLC | 4 110 | 0,15 | 313 | 10,64 | ||||
| 2025-06-25 | NP | RLGAX - RiverFront Asset Allocation Growth & Income Investor Shares | 93 500 | 6 696 | ||||||
| 2025-08-14 | 13F | Ieq Capital, Llc | 10 131 | 58,82 | 770 | 75,40 | ||||
| 2025-07-25 | 13F | Cypress Capital Group | 3 135 | 238 | ||||||
| 2025-08-06 | 13F | Regimen Wealth, Llc | 7 866 | -0,53 | 598 | 9,32 | ||||
| 2025-05-01 | 13F | Quest 10 Wealth Builders, Inc. | 9 264 | 0,01 | 638 | 6,87 | ||||
| 2025-08-14 | 13F | C M Bidwell & Associates Ltd | 14 540 | 0,00 | 1 106 | 10,39 | ||||
| 2025-07-23 | 13F | Gainplan LLC | 12 230 | -53,46 | 930 | -48,67 | ||||
| 2025-08-04 | 13F | Impact Partnership Wealth, LLC | 3 835 | -9,38 | 292 | 0,00 | ||||
| 2025-08-04 | 13F | Keybank National Association/oh | 3 325 | 253 | ||||||
| 2025-08-28 | NP | NDOW - Anydrus Advantage ETF | 16 796 | -38,35 | 1 277 | -31,93 | ||||
| 2025-07-22 | 13F | Merit Financial Group, LLC | 141 579 | 77,65 | 10 766 | 96,08 | ||||
| 2025-08-13 | 13F | Northern Trust Corp | 12 248 | 0,35 | 931 | 10,83 | ||||
| 2025-08-01 | 13F | Bessemer Group Inc | 2 086 440 | -42,17 | 159 | -36,29 | ||||
| 2025-08-15 | 13F | CI Private Wealth, LLC | 32 581 | 20,16 | 2 477 | 32,67 | ||||
| 2025-07-25 | 13F | Concurrent Investment Advisors, LLC | 3 651 | -21,82 | 278 | -13,71 | ||||
| 2025-08-06 | 13F | AE Wealth Management LLC | 305 267 | 0,19 | 23 212 | 10,60 | ||||
| 2025-07-18 | 13F | Trust Co Of Vermont | 19 | 0,00 | 1 | 0,00 | ||||
| 2025-07-16 | 13F | Squire Investment Management Company, LLC | 154 014 | 5,52 | 11 711 | 16,48 | ||||
| 2025-08-07 | 13F | Lakeridge Wealth Management LLC | 31 260 | 2,49 | 2 377 | 13,14 | ||||
| 2025-07-09 | 13F | Alesco Advisors Llc | 3 128 384 | 0,84 | 237 882 | 11,31 | ||||
| 2025-08-04 | 13F | Rede Wealth, LLC | 7 265 | 0,43 | 552 | 10,84 | ||||
| 2025-08-13 | 13F | Tranquilli Financial Advisor LLC | 80 262 | 37,81 | 6 103 | 52,12 | ||||
| 2025-08-01 | 13F | Y-Intercept (Hong Kong) Ltd | 0 | -100,00 | 0 | |||||
| 2025-08-04 | 13F | Hantz Financial Services, Inc. | 273 | 105,26 | 0 | |||||
| 2025-07-18 | 13F | Heritage Financial Services, LLC | 3 150 680 | -0,81 | 239 578 | 9,49 | ||||
| 2025-08-14 | 13F | Alliancebernstein L.p. | 41 682 | 3 169 | ||||||
| 2025-08-13 | 13F | Capital Analysts, Inc. | 8 546 | -4,23 | 1 | |||||
| 2025-07-16 | 13F | Traveka Wealth, LLC | 12 412 | -0,25 | 944 | 10,04 | ||||
| 2025-04-23 | 13F | Continuum Advisory, LLC | 0 | -100,00 | 0 | -100,00 | ||||
| 2025-07-22 | 13F | Mascoma Wealth Management LLC | 5 044 | 0,00 | 384 | 10,37 | ||||
| 2025-07-30 | 13F | Retirement Planning Group | 26 865 | -3,30 | 2 043 | 6,74 | ||||
| 2025-08-05 | 13F | Cherry Tree Wealth Management, LLC | 167 | 0,00 | 13 | 9,09 | ||||
| 2025-07-15 | 13F | Cordant, Inc. | 44 252 | 63,41 | 3 365 | 80,38 | ||||
| 2025-07-29 | 13F | Signature Estate & Investment Advisors Llc | 473 436 | -10,53 | 36 000 | -1,25 | ||||
| 2025-08-06 | 13F | Wedbush Securities Inc | 3 943 | 0 | ||||||
| 2025-08-08 | 13F | Avantax Advisory Services, Inc. | 72 847 | 3,15 | 5 539 | 13,85 | ||||
| 2025-04-21 | 13F | Nelson, Van Denburg & Campbell Wealth Management Group, LLC | 0 | -100,00 | 0 | |||||
| 2025-07-18 | 13F | Lynx Investment Advisory | 4 302 | -0,39 | 327 | 10,10 | ||||
| 2025-08-14 | 13F | Quantinno Capital Management LP | 11 551 | 189,28 | 878 | 219,27 | ||||
| 2025-07-17 | 13F | Sound Income Strategies, LLC | 358 | 51,05 | 27 | 68,75 | ||||
| 2025-07-14 | 13F | Brady Martz Wealth Solutions, LLC | 105 969 | 45,67 | 8 058 | 60,79 | ||||
| 2025-07-22 | 13F | Olistico Wealth, LLC | 30 | 0,00 | 2 | 0,00 | ||||
| 2025-08-01 | 13F | Corrado Advisors, Llc | 6 359 | 2,23 | 484 | 12,85 | ||||
| 2025-08-14 | 13F | Smartleaf Asset Management LLC | 1 486 | 68,48 | 113 | 83,61 | ||||
| 2025-05-16 | 13F | Coppell Advisory Solutions LLC | 0 | -100,00 | 0 | |||||
| 2025-08-12 | 13F | Proequities, Inc. | 0 | 0 | ||||||
| 2025-07-23 | 13F | Allegiance Financial Group Advisory Services LLC | 194 526 | 8,29 | 14 792 | 19,53 | ||||
| 2025-08-01 | 13F | First Command Advisory Services, Inc. | 1 180 131 | 15,68 | 89 737 | 27,69 | ||||
| 2025-08-14 | 13F | Eight 31 Financial Llc | 74 904 | -0,33 | 5 696 | 10,01 | ||||
| 2025-07-24 | 13F | Blair William & Co/il | 5 068 | 88,61 | 385 | 108,11 | ||||
| 2025-08-19 | 13F | Wealth Group, Ltd. | 0 | -100,00 | 0 | |||||
| 2025-08-14 | 13F | Great Valley Advisor Group, Inc. | 63 758 | 49,86 | 4 848 | 65,46 | ||||
| 2025-07-30 | 13F | Exencial Wealth Advisors, Llc | 75 639 | 9,38 | 5 752 | 20,72 | ||||
| 2025-07-09 | 13F | Pallas Capital Advisors LLC | 0 | -100,00 | 0 | |||||
| 2025-07-08 | 13F | FF Advisors,LLC | 49 324 | 0,00 | 3 751 | 4,87 | ||||
| 2025-07-24 | 13F | Robertson Stephens Wealth Management, LLC | 29 381 | 808,78 | 2 234 | 906,31 | ||||
| 2025-07-11 | 13F | First PREMIER Bank | 1 425 | 48,28 | 0 | |||||
| 2025-08-12 | 13F | Nemes Rush Group LLC | 1 204 | 7,50 | 92 | 18,18 | ||||
| 2025-07-29 | 13F | Salomon & Ludwin, LLC | 0 | -100,00 | 0 | |||||
| 2025-07-07 | 13F | Life Line Wealth Management Llc | 4 420 | 1,75 | 336 | 12,37 | ||||
| 2025-07-15 | 13F | Missouri Trust & Investment Co | 172 261 | -2,14 | 13 099 | 8,02 | ||||
| 2025-08-11 | 13F | Bank of Finland | 6 069 143 | 1,74 | 461 498 | 12,30 | ||||
| 2025-07-17 | 13F | CogentBlue Wealth Advisors, LLC | 83 698 | -7,97 | 6 364 | 1,58 | ||||
| 2025-08-08 | 13F | Gts Securities Llc | 4 866 | 370 | ||||||
| 2025-07-08 | 13F | Legacy Private Trust Co. | 125 349 | 16,12 | 9 532 | 28,17 | ||||
| 2025-08-14 | 13F | Citadel Advisors Llc | 37 372 | -0,13 | 2 842 | 10,20 | ||||
| 2025-07-31 | 13F | Resonant Capital Advisors, LLC | 102 959 | -0,18 | 7 829 | 10,19 | ||||
| 2025-08-14 | 13F | Vivaldi Capital Management, LLC | 31 557 | 2,24 | 2 400 | 12,84 | ||||
| 2025-08-11 | 13F | Alps Advisors Inc | 93 500 | 7 110 | ||||||
| 2025-07-23 | 13F | TriaGen Wealth Management LLC | 0 | -100,00 | 0 | |||||
| 2025-07-23 | 13F | HMV Wealth Advisors, LLC | 33 675 | -22,40 | 2 561 | -14,35 | ||||
| 2025-07-25 | 13F | Endowment Wealth Management, Inc. | 23 585 | 24,10 | 1 793 | 36,97 | ||||
| 2025-08-11 | 13F | Private Advisor Group, LLC | 55 192 | -0,19 | 4 197 | 10,16 | ||||
| 2025-07-31 | 13F | Leavell Investment Management, Inc. | 78 525 | 26,72 | 5 971 | 39,87 | ||||
| 2025-07-22 | 13F | Strid Group, LLC | 46 819 | -16,99 | 3 560 | -8,37 | ||||
| 2025-07-11 | 13F | Diversified Trust Co | 5 442 | 0,39 | 414 | 10,72 | ||||
| 2025-07-28 | 13F | Delap Wealth Advisory, Llc | 215 655 | -7,64 | 16 398 | 1,95 | ||||
| 2025-08-14 | 13F | Betterment LLC | 8 809 | 39,23 | 1 | |||||
| 2025-08-13 | 13F | SMART Wealth LLC | 3 576 | -0,22 | 272 | 10,16 | ||||
| 2025-08-01 | 13F | Rossby Financial, LCC | 4 556 | 5,68 | 346 | 13,07 | ||||
| 2025-08-01 | 13F | Unconventional Investor, LLC | 36 160 | 2 750 | ||||||
| 2025-08-14 | 13F | EP Wealth Advisors, Inc. | 20 046 | 49,79 | 1 524 | 65,47 | ||||
| 2025-07-14 | 13F | ABLE Financial Group, LLC | 176 537 | 9,45 | 13 424 | 20,80 | ||||
| 2025-07-15 | 13F | MCF Advisors LLC | 1 516 493 | -3,31 | 115 314 | 6,72 | ||||
| 2025-07-09 | 13F | Westmount Partners, LLC | 0 | -100,00 | 0 | |||||
| 2025-07-25 | 13F | G2 Capital Management, Llc / Oh | 14 362 | 59,72 | 1 092 | 76,41 | ||||
| 2025-07-17 | 13F | MBA Advisors LLC | 86 735 | 4,47 | 6 595 | 15,32 | ||||
| 2025-07-22 | 13F | Berger Financial Group, Inc | 9 350 | -1,19 | 711 | 9,06 | ||||
| 2025-07-16 | 13F | Vision Capital Management, Inc. | 249 816 | -0,58 | 18 996 | 9,75 | ||||
| 2025-08-13 | 13F | Townsquare Capital Llc | 0 | -100,00 | 0 | |||||
| 2025-08-12 | 13F | XTX Topco Ltd | 0 | -100,00 | 0 | |||||
| 2025-08-11 | 13F | Bradley Foster & Sargent Inc/ct | 14 249 | 1 083 | ||||||
| 2025-06-23 | NP | ITDF - iShares LifePath Target Date 2050 ETF | 81 309 | 7,18 | 5 823 | 14,02 | ||||
| 2025-08-14 | 13F | UBS Group AG | 1 516 141 | 10,88 | 115 287 | 22,39 | ||||
| 2025-07-07 | 13F | Avenue 1 Advisors, LLC | 370 984 | 5,88 | 28 210 | 16,87 | ||||
| 2025-08-01 | 13F | Solstein Capital, LLC | 85 745 | -36,62 | 6 520 | -30,04 | ||||
| 2025-08-13 | 13F | StoneX Group Inc. | 6 296 | -0,06 | 479 | 10,14 | ||||
| 2025-05-02 | 13F | Cullen/frost Bankers, Inc. | 0 | -100,00 | 0 | |||||
| 2025-05-16 | 13F/A | Kestra Investment Management, LLC | 0 | -100,00 | 0 | |||||
| 2025-08-14 | 13F | New England Asset Management Inc | 323 285 | 175,37 | 24 583 | 203,97 | ||||
| 2025-07-28 | 13F | Mutual Advisors, LLC | 7 136 | 15,54 | 552 | 25,80 | ||||
| 2025-08-08 | 13F/A | Sterling Capital Management LLC | 460 093 | -5,77 | 34 985 | 4,00 | ||||
| 2025-09-04 | 13F/A | Advisor Group Holdings, Inc. | 461 628 | 31,53 | 34 501 | 42,70 | ||||
| 2025-07-30 | 13F | Evermay Wealth Management Llc | 5 | 0,00 | 0 | |||||
| 2025-08-01 | 13F | Cobblestone Capital Advisors Llc /ny/ | 32 205 | -8,70 | 2 449 | 0,74 | ||||
| 2025-08-26 | NP | BlackRock Funds III - BlackRock LifePath Dynamic 2060 Fund Investor A Shares | 114 235 | 8 686 | ||||||
| 2025-08-14 | 13F | Moneta Group Investment Advisors Llc | 13 879 | 32,94 | 1 055 | 46,73 | ||||
| 2025-07-31 | 13F | Sage Mountain Advisors LLC | 5 876 | 90,41 | 447 | 110,38 | ||||
| 2025-08-12 | 13F | Global Retirement Partners, LLC | 1 531 | -47,85 | 116 | -38,62 | ||||
| 2025-08-04 | 13F | Assetmark, Inc | 1 593 378 | -3,52 | 121 160 | 6,49 | ||||
| 2025-05-14 | 13F | Van Hulzen Asset Management, LLC | 0 | -100,00 | 0 | |||||
| 2025-08-13 | 13F | Flow Traders U.s. Llc | 559 409 | 43 | ||||||
| 2025-07-22 | 13F | Old National Bancorp /in/ | 115 077 | 8 750 | ||||||
| 2025-08-01 | 13F | Financial Counselors Inc | 0 | -100,00 | 0 | |||||
| 2025-05-14 | 13F | Truvestments Capital Llc | 0 | -100,00 | 0 | |||||
| 2025-08-13 | 13F | Level Four Advisory Services, Llc | 8 516 | 4,47 | 648 | 15,33 | ||||
| 2025-08-08 | 13F | Pnc Financial Services Group, Inc. | 6 858 260 | 20,26 | 521 502 | 32,74 | ||||
| 2025-08-11 | 13F | Citigroup Inc | 4 322 535 | 2,93 | 328 686 | 13,61 | ||||
| 2025-08-14 | 13F | Horizon Investments, LLC | 4 834 866 | 32,53 | 367 643 | 46,29 | ||||
| 2025-05-15 | 13F | Glenmede Trust Co Na | 5 228 | 4,56 | 360 | 11,80 | ||||
| 2025-06-23 | NP | ITDH - iShares LifePath Target Date 2060 ETF | 34 560 | 12,36 | 2 475 | 19,57 | ||||
| 2025-07-11 | 13F | Kaufman Rossin Wealth, LLC | 80 329 | 10,55 | 6 108 | 22,04 | ||||
| 2025-06-25 | NP | REMIX - STANDPOINT MULTI-ASSET FUND Investor Class | 628 400 | -7,45 | 45 006 | -1,56 | ||||
| 2025-08-11 | 13F | Cornerstone Planning Group LLC | 0 | -100,00 | 0 | |||||
| 2025-07-29 | 13F | Private Trust Co Na | 2 195 | 34,83 | 167 | 48,21 | ||||
| 2025-08-14 | 13F | Goldman Sachs Group Inc | 3 112 | -30,91 | 237 | -23,87 | ||||
| 2025-07-30 | 13F | Probity Advisors, Inc. | 50 801 | -1,87 | 3 863 | 8,30 | ||||
| 2025-08-19 | 13F | Cape Investment Advisory, Inc. | 1 147 | -1,71 | 87 | 8,75 | ||||
| 2025-07-28 | 13F | IFG Advisors, LLC | 6 002 | -12,21 | 456 | -2,98 | ||||
| 2025-07-25 | 13F | Sequoia Financial Advisors, LLC | 4 474 | 10,93 | 340 | 22,74 | ||||
| 2025-08-25 | 13F/A | Neuberger Berman Group LLC | 7 219 | 549 | ||||||
| 2025-07-24 | 13F | rebel Financial LLC | 101 168 | 7 693 | ||||||
| 2025-07-25 | 13F | Envestnet Portfolio Solutions, Inc. | 421 084 | 45,18 | 32 019 | 60,26 | ||||
| 2025-07-30 | 13F | Brookstone Capital Management | 14 299 | 62,56 | 1 087 | 79,67 | ||||
| 2025-08-13 | 13F | Natixis Advisors, L.p. | 15 700 | 13,76 | 1 | |||||
| 2025-06-23 | NP | ITDE - iShares LifePath Target Date 2045 ETF | 78 975 | 8,09 | 5 656 | 14,98 | ||||
| 2025-08-14 | 13F | CoreCap Advisors, LLC | 347 | -34,77 | 26 | -27,78 | ||||
| 2025-08-14 | 13F | Modern Wealth Management, LLC | 203 009 | 9,27 | 15 436 | 26,82 | ||||
| 2025-07-09 | 13F | Defined Wealth Management, Llc | 39 712 | -1,10 | 3 020 | 9,15 | ||||
| 2025-07-29 | 13F | Chicago Partners Investment Group LLC | 14 487 | 0,73 | 1 129 | 8,35 | ||||
| 2025-08-06 | 13F | Vestmark Advisory Solutions, Inc. | 183 296 | 74,60 | 13 938 | 92,71 | ||||
| 2025-07-16 | 13F | Amarillo National Bank | 625 493 | -26,01 | 47 562 | -18,33 | ||||
| 2025-08-05 | 13F | Prosperity Consulting Group, LLC | 12 424 | 58,41 | 945 | 74,81 | ||||
| 2025-07-25 | NP | ABWAX - AB All Market Total Return Portfolio Class A | 29 216 | 2 198 | ||||||
| 2025-08-08 | 13F | Strategies Wealth Advisors, LLC | 15 458 | -19,38 | 1 175 | -10,98 | ||||
| 2025-08-14 | 13F | Old Mission Capital Llc | 1 503 051 | 548,09 | 114 292 | 615,35 | ||||
| 2025-06-23 | NP | ITDG - iShares LifePath Target Date 2055 ETF | 55 806 | -1,50 | 3 997 | 4,77 | ||||
| 2025-07-15 | 13F | Garrett Investment Advisors LLC | 16 543 | -1,14 | 1 258 | 9,11 | ||||
| 2025-08-07 | 13F | Apeiron RIA LLC | 5 097 | -26,94 | 388 | -19,37 | ||||
| 2025-08-14 | 13F | RMB Capital Management, LLC | 3 400 | 259 | ||||||
| 2025-08-13 | 13F | Cresset Asset Management, LLC | 37 932 | 162,36 | 2 884 | 189,56 | ||||
| 2025-08-01 | 13F | Petra Financial Advisors Inc | 3 298 | -9,84 | 251 | -0,79 | ||||
| 2025-07-15 | 13F | North Star Investment Management Corp. | 85 | 0,00 | 6 | 20,00 | ||||
| 2025-08-12 | 13F | Main Management LLC | 0 | -100,00 | 0 | |||||
| 2025-08-14 | 13F | Bank Of America Corp /de/ | 49 303 434 | 3,28 | 3 749 033 | 14,00 | ||||
| 2025-06-23 | NP | ITDI - iShares LifePath Target Date 2065 ETF | 32 389 | 5,32 | 2 320 | 12,03 | ||||
| 2025-08-14 | 13F | Financial Engines Advisors L.L.C. | 7 329 | -24,16 | 557 | -16,37 | ||||
| 2025-08-13 | 13F | GeoWealth Management, LLC | 11 702 | -6,29 | 890 | 3,37 | ||||
| 2025-06-23 | NP | AOK - iShares Core Conservative Allocation ETF | 781 387 | 3,99 | 55 963 | 10,61 | ||||
| 2025-07-21 | 13F | Keb Asset Management, Llc | 13 630 | 4,13 | 1 036 | 14,98 | ||||
| 2025-07-22 | 13F | Bank Hapoalim Bm | 122 400 | 0,00 | 8 | 0,00 | ||||
| 2025-07-24 | 13F | VanderPol Investments L.L.C. | 25 567 | -8,42 | 1 944 | 1,09 | ||||
| 2025-07-31 | 13F | LJI Wealth Management, LLC | 23 413 | 1,56 | 1 780 | 12,09 | ||||
| 2025-08-13 | 13F | Rsm Us Wealth Management Llc | 8 911 | 15,43 | 677 | 27,50 | ||||
| 2025-08-08 | 13F | Atlanta Consulting Group Advisors, LLC | 4 546 | 25,72 | 346 | 38,55 | ||||
| 2025-08-08 | 13F | Capital Investment Advisory Services, LLC | 560 | 0,00 | 43 | 10,53 | ||||
| 2025-08-13 | 13F | Cary Street Partners Financial Llc | 3 792 | 14,18 | 288 | 26,32 | ||||
| 2025-05-09 | 13F | Conquis Financial Llc | 0 | -100,00 | 0 | |||||
| 2025-07-30 | 13F | Arbor Investment Advisors, LLC | 58 446 | -13,54 | 4 444 | -4,55 | ||||
| 2025-08-14 | 13F | Susquehanna International Group, Llp | 174 660 | 13 281 | ||||||
| 2025-04-08 | 13F | Catalyst Private Wealth, Llc | 0 | -100,00 | 0 | -100,00 | ||||
| 2025-08-14 | 13F | Atomi Financial Group, Inc. | 10 707 | -44,86 | 814 | -39,12 | ||||
| 2025-08-05 | 13F | Plante Moran Financial Advisors, LLC | 0 | -100,00 | 0 | |||||
| 2025-08-11 | 13F | Johnson Financial Group, LLC | 4 022 | 306 | ||||||
| 2025-07-22 | 13F | Evensky & Katz LLC | 22 648 | -51,16 | 2 | -66,67 | ||||
| 2025-07-23 | 13F | Schrum Private Wealth Management LLC | 4 533 | -3,06 | 345 | 6,83 | ||||
| 2025-07-25 | 13F | Northwest Capital Management Inc | 1 074 | -69,11 | 82 | -66,11 | ||||
| 2025-08-14 | 13F | Hrt Financial Lp | 0 | -100,00 | 0 | |||||
| 2025-07-29 | 13F | Financial Synergies Wealth Advisors, Inc. | 20 286 | -0,76 | 1 543 | 9,52 | ||||
| 2025-08-11 | 13F | TD Waterhouse Canada Inc. | 932 | 16,50 | 71 | 27,27 | ||||
| 2025-07-31 | 13F | Glass Jacobson Investment Advisors llc | 6 927 | -2,24 | 527 | 15,35 | ||||
| 2025-08-06 | 13F | Golden State Wealth Management, LLC | 2 828 | 0,04 | 215 | 10,82 | ||||
| 2025-08-06 | 13F | Cloud Capital Management, LLC | 32 678 | 8,16 | 2 | 0,00 | ||||
| 2025-08-15 | 13F | ROSS\JOHNSON & Associates LLC | 55 | 12,24 | 4 | 33,33 | ||||
| 2025-08-05 | 13F | Carolinas Wealth Consulting Llc | 0 | -100,00 | 0 | -100,00 | ||||
| 2025-08-18 | 13F | N.E.W. Advisory Services LLC | 723 | -50,00 | 55 | -45,45 | ||||
| 2025-04-29 | 13F | Centennial Bank/AR/ | 0 | -100,00 | 0 | |||||
| 2025-08-13 | 13F | Parkworth Wealth Management, Inc. | 6 763 | 16,30 | 514 | 28,50 | ||||
| 2025-07-09 | 13F | Sapient Capital Llc | 11 528 | 0,00 | 877 | 10,33 | ||||
| 2025-08-12 | 13F | Gladstone Institutional Advisory LLC | 64 501 | -0,86 | 4 905 | 9,42 | ||||
| 2025-07-21 | 13F | New Century Financial Group, LLC | 0 | -100,00 | 0 | |||||
| 2025-08-07 | 13F | Cahill Financial Advisors Inc | 11 164 | 0,12 | 849 | 10,42 | ||||
| 2025-08-13 | 13F | Cerity Partners LLC | 492 107 | 504,86 | 37 420 | 567,72 | ||||
| 2025-08-14 | 13F | Colony Group, LLC | 3 079 266 | 2,23 | 234 147 | 12,83 | ||||
| 2025-08-14 | 13F | Tudor Investment Corp Et Al | 23 603 | 1 795 | ||||||
| 2025-07-16 | 13F | American National Bank | 20 272 | 110,03 | 1 541 | 132,08 | ||||
| 2025-05-05 | 13F | Creekmur Asset Management LLC | 0 | -100,00 | 0 | |||||
| 2025-07-07 | 13F | Rf&l Wealth Management, Llc | 28 944 | 4,19 | 2 201 | 15,00 | ||||
| 2025-08-11 | 13F | HHM Wealth Advisors, LLC | 785 | 0,00 | 60 | 9,26 | ||||
| 2025-08-14 | 13F | Financial Advisory Service, Inc. | 4 553 | 8,10 | 346 | 19,31 | ||||
| 2025-07-25 | 13F | Cwm, Llc | 35 534 | -5,39 | 3 | 0,00 | ||||
| 2025-08-14 | 13F | Mercer Global Advisors Inc /adv | 32 958 | 108,61 | 2 506 | 130,33 | ||||
| 2025-07-30 | 13F | Crewe Advisors LLC | 2 327 | 0,00 | 177 | 10,00 | ||||
| 2025-08-11 | 13F | United Capital Financial Advisers, Llc | 40 340 | -1,32 | 3 067 | 8,91 | ||||
| 2025-07-23 | 13F | Valmark Advisers, Inc. | 3 767 | 0,03 | 286 | 10,42 | ||||
| 2025-07-28 | 13F | Ritholtz Wealth Management | 9 074 | 7,07 | 690 | 18,18 | ||||
| 2025-07-17 | 13F | HB Wealth Management, LLC | 0 | -100,00 | 0 | |||||
| 2025-08-14 | 13F/A | Rockefeller Capital Management L.P. | 25 233 | 1 919 | ||||||
| 2025-04-14 | 13F | Wynn Capital, LLC | 0 | -100,00 | 0 | |||||
| 2025-07-17 | 13F | LexAurum Advisors, LLC | 6 975 | 8,76 | 530 | 20,18 | ||||
| 2025-07-17 | 13F | Northwest Wealth Management, Llc | 192 453 | -0,25 | 14 634 | 10,11 | ||||
| 2025-07-23 | 13F | Elevate Wealth Advisory, Inc | 68 286 | -13,40 | 5 192 | -4,42 | ||||
| 2025-05-08 | 13F | Main Street Financial Solutions, LLC | 0 | -100,00 | 0 | |||||
| 2025-07-24 | 13F | Accredited Investor Services, Llc | 3 095 | 0,00 | 235 | 10,33 | ||||
| 2025-08-07 | 13F | Cascade Financial Partners, LLC | 57 618 | 0,00 | 4 381 | 10,38 | ||||
| 2025-07-21 | 13F | Ascent Group, LLC | 10 634 | 177,58 | 809 | 207,22 | ||||
| 2025-08-08 | 13F | Creative Planning | 17 982 959 | 1,60 | 1 367 424 | 12,14 | ||||
| 2025-07-09 | 13F | Sterling Manor Financial, LLC | 104 357 | -1,22 | 7 935 | 9,03 | ||||
| 2025-08-26 | NP | BlackRock Funds III - BlackRock LifePath Dynamic 2065 Fund Investor C Shares | 52 358 | 3 981 | ||||||
| 2025-07-10 | 13F | Stewardship Advisors, LLC | 14 737 | 5,72 | 1 121 | 16,67 | ||||
| 2025-07-24 | 13F | Capital Advisors, Ltd. LLC | 2 796 | 0,72 | 0 | |||||
| 2025-07-22 | 13F | Simplicity Wealth,LLC | 122 195 | 6,44 | 9 292 | 17,47 | ||||
| 2025-07-11 | 13F | Hilltop Wealth Advisors, Llc | 33 725 | 18,11 | 2 564 | 30,35 | ||||
| 2025-07-14 | 13F | Ridgewood Investments LLC | 0 | -100,00 | 0 | |||||
| 2025-07-16 | 13F | St Germain D J Co Inc | 0 | -100,00 | 0 | |||||
| 2025-07-18 | 13F | Arcadia Wealth Management, LLC | 5 427 | -4,71 | 413 | 5,10 | ||||
| 2025-07-24 | 13F | Ronald Blue Trust, Inc. | 335 | 1 575,00 | 25 | 2 400,00 | ||||
| 2025-08-11 | 13F | Bell Investment Advisors, Inc | 3 856 | -9,04 | 293 | 0,34 | ||||
| 2025-05-02 | 13F | Capital A Wealth Management, LLC | 54 | 0,00 | 4 | 0,00 | ||||
| 2025-07-29 | 13F | Riverbend Wealth Management, LLC | 3 437 | 261 | ||||||
| 2025-08-26 | NP | BlackRock Funds III - BlackRock LifePath Dynamic 2070 Fund Class R | 4 048 | 308 | ||||||
| 2025-08-11 | 13F | Slagle Financial, LLC | 4 162 | -3,19 | 316 | 6,76 | ||||
| 2025-08-12 | 13F | Archer Investment Corp | 836 | 134,83 | 64 | 162,50 | ||||
| 2025-05-12 | 13F | Aveo Capital Partners, LLC | 0 | -100,00 | 0 | |||||
| 2025-08-06 | 13F | Csenge Advisory Group | 28 606 | -4,75 | 2 152 | 4,47 | ||||
| 2025-07-25 | 13F | R. W. Roge & Company, Inc. | 66 892 | -1,66 | 5 | 25,00 | ||||
| 2025-07-23 | 13F | Bellevue Asset Management, Llc | 66 | 5 | ||||||
| 2025-07-28 | 13F | Courier Capital Llc | 10 704 | 814 | ||||||
| 2025-08-14 | 13F | Benjamin Edwards Inc | 0 | -100,00 | 0 | |||||
| 2025-07-30 | 13F | LifeWealth Investments, LLC | 2 779 | 211 | ||||||
| 2025-08-06 | 13F | Paladin Advisory Group, LLC | 511 | 0,00 | 39 | 8,57 | ||||
| 2025-08-14 | 13F | Manufacturers Life Insurance Company, The | 21 634 | 0,00 | 1 645 | 10,40 | ||||
| 2025-08-12 | 13F | Rock Creek Group, LP | 723 850 | -10,40 | 55 042 | -0,51 | ||||
| 2025-08-14 | 13F | LifePlan Investment Advisors, Inc. | 18 138 | -8,64 | 1 379 | 0,88 | ||||
| 2025-08-06 | 13F | Legacy Wealth Managment, LLC/ID | 430 | -1,15 | 33 | 10,34 | ||||
| 2025-08-12 | 13F | MAI Capital Management | 9 893 | 5,24 | 752 | 16,23 | ||||
| 2025-07-14 | 13F | Park Avenue Securities Llc | 23 560 | 0,64 | 2 | 0,00 | ||||
| 2025-08-15 | 13F | Captrust Financial Advisors | 739 882 | -1,44 | 56 261 | 8,78 | ||||
| 2025-08-04 | 13F | Human Investing LLC | 12 346 | 42,53 | 938 | 57,38 | ||||
| 2025-08-07 | 13F | Resources Investment Advisors, LLC. | 4 259 | -40,67 | 324 | -34,62 | ||||
| 2025-04-30 | 13F | BCJ Capital Management, LLC | 0 | -100,00 | 0 | |||||
| 2025-08-14 | 13F | Financial Advisors Network, Inc. | 207 792 | 6,90 | 15 801 | 17,99 | ||||
| 2025-08-07 | 13F | Hughes Financial Services, LLC | 0 | -100,00 | 0 | |||||
| 2025-08-11 | 13F | Kingdom Financial Group LLC. | 0 | -100,00 | 0 | |||||
| 2025-08-13 | 13F | Summit Financial, LLC | 32 363 | 2 461 | ||||||
| 2025-08-13 | 13F | Strategic Financial Planning, Inc. | 19 622 | -4,15 | 1 492 | 5,82 | ||||
| 2025-08-04 | 13F | Mayflower Financial Advisors, LLC | 4 685 | 0,00 | 356 | 10,56 | ||||
| 2025-08-12 | 13F | OneAscent Financial Services LLC | 32 991 | 3 | ||||||
| 2025-07-17 | 13F | Claris Advisors, Llc / Mo / | 30 473 | 3,11 | 2 317 | 13,80 | ||||
| 2025-07-01 | 13F | First National Bank Sioux Falls | 243 310 | 1,35 | 18 501 | 11,87 | ||||
| 2025-07-24 | 13F | Jfs Wealth Advisors, Llc | 51 154 | 4 065,64 | 3 890 | 4 529,76 | ||||
| 2025-08-11 | 13F | Atlantic Private Wealth, LLC | 0 | -100,00 | 0 | |||||
| 2025-07-17 | 13F | Norris Perne & French Llp/mi | 83 881 | 1,66 | 6 378 | 12,21 | ||||
| 2025-07-10 | 13F | Exchange Traded Concepts, Llc | 436 348 | 33 180 | ||||||
| 2025-04-10 | 13F | Bremer Bank National Association | 116 913 | -4,97 | 8 054 | 1,55 | ||||
| 2025-07-09 | 13F | Riversedge Advisors, Llc | 598 627 | 16,94 | 45 520 | 29,08 | ||||
| 2025-08-01 | 13F | Envestnet Asset Management Inc | 3 672 833 | 7,62 | 279 282 | 18,79 | ||||
| 2025-07-14 | 13F | Abound Wealth Management | 38 | 3 | ||||||
| 2025-07-03 | 13F | Garde Capital, Inc. | 536 | -39,09 | 41 | -33,33 | ||||
| 2025-07-23 | 13F | Prime Capital Investment Advisors, LLC | 4 414 | -17,92 | 336 | -9,46 | ||||
| 2025-07-30 | 13F | Castle Wealth Management Llc | 3 222 | 0,00 | 245 | 10,86 | ||||
| 2025-07-18 | 13F | B.O.S.S. Retirement Advisors, LLC | 17 238 | -9,18 | 1 311 | 0,23 | ||||
| 2025-08-04 | 13F | Savvy Advisors, Inc. | 20 163 | 131,97 | 1 533 | 156,35 | ||||
| 2025-08-05 | 13F | Huntington National Bank | 41 | 5,26 | ||||||
| 2025-07-14 | 13F | Capstone Wealth Management, LLC | 5 423 | 3,57 | 412 | 14,44 | ||||
| 2025-08-14 | 13F | Balanced Rock Investment Advisor | 7 229 | -1,97 | 550 | 8,28 | ||||
| 2025-07-21 | 13F | Ameriflex Group, Inc. | 43 | -91,21 | 3 | -90,91 | ||||
| 2025-07-31 | 13F | Cambridge Investment Research Advisors, Inc. | 430 786 | 6,51 | 33 | 18,52 | ||||
| 2025-07-28 | 13F | Fairman Group, LLC | 3 258 | 0,87 | 248 | 18,75 | ||||
| 2025-08-12 | 13F | NFP Retirement, Inc. | 710 612 | -11,66 | 54 035 | -2,50 | ||||
| 2025-08-11 | 13F | Wealthspire Advisors, LLC | 9 709 | 738 | ||||||
| 2025-06-23 | NP | AOM - iShares Core Moderate Allocation ETF | 2 412 318 | 2,44 | 172 770 | 8,97 | ||||
| 2025-08-14 | 13F | Graney & King, LLC | 11 149 | 1,40 | 848 | 11,89 | ||||
| 2025-07-21 | 13F | F&V Capital Management, LLC | 17 110 | 0,00 | 1 | 0,00 | ||||
| 2025-07-23 | 13F | Watershed Private Wealth Llc | 4 738 | -13,56 | 360 | -4,51 | ||||
| 2025-08-06 | 13F | Ethos Financial Group, LLC | 2 780 | 211 | ||||||
| 2025-08-27 | 13F/A | Brinker Capital Investments, LLC | 194 289 | -19,61 | 14 774 | -11,27 | ||||
| 2025-07-25 | 13F | NorthRock Partners, LLC | 1 962 | -23,27 | 149 | -15,34 | ||||
| 2025-08-11 | 13F | Nations Financial Group Inc, /ia/ /adv | 6 591 | 11,88 | 501 | 23,70 | ||||
| 2025-07-25 | 13F | Inman Jager Wealth Management, LLC | 29 533 | 21,98 | 2 246 | 34,67 | ||||
| 2025-08-14 | 13F | Wells Fargo & Company/mn | 507 966 | 5,46 | 38 626 | 16,40 | ||||
| 2025-08-14 | 13F | Prudent Investors Network | 250 371 | 1,66 | 19 038 | 12,21 | ||||
| 2025-08-06 | 13F | Founders Financial Securities Llc | 304 963 | 4,72 | 23 189 | 11,42 | ||||
| 2025-08-12 | 13F | J.w. Cole Advisors, Inc. | 22 928 | 102,58 | 1 743 | 123,75 | ||||
| 2025-05-08 | 13F | Gs Investments, Inc. | 0 | -100,00 | 0 | |||||
| 2025-07-22 | 13F | Global Strategic Investment Solutions, LLC | 234 146 | -4,89 | 17 804 | 4,98 | ||||
| 2025-08-05 | 13F | Bank Of Montreal /can/ | 2 649 | -46,55 | 201 | -41,06 | ||||
| 2025-07-31 | 13F | Hanlon Investment Management, Inc. | 0 | -100,00 | 0 | |||||
| 2025-07-24 | NP | ARAAX - Horizon Active Risk Assist Fund Advisor Class | 2 123 244 | 507,08 | 159 710 | 698,35 | ||||
| 2025-08-05 | 13F | Beckerman Institutional, LLC | 97 283 | -1,56 | 7 | 16,67 | ||||
| 2025-08-14 | 13F | Compass Wealth Management, LLC/GA | 64 554 | 4 909 | ||||||
| 2025-04-25 | 13F | Mather Group, Llc. | 0 | -100,00 | 0 | |||||
| 2025-07-15 | 13F | Oak Root LLC | 199 151 | 10,51 | 15 143 | 21,98 | ||||
| 2025-08-07 | 13F | Resolute Advisors LLC | 35 402 | 1,73 | 2 692 | 12,27 | ||||
| 2025-08-12 | 13F | North Star Asset Management Inc | 3 744 | 285 | ||||||
| 2025-07-25 | 13F | Hemington Wealth Management | 61 543 | -4,11 | 5 | 0,00 | ||||
| 2025-07-21 | 13F | Ameritas Advisory Services, LLC | 4 270 | -46,65 | 325 | -39,33 | ||||
| 2025-08-14 | 13F | Ameriprise Financial Inc | 6 852 208 | 33,43 | 521 039 | 49,09 | ||||
| 2025-07-22 | 13F | MBL Wealth, LLC | 271 254 | 2,99 | 20 626 | 13,68 | ||||
| 2025-08-25 | NP | MML Series Investment Fund II - MML iShares 80/20 Allocation Fund Service Class I | 234 710 | 7,47 | 17 847 | 18,62 | ||||
| 2025-08-13 | 13F | Empire Financial Management Company, LLC | 12 399 | -1,13 | 943 | 9,15 | ||||
| 2025-07-23 | 13F | Values Added Financial LLC | 0 | -100,00 | 0 | |||||
| 2025-08-07 | 13F | Midwest Trust Co | 73 275 | 5 572 | ||||||
| 2025-08-14 | 13F | Wiley Bros.-aintree Capital, Llc | 213 693 | 19,78 | 16 272 | 31,61 | ||||
| 2025-07-22 | 13F | Kickstand Ventures, Llc. | 79 928 | -8,45 | 6 078 | 1,05 | ||||
| 2025-04-03 | 13F | First Hawaiian Bank | 10 760 | 0,00 | 741 | 6,93 | ||||
| 2025-08-08 | 13F | C V Starr & Co Inc | 378 787 | 28 803 | ||||||
| 2025-05-12 | 13F | Meitav Dash Investments Ltd | 0 | -100,00 | 0 | |||||
| 2025-05-12 | 13F | Independent Advisor Alliance | 0 | -100,00 | 0 | |||||
| 2025-07-30 | 13F | Securian Asset Management, Inc | 205 529 | 0,00 | 15 628 | 10,38 | ||||
| 2025-07-14 | 13F | Friday Financial | 108 109 | 10,43 | 8 221 | 21,20 | ||||
| 2025-07-30 | 13F | TFB Advisors LLC | 23 044 | -8,91 | 1 752 | 0,57 | ||||
| 2025-07-22 | 13F | Clarius Group, LLC | 1 419 721 | -1,53 | 107 956 | 8,69 | ||||
| 2025-06-23 | NP | AOA - iShares Core Aggressive Allocation ETF | 7 169 640 | 2,58 | 513 490 | 9,11 | ||||
| 2025-07-31 | 13F | City State Bank | 5 377 | 10,25 | 409 | 21,79 | ||||
| 2025-07-15 | 13F | Fortitude Family Office, LLC | 215 309 | -26,21 | 16 372 | -18,56 | ||||
| 2025-07-17 | 13F | Lauterbach Financial Advisors, LLC | 32 512 | 1,56 | 2 472 | 12,11 | ||||
| 2025-07-24 | 13F | Us Bancorp \de\ | 11 805 | 16,62 | 898 | 28,69 | ||||
| 2025-08-11 | 13F | Brown Wealth Management, Llc | 89 159 | 6,88 | 6 780 | 17,98 | ||||
| 2025-05-07 | 13F | Foundations Investment Advisors, LLC | 0 | -100,00 | 0 | -100,00 | ||||
| 2025-07-11 | 13F | Farther Finance Advisors, LLC | 2 582 | 260,11 | 196 | 300,00 | ||||
| 2025-07-28 | 13F | Sagespring Wealth Partners, Llc | 138 065 | 15,01 | 10 498 | 26,96 | ||||
| 2025-07-15 | 13F | Maseco Llp | 3 467 | 264 | ||||||
| 2025-07-23 | 13F | Sachetta, LLC | 0 | -100,00 | 0 | |||||
| 2025-07-21 | 13F | Cape Cod Five Cents Savings Bank | 162 382 | 0,00 | 11 502 | 0,00 | ||||
| 2025-07-23 | 13F | Columbus Macro, LLC | 268 391 | 2,08 | 20 408 | 12,68 | ||||
| 2025-08-26 | NP | LPHAX - BlackRock LifePath Dynamic 2045 Fund Investor A Shares | 125 381 | 9 534 | ||||||
| 2025-08-04 | 13F | Family Wealth Group, LLC | 35 711 | -4,74 | 2 715 | 5,15 | ||||
| 2025-07-22 | 13F | Wealthcare Advisory Partners LLC | 0 | -100,00 | 0 | |||||
| 2025-08-06 | 13F | Nicholas Hoffman & Company, LLC. | 10 546 | 0,56 | 802 | 10,94 | ||||
| 2025-08-12 | 13F | O'shaughnessy Asset Management, Llc | 22 540 | 4,29 | 1 714 | 15,12 | ||||
| 2025-08-25 | NP | MML Series Investment Fund II - MML iShares 60/40 Allocation Fund Service Class I | 112 112 | 9,41 | 8 525 | 20,75 | ||||
| 2025-07-10 | 13F | Secure Asset Management, LLC | 13 433 | 1 021 | ||||||
| 2025-08-14 | 13F | Mariner, LLC | 858 477 | 2,85 | 65 278 | 13,52 | ||||
| 2025-08-06 | 13F | Decker Retirement Planning Inc. | 10 | 0,00 | 1 | |||||
| 2025-08-14 | 13F | Sei Investments Co | 11 053 627 | 5,02 | 840 517 | 15,92 | ||||
| 2025-08-13 | 13F | Harfst & Associates, Inc. | 2 975 | 226 | ||||||
| 2025-08-12 | 13F | Armor Investment Advisors, LLC | 846 | 0,00 | 64 | 10,34 | ||||
| 2025-08-18 | 13F | Second Line Capital, LLC | 4 058 | 1,73 | 309 | 12,41 | ||||
| 2025-07-14 | 13F | Foster Group, Inc. | 759 281 | 4,02 | 57 736 | 14,81 | ||||
| 2025-08-07 | 13F | New England Private Wealth Advisors LLC | 13 413 | 1,48 | 1 013 | 11,21 | ||||
| 2025-07-15 | 13F | Verum Partners LLC | 16 490 | -1,29 | 1 254 | 8,96 | ||||
| 2025-08-08 | 13F | Starr Indemnity & Liability Co | 606 060 | 46 085 | ||||||
| 2025-07-25 | 13F | JustInvest LLC | 7 371 | -11,58 | 560 | -2,44 | ||||
| 2025-08-14 | 13F | Stifel Financial Corp | 28 006 | -0,27 | 2 130 | 10,08 | ||||
| 2025-08-12 | 13F | Park Square Financial Group, LLC | 64 | -4,48 | 5 | 0,00 | ||||
| 2025-08-12 | 13F | Running Point Capital Advisors, LLC | 137 301 | 2,00 | 10 440 | 12,60 | ||||
| 2025-05-12 | 13F | Ccm Investment Group, Llc | 1 435 325 | 1,39 | 99 655 | 9,19 | ||||
| 2025-08-01 | 13F | FSA Advisors, Inc. | 3 483 | -13,85 | 265 | -5,04 | ||||
| 2025-07-16 | 13F | Diversified Enterprises, LLC | 26 005 | -13,57 | 1 977 | -4,58 | ||||
| 2025-07-24 | 13F | CarsonAllaria Wealth Management, Ltd. | 140 679 | 3,22 | 10 697 | 13,93 | ||||
| 2025-07-10 | 13F | Wedmont Private Capital | 92 292 | 1,36 | 7 051 | 15,95 | ||||
| 2025-07-29 | 13F | BXM Wealth LLC | 5 700 | 0,00 | 433 | 10,46 | ||||
| 2025-07-17 | 13F | Kavar Capital Partners Group, Llc | 6 784 | 18,37 | 516 | 30,71 | ||||
| 2025-08-04 | 13F | Pensionmark Financial Group, Llc | 112 673 | 2,87 | 8 568 | 13,55 | ||||
| 2025-07-22 | 13F | Relyea Zuckerberg Hanson LLC | 199 086 | 15,30 | 15 138 | 27,27 | ||||
| 2025-08-07 | 13F | CENTRAL TRUST Co | 4 411 | 12,73 | 335 | 24,54 | ||||
| 2025-08-05 | 13F | Lord & Richards Wealth Management, LLC | 0 | -100,00 | 0 | |||||
| 2025-08-26 | NP | LPRFX - BlackRock Lifepath Dynamic 2050 Fund Investor A Shares | 266 609 | 20 273 | ||||||
| 2025-08-01 | 13F | Logan Capital Management Inc | 1 | 0,00 | 0 | |||||
| 2025-08-11 | 13F | Arrow Financial Corp | 508 382 | 12,18 | 38 657 | 23,83 | ||||
| 2025-07-14 | 13F | E&G Advisors, LP | 11 888 | 13,78 | 904 | 25,59 | ||||
| 2025-08-05 | 13F | Crestwood Advisors Group LLC | 9 460 | 719 | ||||||
| 2025-08-13 | 13F | Smith, Moore & Co. | 24 441 | 0,00 | 1 858 | 10,40 | ||||
| 2025-08-13 | 13F | Fisher Asset Management, LLC | 3 862 | 294 | ||||||
| 2025-05-09 | 13F | Scotia Capital Inc. | 0 | -100,00 | 0 | |||||
| 2025-08-07 | 13F | Kestra Private Wealth Services, Llc | 46 104 | 57,74 | 3 506 | 74,12 | ||||
| 2025-08-06 | 13F | Savant Capital, LLC | 6 142 | -3,64 | 467 | 6,38 | ||||
| 2025-08-14 | 13F | FC Advisory LLC | 29 732 | -7,83 | 2 261 | 1,71 | ||||
| 2025-07-31 | 13F/A | Avion Wealth | 835 | 0,00 | 0 | |||||
| 2025-08-13 | 13F | Twin Peaks Wealth Advisors, LLC | 63 | 5 | ||||||
| 2025-04-23 | 13F | Western Wealth Management, LLC | 0 | -100,00 | 0 | -100,00 | ||||
| 2025-07-30 | 13F | Blume Capital Management, Inc. | 277 | 21 | ||||||
| 2025-07-24 | 13F | WMG Financial Advisors, LLC | 5 207 | -1,87 | 396 | 8,22 | ||||
| 2025-08-11 | 13F | GW&K Investment Management, LLC | 50 998 | 119,74 | 4 | 200,00 | ||||
| 2025-07-28 | 13F | Harbour Investments, Inc. | 14 933 | 30,10 | 1 136 | 43,67 | ||||
| 2025-07-28 | 13F | Cornerstone Wealth Group, LLC | 277 639 | 15,53 | 21 112 | 27,52 | ||||
| 2025-07-16 | 13F | Perigon Wealth Management, LLC | 95 259 | -2,11 | 7 243 | 8,06 | ||||
| 2025-08-14 | 13F | Glenmede Investment Management, LP | 5 228 | 398 | ||||||
| 2025-05-02 | 13F | Napatree Capital Llc | 14 210 | 5,80 | 979 | 13,06 | ||||
| 2025-05-13 | 13F | Quadrature Capital Ltd | 0 | -100,00 | 0 | |||||
| 2025-07-29 | 13F | Aire Advisors, Llc | 3 208 | 0,00 | 244 | 9,95 | ||||
| 2025-07-30 | 13F | Chokshi & Queen Wealth Advisors, Inc | 25 678 | 0,00 | 1 953 | 10,41 | ||||
| 2025-08-11 | 13F | Aptus Capital Advisors, LLC | 778 922 | -65,73 | 59 229 | -62,17 | ||||
| 2025-08-13 | 13F | Kayne Anderson Rudnick Investment Management Llc | 1 240 | 0,00 | 94 | 10,59 | ||||
| 2025-07-22 | 13F | Valpey Financial Services, LLC | 10 761 | 818 | ||||||
| 2025-08-14 | 13F | Mpwm Advisory Solutions, Llc | 0 | -100,00 | 0 | |||||
| 2025-08-06 | 13F | Legacy Investment Solutions, LLC | 430 | -12,42 | 33 | -3,03 | ||||
| 2025-07-31 | 13F | Whipplewood Advisors, LLC | 44 | -30,16 | 3 | 0,00 | ||||
| 2025-08-14 | 13F | NorthLanding Financial Partners, LLC | 4 070 | -0,02 | 310 | 10,36 | ||||
| 2025-07-30 | 13F | Jackson Thornton Asset Management, Llc | 11 231 | -14,53 | 852 | -5,44 | ||||
| 2025-08-12 | 13F | CIBC Private Wealth Group, LLC | 217 | 10 750,00 | 17 | |||||
| 2025-08-15 | 13F | Kestra Advisory Services, LLC | 59 235 | 28,61 | 4 504 | 41,99 | ||||
| 2025-07-23 | 13F | Litman Gregory Asset Management LLC | 1 187 722 | 3,21 | 90 314 | 13,92 | ||||
| 2025-07-25 | 13F | We Are One Seven, LLC | 3 748 | 0,00 | 285 | 10,08 | ||||
| 2025-08-11 | 13F | Rothschild Investment Llc | 248 | 0,00 | 19 | 5,88 | ||||
| 2025-04-01 | 13F | Oliver Lagore Vanvalin Investment Group | 0 | -100,00 | 0 | |||||
| 2025-07-17 | 13F | Heritage Investment Group, Inc. | 137 000 | 1,66 | 10 417 | 12,22 | ||||
| 2025-07-17 | 13F | Fifth Third Securities, Inc. | 3 795 | 289 | ||||||
| 2025-08-04 | 13F | Spire Wealth Management | 1 040 | -81,68 | 79 | -79,80 | ||||
| 2025-07-15 | 13F | James J. Burns & Company, LLC | 7 560 | 11,83 | 575 | 23,44 | ||||
| 2025-07-25 | 13F | RHS Financial, LLC | 16 487 | -22,41 | 1 254 | -14,35 | ||||
| 2025-08-06 | 13F | First Horizon Advisors, Inc. | 10 060 | 0,77 | 765 | 11,35 | ||||
| 2025-07-29 | 13F | Angeles Wealth Management, Llc | 13 983 | 0,00 | 1 063 | 10,38 | ||||
| 2025-08-13 | 13F | Baltimore-Washington Financial Advisors, Inc. | 128 871 | 16,13 | 9 799 | 28,18 | ||||
| 2025-07-18 | 13F | Parkwoods Wealth Partners, LLC | 3 298 | 0,00 | 251 | 10,13 | ||||
| 2025-07-31 | 13F | Opes Wealth Management LLC | 3 125 | 0,03 | 238 | 10,23 | ||||
| 2025-08-13 | 13F | Summit Wealth Group Llc / Co | 10 251 | 779 | ||||||
| 2025-05-15 | 13F | National Wealth Management Group, LLC | 38 762 | 7,15 | 2 670 | 14,49 | ||||
| 2025-07-28 | 13F | Davidson Investment Advisors | 250 920 | -83,85 | 19 080 | -82,18 | ||||
| 2025-07-31 | 13F | Hoge Financial Services, Llc | 31 573 | 1,01 | 2 401 | 11,47 | ||||
| 2025-08-13 | 13F | SageView Advisory Group, LLC | 12 207 | -7,92 | 930 | 1,86 | ||||
| 2025-08-13 | 13F | Standpoint Asset Management, LLC | 575 800 | -15,20 | 43 784 | -6,40 | ||||
| 2025-07-14 | 13F | AdvisorNet Financial, Inc | 166 709 | 31 897,89 | 12 677 | 36 117,14 | ||||
| 2025-08-08 | 13F | Larson Financial Group LLC | 80 | 0,00 | 6 | 20,00 | ||||
| 2025-08-11 | 13F | Avantax Planning Partners, Inc. | 11 170 | -2,48 | 849 | 7,60 | ||||
| 2025-07-24 | 13F | Williams & Novak, LLC | 6 450 | -19,88 | 490 | -11,71 | ||||
| 2025-07-15 | 13F | FLP Wealth Management, LLC | 0 | -100,00 | 0 | |||||
| 2025-07-29 | 13F | TFC Financial Management | 1 396 512 | -1,39 | 106 191 | 8,84 | ||||
| 2025-08-04 | 13F | Center for Financial Planning, Inc. | 323 | 0,00 | 25 | 9,09 | ||||
| 2025-08-13 | 13F | Lido Advisors, LLC | 20 357 | -8,20 | 1 548 | 1,31 | ||||
| 2025-08-13 | 13F | Baker Avenue Asset Management, LP | 6 844 | 28,07 | 520 | 41,30 | ||||
| 2025-06-23 | NP | ITDD - iShares LifePath Target Date 2040 ETF | 72 464 | 13,05 | 5 190 | 20,25 | ||||
| 2025-08-07 | 13F | Flagship Wealth Advisors, Llc | 4 933 | 375 | ||||||
| 2025-07-24 | 13F | IFP Advisors, Inc | 35 533 | 4,48 | 2 702 | 15,33 | ||||
| 2025-08-11 | 13F | Compass Capital Corp /ma/ /adv | 25 204 | -0,59 | 1 786 | 3,00 | ||||
| 2025-08-04 | 13F | Capital Performance Advisors Llp | 3 193 | -0,81 | 243 | 9,50 | ||||
| 2025-08-04 | 13F | Premier Path Wealth Partners, LLC | 117 174 | -1,51 | 8 910 | 8,71 | ||||
| 2025-08-14 | 13F | Kovitz Investment Group Partners, LLC | 3 195 | -32,67 | 243 | -25,77 | ||||
| 2025-05-13 | 13F | Paradigm Financial Partners, Llc | 0 | -100,00 | 0 | |||||
| 2025-05-08 | 13F | Menard Financial Group LLC | 0 | -100,00 | 0 | |||||
| 2025-08-11 | 13F | Principal Securities, Inc. | 438 386 | -36,55 | 33 335 | -25,16 | ||||
| 2025-07-18 | 13F | Cantor Fitzgerald Investment Adviser L.p. | 89 881 | 15,60 | 6 835 | 27,60 | ||||
| 2025-08-15 | 13F | Morgan Stanley | 10 733 097 | 2,52 | 816 145 | 13,16 | ||||
| 2025-07-10 | 13F | Wealth Enhancement Advisory Services, Llc | 168 469 | -6,01 | 12 844 | 4,03 | ||||
| 2025-08-18 | 13F | Tactive Advisors, LLC | 9 996 | 760 | ||||||
| 2025-07-24 | NP | HASAX - Horizon Active Asset Allocation Fund Advisor Class | 2 105 075 | 99,15 | 158 344 | 117,70 | ||||
| 2025-07-29 | 13F | Arista Wealth Management, LLC | 20 574 | 24,45 | 1 564 | 37,43 | ||||
| 2025-07-29 | 13F | Sigma Investment Counselors Inc | 23 926 | 9,50 | 1 819 | 20,86 | ||||
| 2025-07-22 | 13F | Kessler Investment Group, LLC | 417 | 0,00 | 32 | 10,71 | ||||
| 2025-06-25 | NP | CDAZX - Multi-Manager Directional Alternative Strategies Fund Institutional Class | 163 520 | 11 711 | ||||||
| 2025-07-16 | 13F | Lloyd Advisory Services, LLC. | 15 264 | -2,38 | 1 161 | 7,71 | ||||
| 2025-07-17 | 13F | Keystone Global Partners, LLC | 0 | -100,00 | 0 | |||||
| 2025-07-25 | 13F | Allspring Global Investments Holdings, LLC | 1 569 | 0,00 | 119 | 10,19 | ||||
| 2025-08-11 | 13F | Bellwether Advisors, LLC | 192 | 0,00 | 15 | 7,69 | ||||
| 2025-08-12 | 13F | Coldstream Capital Management Inc | 312 392 | 2,47 | 23 754 | 13,10 | ||||
| 2025-08-14 | 13F | Aqr Capital Management Llc | 35 983 | 6,94 | 2 736 | 18,03 | ||||
| 2025-07-17 | 13F | Chicago Capital, LLC | 16 856 | 0,00 | 1 282 | 10,34 | ||||
| 2025-07-07 | 13F | Capital Asset Advisory Services LLC | 1 268 305 | 0,90 | 96 264 | 10,54 | ||||
| 2025-07-10 | 13F | Waypoint Wealth Partners Inc. | 4 109 | 0,00 | 312 | 10,25 | ||||
| 2025-07-15 | 13F | Patriot Investment Management Inc. | 90 122 | 1,25 | 6 853 | 11,76 | ||||
| 2025-08-06 | 13F | Adviser Investments LLC | 24 287 | 31,10 | 1 847 | 44,67 | ||||
| 2025-08-11 | 13F | Dorsey & Whitney Trust CO LLC | 28 330 | 0,00 | 2 154 | 10,40 | ||||
| 2025-08-26 | NP | LPVAX - BlackRock LifePath Dynamic 2055 Fund Investor A Shares | 244 032 | 18 556 | ||||||
| 2025-05-06 | 13F | Fpc Investment Advisory, Inc. | 0 | -100,00 | 0 | |||||
| 2025-06-27 | NP | IDUB - International Drawdown Managed Equity ETF | 2 433 310 | 11,06 | 174 274 | 18,13 | ||||
| 2025-08-04 | 13F | Integrity Alliance, Llc. | 179 470 | 4,19 | 13 647 | 15,00 | ||||
| 2025-08-05 | 13F | Magnolia Capital Advisors Llc | 4 239 | -3,04 | 322 | 6,98 | ||||
| 2025-08-14 | 13F | Clarity Capital Advisors, LLC | 7 945 | 1,39 | 604 | 12,06 | ||||
| 2025-07-08 | 13F | Granite Bay Wealth Management, LLC | 40 614 | 8,10 | 3 | 50,00 | ||||
| 2025-08-05 | 13F | Bank of New York Mellon Corp | 1 966 793 | 55,37 | 149 555 | 71,50 | ||||
| 2025-08-12 | 13F | Journey Strategic Wealth Llc | 4 103 | 16,17 | 312 | 27,98 | ||||
| 2025-08-11 | 13F | CFS Investment Advisory Services, LLC | 3 072 | 0,00 | 0 | |||||
| 2025-08-14 | 13F | Turim 21 Investimentos Ltda. | 1 133 | 0,00 | 86 | 10,26 | ||||
| 2025-07-22 | 13F | Steele Capital Management, Inc. | 125 983 | -4,47 | 9 580 | 5,45 | ||||
| 2025-07-23 | 13F | Heck Capital Advisors, LLC | 25 333 | 750,96 | 1 926 | 839,51 | ||||
| 2025-08-12 | 13F | Main Management ETF Advisors, LLC | 696 600 | -0,58 | 53 | 8,33 | ||||
| 2025-07-15 | 13F | Retireful, LLC | 16 796 | 1 277 | ||||||
| 2025-08-14 | 13F | Spears Abacus Advisors LLC | 5 079 | 386 | ||||||
| 2025-07-29 | 13F | Harbor Asset Planning, Inc. | 592 | 45 | ||||||
| 2025-07-10 | 13F | Klaas Financial Asset Advisors, LLC | 702 685 | 1,48 | 53 432 | 12,01 | ||||
| 2025-06-23 | NP | AOR - iShares Core Growth Allocation ETF | 5 670 732 | 3,66 | 406 138 | 10,26 | ||||
| 2025-07-14 | 13F | UMA Financial Services, Inc. | 3 620 | -18,96 | 275 | -10,42 | ||||
| 2025-07-23 | 13F | Lakeshore Capital Group, Inc. | 2 849 | 217 | ||||||
| 2025-07-30 | 13F | Whittier Trust Co | 3 084 | 224,97 | 235 | 260,00 | ||||
| 2025-08-11 | 13F | Brown Brothers Harriman & Co | 3 | 0,00 | 0 | |||||
| 2025-07-17 | 13F | K2 Financial Inc. | 16 291 | 11,79 | 1 223 | 22,81 | ||||
| 2025-08-11 | 13F | Anfield Capital Management, LLC | 33 | 0,00 | 3 | 0,00 | ||||
| 2025-08-20 | NP | NATIONWIDE VARIABLE INSURANCE TRUST - NVIT iShares Global Equity ETF Fund II | 182 727 | -4,84 | 13 895 | 5,03 | ||||
| 2025-07-30 | 13F | D.a. Davidson & Co. | 36 574 | -8,40 | 2 781 | 1,13 | ||||
| 2025-07-16 | 13F | Signaturefd, Llc | 900 | 0,00 | 68 | 9,68 | ||||
| 2025-08-06 | 13F | Commonwealth Equity Services, Llc | 555 511 | -17,05 | 42 | -8,70 | ||||
| 2025-07-30 | 13F | Klingman & Associates, LLC | 6 749 | 0,00 | 513 | 10,56 | ||||
| 2025-07-31 | 13F | Cosner Financial Group, LLC | 51 047 | 9,79 | 3 882 | 21,17 | ||||
| 2025-08-05 | 13F | Sigma Planning Corp | 23 850 | 11,83 | 1 814 | 23,42 | ||||
| 2025-08-06 | 13F | Hallmark Capital Management Inc | 5 375 | 15 257,14 | 409 | 20 300,00 | ||||
| 2025-07-30 | NP | CCMG - CCM Global Equity ETF | 1 313 439 | -8,14 | 98 797 | 0,41 | ||||
| 2025-08-06 | 13F | Bonfire Financial | 10 325 | 0,16 | 785 | 10,56 | ||||
| 2025-08-04 | 13F | Creative Financial Designs Inc /adv | 1 436 | -17,52 | 109 | -8,40 | ||||
| 2025-07-29 | 13F | Stratos Wealth Partners, LTD. | 1 196 326 | -9,00 | 90 969 | 0,44 | ||||
| 2025-07-08 | 13F | Parallel Advisors, LLC | 11 013 | 15,03 | 837 | 27,01 | ||||
| 2025-08-06 | 13F | Blue Investment Partners LLC | 198 466 | -21,07 | 15 091 | -12,87 | ||||
| 2025-08-14 | 13F | GWM Advisors LLC | 51 802 | 12,68 | 3 939 | 24,38 | ||||
| 2025-08-14 | 13F | Fort Point Capital Partners LLC | 4 599 | 0,00 | 350 | 10,44 | ||||
| 2025-08-13 | 13F | Colonial Trust Co / SC | 63 | 0,00 | 5 | 0,00 | ||||
| 2025-08-11 | 13F | NewEdge Wealth, LLC | 0 | -100,00 | 0 | |||||
| 2025-08-01 | 13F | Auto-Owners Insurance Co | 2 412 000 | 358,99 | 183 457 | 446,67 | ||||
| 2025-07-18 | 13F | Tanager Wealth Management LLP | 66 068 | 5 024 | ||||||
| 2025-08-14 | 13F | Snowden Capital Advisors LLC | 31 160 | -0,02 | 2 369 | 10,34 | ||||
| 2025-08-12 | 13F | Marshall & Sterling Wealth Advisors Inc. | 0 | -100,00 | 0 | |||||
| 2025-07-17 | 13F | Dopkins Wealth Management, Llc | 24 272 | 93,45 | 1 846 | 113,54 | ||||
| 2025-08-27 | 13F | Tribridge Partners Financial LLC | 13 882 | 1 | ||||||
| 2025-08-11 | 13F | Greykasell Wealth Strategies, Inc. | 10 845 | 0,00 | 825 | 10,31 | ||||
| 2025-08-11 | 13F | Alteri Wealth LLC | 5 660 | -13,56 | 430 | -4,66 | ||||
| 2025-04-30 | 13F | Sofos Investments, Inc. | 241 | 17 | ||||||
| 2025-08-13 | 13F | Jones Financial Companies Lllp | 166 | 115,58 | 13 | 140,00 | ||||
| 2025-08-01 | 13F | Clark Asset Management, LLC | 4 713 | 358 | ||||||
| 2025-08-15 | 13F | Equitable Holdings, Inc. | 36 259 | 45,17 | 2 757 | 60,29 | ||||
| 2025-07-17 | 13F | Poinciana Advisors Group, Llc | 2 739 | 208 | ||||||
| 2025-08-14 | 13F/A | Skopos Labs, Inc. | 140 | 11 | ||||||
| 2025-06-23 | NP | ITDC - iShares LifePath Target Date 2035 ETF | 61 399 | 15,73 | 4 397 | 23,10 | ||||
| 2025-08-13 | 13F | Renaissance Technologies Llc | 7 800 | 593 | ||||||
| 2025-07-07 | 13F | Peterson Wealth Advisors, LLC | 142 485 | 3,13 | 10 835 | 26,39 | ||||
| 2025-08-12 | 13F | Jpmorgan Chase & Co | 3 856 982 | 19,40 | 293 285 | 31,79 | ||||
| 2025-07-09 | 13F | David J Yvars Group | 83 460 | 6 346 | ||||||
| 2025-07-24 | 13F | Cyndeo Wealth Partners, LLC | 0 | -100,00 | 0 | |||||
| 2025-08-05 | 13F | Obermeyer Wood Investment Counsel, Lllp | 2 871 | 218 | ||||||
| 2025-08-14 | 13F | Capitolis Liquid Global Markets LLC | 72 500 | 5 513 | ||||||
| 2025-07-09 | 13F | Camelot Technology Advisors, Inc. | 7 120 | 0,00 | 541 | 10,41 | ||||
| 2025-07-18 | 13F | Truist Financial Corp | 169 091 | 5,86 | 12 858 | 16,84 |
Other Listings
| MX:IDEV |