Statistiques de base
| Valeur du portefeuille | $ 168 360 314 |
| Positions actuelles | 93 |
Dernières positions, performances, ASG (à partir des dépôts 13F, 13D)
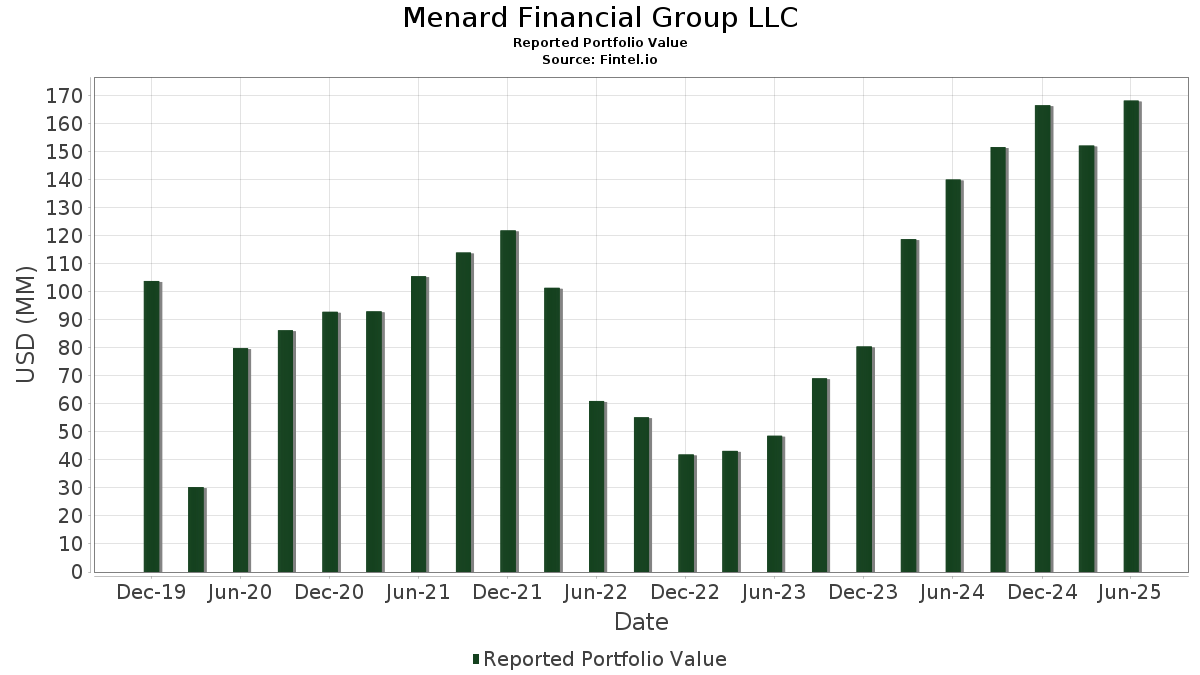
Menard Financial Group LLC a déclaré un total de 93 positions dans ses derniers dépôts auprès de la SEC. La valeur la plus récente du portefeuille est calculée à 168 360 314 USD. Les actifs sous gestion réels (ASG) sont cette valeur plus les liquidités (qui ne sont pas divulguées). Les principales positions de Menard Financial Group LLC sont Zacks Trust - Zacks Earnings Consistent Portfolio ETF (US:ZECP) , NVIDIA Corporation (US:NVDA) , Meta Platforms, Inc. (US:META) , Amazon.com, Inc. (US:AMZN) , and Microsoft Corporation (US:MSFT) . Les nouvelles positions de Menard Financial Group LLC incluent GE Vernova Inc. (US:GEV) , Coupang, Inc. (US:CPNG) , Amphenol Corporation (US:APH) , Brinker International, Inc. (US:EAT) , and .
Meilleures augmentations ce trimestre
Nous utilisons la variation de l'allocation du portefeuille car il s'agit de l'indicateur le plus significatif. Les changements peuvent être dus à des transactions ou à des variations de prix des actions.
| Titre | Actions (en millions) |
Valeur ($ en millions) |
% du portefeuille | ΔPortefeuille % |
|---|---|---|---|---|
| 0,10 | 15,43 | 9,1673 | 1,7812 | |
| 0,02 | 5,35 | 3,1807 | 0,7308 | |
| 0,00 | 1,38 | 0,8197 | 0,5154 | |
| 0,00 | 0,80 | 0,4776 | 0,4776 | |
| 0,00 | 1,15 | 0,6829 | 0,4602 | |
| 0,00 | 0,54 | 0,3212 | 0,3212 | |
| 0,01 | 0,52 | 0,3079 | 0,3079 | |
| 0,01 | 2,18 | 1,2932 | 0,2824 | |
| 0,02 | 0,47 | 0,2787 | 0,2787 | |
| 0,04 | 7,79 | 4,6260 | 0,2692 |
Principales baisses ce trimestre
Nous utilisons la variation de l'allocation du portefeuille car il s'agit de l'indicateur le plus significatif. Les changements peuvent être dus à des transactions ou à des variations de prix des actions.
| Titre | Actions (en millions) |
Valeur ($ en millions) |
% du portefeuille | ΔPortefeuille % |
|---|---|---|---|---|
| 0,00 | 0,40 | 0,2400 | -1,0057 | |
| 1,33 | 42,31 | 25,1292 | -0,4894 | |
| 0,00 | 0,00 | -0,2638 | ||
| 0,03 | 2,39 | 1,4217 | -0,1887 | |
| 0,09 | 2,50 | 1,4843 | -0,1446 | |
| 0,00 | 1,20 | 0,7110 | -0,1357 | |
| 0,01 | 2,63 | 1,5646 | -0,1339 | |
| 0,04 | 1,98 | 1,1776 | -0,1335 | |
| 0,01 | 0,41 | 0,2415 | -0,1311 | |
| 0,01 | 2,19 | 1,3034 | -0,1266 |
Déclarations 13F et dépôts de fonds
Ce formulaire a été déposé le 2025-08-13 pour la période de déclaration 2025-06-30. Cliquez sur l'icône du lien pour voir l'historique complet des transactions.
Mettre à niveau pour débloquer les données premium et exporter vers Excel ![]() .
.
| Titre | Type | Prix moyen de l'action | Actions (en millions) |
ΔActions (%) |
ΔActions (%) |
Valeur ($ en millions) |
Portefeuille (%) |
ΔPortefeuille (%) |
|
|---|---|---|---|---|---|---|---|---|---|
| ZECP / Zacks Trust - Zacks Earnings Consistent Portfolio ETF | 1,33 | 1,71 | 42,31 | 8,44 | 25,1292 | -0,4894 | |||
| NVDA / NVIDIA Corporation | 0,10 | -1,39 | 15,43 | 37,22 | 9,1673 | 1,7812 | |||
| META / Meta Platforms, Inc. | 0,01 | -8,94 | 8,14 | 14,43 | 4,8367 | 0,1641 | |||
| AMZN / Amazon.com, Inc. | 0,04 | -1,01 | 7,79 | 17,38 | 4,6260 | 0,2692 | |||
| MSFT / Microsoft Corporation | 0,01 | -1,19 | 5,79 | 13,44 | 3,4386 | 0,0873 | |||
| AVGO / Broadcom Inc. | 0,02 | 4,18 | 5,35 | 43,50 | 3,1807 | 0,7308 | |||
| PLTR / Palantir Technologies Inc. | 0,03 | -2,57 | 3,45 | 22,03 | 2,0463 | 0,1922 | |||
| SPOT / Spotify Technology S.A. | 0,00 | -0,93 | 3,04 | 20,14 | 1,8035 | 0,1438 | |||
| AAPL / Apple Inc. | 0,01 | -1,47 | 2,63 | 1,86 | 1,5646 | -0,1339 | |||
| PYLD / PIMCO ETF Trust - PIMCO Multisector Bond Active Exchange-Traded Fund | 0,09 | -1,39 | 2,50 | 0,77 | 1,4843 | -0,1446 | |||
| AXON / Axon Enterprise, Inc. | 0,00 | -2,84 | 2,46 | 33,71 | 1,4630 | 0,2533 | |||
| UBER / Uber Technologies, Inc. | 0,03 | -2,42 | 2,45 | 6,10 | 1,4576 | -0,0616 | |||
| XOM / Exxon Mobil Corporation | 0,02 | -0,91 | 2,41 | 2,03 | 1,4329 | -0,1199 | |||
| BOND / PIMCO ETF Trust - PIMCO Active Bond Exchange-Traded Fund | 0,03 | -3,69 | 2,39 | -2,41 | 1,4217 | -0,1887 | |||
| GOOGL / Alphabet Inc. | 0,01 | -1,92 | 2,37 | 5,91 | 1,4056 | -0,0618 | |||
| V / Visa Inc. | 0,01 | -1,33 | 2,19 | 0,78 | 1,3034 | -0,1266 | |||
| JPM / JPMorgan Chase & Co. | 0,01 | 21,60 | 2,18 | 41,46 | 1,2932 | 0,2824 | |||
| NFLX / Netflix, Inc. | 0,00 | -2,08 | 2,15 | 15,26 | 1,2742 | 0,0521 | |||
| BBHY / J.P. Morgan Exchange-Traded Fund Trust - JPMorgan BetaBuilders USD High Yield Corporate Bond ETF | 0,04 | -3,37 | 1,98 | -0,70 | 1,1776 | -0,1335 | |||
| PANW / Palo Alto Networks, Inc. | 0,01 | 9,34 | 1,74 | 18,58 | 1,0313 | 0,0699 | |||
| CVX / Chevron Corporation | 0,01 | -4,91 | 1,71 | 0,41 | 1,0174 | -0,1026 | |||
| XLK / The Select Sector SPDR Trust - The Technology Select Sector SPDR Fund | 0,01 | -1,43 | 1,71 | 16,79 | 1,0166 | 0,0546 | |||
| JCPB / J.P. Morgan Exchange-Traded Fund Trust - JPMorgan Core Plus Bond ETF | 0,03 | -2,98 | 1,49 | -1,65 | 0,8856 | -0,1098 | |||
| ABBV / AbbVie Inc. | 0,01 | 4,48 | 1,48 | 3,65 | 0,8764 | -0,0585 | |||
| TSLA / Tesla, Inc. | 0,00 | -1,65 | 1,44 | 13,42 | 0,8540 | 0,0219 | |||
| PG / The Procter & Gamble Company | 0,01 | -1,45 | 1,42 | -1,39 | 0,8430 | -0,1021 | |||
| PWR / Quanta Services, Inc. | 0,00 | 150,17 | 1,38 | 198,06 | 0,8197 | 0,5154 | |||
| HD / The Home Depot, Inc. | 0,00 | -1,15 | 1,29 | 0,86 | 0,7684 | -0,0737 | |||
| CAT / Caterpillar Inc. | 0,00 | -2,08 | 1,21 | 18,47 | 0,7166 | 0,0478 | |||
| AJG / Arthur J. Gallagher & Co. | 0,00 | -1,92 | 1,20 | -7,21 | 0,7110 | -0,1357 | |||
| MCK / McKesson Corporation | 0,00 | 228,93 | 1,15 | 238,94 | 0,6829 | 0,4602 | |||
| TMUS / T-Mobile US, Inc. | 0,00 | 1,50 | 1,14 | -4,76 | 0,6782 | -0,1087 | |||
| BR / Broadridge Financial Solutions, Inc. | 0,00 | -2,50 | 1,12 | 1,45 | 0,6651 | -0,0596 | |||
| BAC / Bank of America Corporation | 0,02 | 0,22 | 1,12 | 16,15 | 0,6627 | 0,0318 | |||
| DE / Deere & Company | 0,00 | -3,01 | 1,10 | 3,78 | 0,6527 | -0,0425 | |||
| SHOP / Shopify Inc. | 0,01 | -4,14 | 1,08 | 17,92 | 0,6410 | 0,0397 | |||
| JEPI / J.P. Morgan Exchange-Traded Fund Trust - JPMorgan Equity Premium Income ETF | 0,02 | -1,34 | 0,97 | 1,26 | 0,5747 | -0,0527 | |||
| CACI / CACI International Inc | 0,00 | -2,92 | 0,95 | -1,76 | 0,5649 | -0,0714 | |||
| BRK.B / Berkshire Hathaway Inc. | 0,00 | -2,25 | 0,89 | -7,31 | 0,5271 | -0,1016 | |||
| VRTX / Vertex Pharmaceuticals Incorporated | 0,00 | 9,48 | 0,87 | 8,36 | 0,5159 | -0,0107 | |||
| COST / Costco Wholesale Corporation | 0,00 | -2,68 | 0,86 | -4,64 | 0,5133 | -0,0819 | |||
| CRWD / CrowdStrike Holdings, Inc. | 0,00 | 0,06 | 0,86 | 15,07 | 0,5079 | 0,0196 | |||
| APO / Apollo Global Management, Inc. | 0,01 | -3,09 | 0,84 | 6,30 | 0,5018 | -0,0200 | |||
| COP / ConocoPhillips | 0,01 | 0,44 | 0,84 | 2,93 | 0,5007 | -0,0374 | |||
| RCL / Royal Caribbean Cruises Ltd. | 0,00 | 0,80 | 0,4776 | 0,4776 | |||||
| NET / Cloudflare, Inc. | 0,00 | -2,53 | 0,79 | 56,02 | 0,4704 | 0,1372 | |||
| JPIE / J.P. Morgan Exchange-Traded Fund Trust - JPMorgan Income ETF | 0,02 | -1,52 | 0,78 | -0,38 | 0,4633 | -0,0503 | |||
| ITRI / Itron, Inc. | 0,01 | -0,59 | 0,77 | 22,66 | 0,4598 | 0,0454 | |||
| GOOG / Alphabet Inc. | 0,00 | -0,58 | 0,76 | 6,78 | 0,4493 | -0,0160 | |||
| LLY / Eli Lilly and Company | 0,00 | -3,41 | 0,66 | -2,79 | 0,3940 | -0,0543 | |||
| CBRE / CBRE Group, Inc. | 0,00 | -3,16 | 0,64 | 9,42 | 0,3800 | -0,0035 | |||
| CASY / Casey's General Stores, Inc. | 0,00 | -3,26 | 0,64 | 5,65 | 0,3782 | -0,0175 | |||
| TOST / Toast, Inc. | 0,01 | -1,26 | 0,60 | 24,27 | 0,3562 | 0,0392 | |||
| ROL / Rollins, Inc. | 0,01 | -2,37 | 0,59 | -2,95 | 0,3518 | -0,0493 | |||
| ZS / Zscaler, Inc. | 0,00 | -1,68 | 0,59 | 32,36 | 0,3502 | 0,0578 | |||
| A / Agilent Technologies, Inc. | 0,00 | 0,00 | 0,58 | 12,04 | 0,3431 | 0,0048 | |||
| PHM / PulteGroup, Inc. | 0,01 | 1,10 | 0,55 | 5,75 | 0,3284 | -0,0150 | |||
| HOOD / Robinhood Markets, Inc. | 0,01 | -2,33 | 0,55 | 87,71 | 0,3269 | 0,1345 | |||
| GEV / GE Vernova Inc. | 0,00 | 0,54 | 0,3212 | 0,3212 | |||||
| HWM / Howmet Aerospace Inc. | 0,00 | -0,92 | 0,54 | 18,46 | 0,3203 | 0,0211 | |||
| ACA / Arcosa, Inc. | 0,01 | -3,25 | 0,53 | -2,41 | 0,3126 | -0,0415 | |||
| LRCX / Lam Research Corporation | 0,01 | 0,52 | 0,3079 | 0,3079 | |||||
| FN / Fabrinet | 0,00 | -1,05 | 0,50 | 42,17 | 0,2968 | 0,0663 | |||
| CPNG / Coupang, Inc. | 0,02 | 0,47 | 0,2787 | 0,2787 | |||||
| STLD / Steel Dynamics, Inc. | 0,00 | -3,77 | 0,44 | -6,22 | 0,2601 | -0,0461 | |||
| PSTG / Pure Storage, Inc. | 0,01 | -40,79 | 0,41 | -28,40 | 0,2415 | -0,1311 | |||
| UNH / UnitedHealth Group Incorporated | 0,00 | -73,07 | 0,40 | -78,70 | 0,2400 | -1,0057 | |||
| APH / Amphenol Corporation | 0,00 | 0,40 | 0,2366 | 0,2366 | |||||
| ZM / Zoom Communications Inc. | 0,01 | -1,63 | 0,39 | -1,75 | 0,2345 | -0,0293 | |||
| TWLO / Twilio Inc. | 0,00 | -2,25 | 0,39 | 20,43 | 0,2313 | 0,0191 | |||
| TSM / Taiwan Semiconductor Manufacturing Company Limited - Depositary Receipt (Common Stock) | 0,00 | -1,50 | 0,39 | 29,53 | 0,2298 | 0,0336 | |||
| BJ / BJ's Wholesale Club Holdings, Inc. | 0,00 | 0,23 | 0,38 | -9,67 | 0,2276 | -0,0514 | |||
| ANET / Arista Networks Inc | 0,00 | -0,56 | 0,37 | 12,31 | 0,2169 | 0,0030 | |||
| FANG / Diamondback Energy, Inc. | 0,00 | 0,00 | 0,35 | 4,12 | 0,2107 | -0,0130 | |||
| ORCL / Oracle Corporation | 0,00 | 6,36 | 0,35 | 57,33 | 0,2106 | 0,0627 | |||
| MLM / Martin Marietta Materials, Inc. | 0,00 | 0,00 | 0,34 | 2,70 | 0,2031 | -0,0157 | |||
| GILD / Gilead Sciences, Inc. | 0,00 | 2,69 | 0,33 | 16,38 | 0,1989 | 0,0099 | |||
| PLD / Prologis, Inc. | 0,00 | 0,06 | 0,33 | 0,60 | 0,1980 | -0,0194 | |||
| BXP / Boston Properties, Inc. | 0,00 | 0,29 | 0,33 | 5,73 | 0,1973 | -0,0089 | |||
| ORLY / O'Reilly Automotive, Inc. | 0,00 | 1 400,00 | 0,32 | -2,73 | 0,1911 | -0,0256 | |||
| OKTA / Okta, Inc. | 0,00 | 7,99 | 0,32 | -7,83 | 0,1894 | -0,0377 | |||
| EAT / Brinker International, Inc. | 0,00 | 0,29 | 0,1701 | 0,1701 | |||||
| MWA / Mueller Water Products, Inc. | 0,01 | 0,29 | 0,28 | -4,73 | 0,1679 | -0,0270 | |||
| CARR / Carrier Global Corporation | 0,00 | 0,28 | 0,1652 | 0,1652 | |||||
| POR / Portland General Electric Company | 0,01 | -0,63 | 0,24 | -5,18 | 0,1416 | -0,0235 | |||
| AIZ / Assurant, Inc. | 0,00 | 0,24 | 0,1398 | 0,1398 | |||||
| IVW / iShares Trust - iShares S&P 500 Growth ETF | 0,00 | 0,00 | 0,23 | 14,71 | 0,1392 | 0,0048 | |||
| VRT / Vertiv Holdings Co | 0,00 | 0,22 | 0,1315 | 0,1315 | |||||
| WMT / Walmart Inc. | 0,00 | 0,00 | 0,22 | -0,45 | 0,1301 | -0,0149 | |||
| JNJ / Johnson & Johnson | 0,00 | 0,00 | 0,21 | -0,94 | 0,1257 | -0,0148 | |||
| GE / General Electric Company | 0,00 | 0,21 | 0,1255 | 0,1255 | |||||
| COR / Cencora, Inc. | 0,00 | 0,00 | 0,21 | 2,97 | 0,1238 | -0,0089 | |||
| KO / The Coca-Cola Company | 0,00 | 0,00 | 0,20 | -1,47 | 0,1199 | -0,0145 | |||
| CTRA / Coterra Energy Inc. | 0,00 | -100,00 | 0,00 | 0,0000 | |||||
| SBUX / Starbucks Corporation | 0,00 | -100,00 | 0,00 | 0,0000 | |||||
| DOC / Healthpeak Properties, Inc. | 0,00 | -100,00 | 0,00 | 0,0000 | |||||
| GPK / Graphic Packaging Holding Company | 0,00 | -100,00 | 0,00 | 0,0000 | |||||
| SKY / Champion Homes, Inc. | 0,00 | -100,00 | 0,00 | 0,0000 | |||||
| INTA / Intapp, Inc. | 0,00 | -100,00 | 0,00 | 0,0000 | |||||
| OC / Owens Corning | 0,00 | -100,00 | 0,00 | 0,0000 | |||||
| WTFC / Wintrust Financial Corporation | 0,00 | -100,00 | 0,00 | 0,0000 | |||||
| PFE / Pfizer Inc. | 0,00 | -100,00 | 0,00 | 0,0000 | |||||
| EME / EMCOR Group, Inc. | 0,00 | -100,00 | 0,00 | 0,0000 | |||||
| TEAM / Atlassian Corporation | 0,00 | -100,00 | 0,00 | 0,0000 | |||||
| HUBS / HubSpot, Inc. | 0,00 | -100,00 | 0,00 | 0,0000 | |||||
| ZTS / Zoetis Inc. | 0,00 | -100,00 | 0,00 | 0,0000 | |||||
| MRVL / Marvell Technology, Inc. | 0,00 | -100,00 | 0,00 | -100,00 | -0,2638 |