Statistiques de base
| Valeur du portefeuille | $ 484 936 875 |
| Positions actuelles | 98 |
Dernières positions, performances, ASG (à partir des dépôts 13F, 13D)
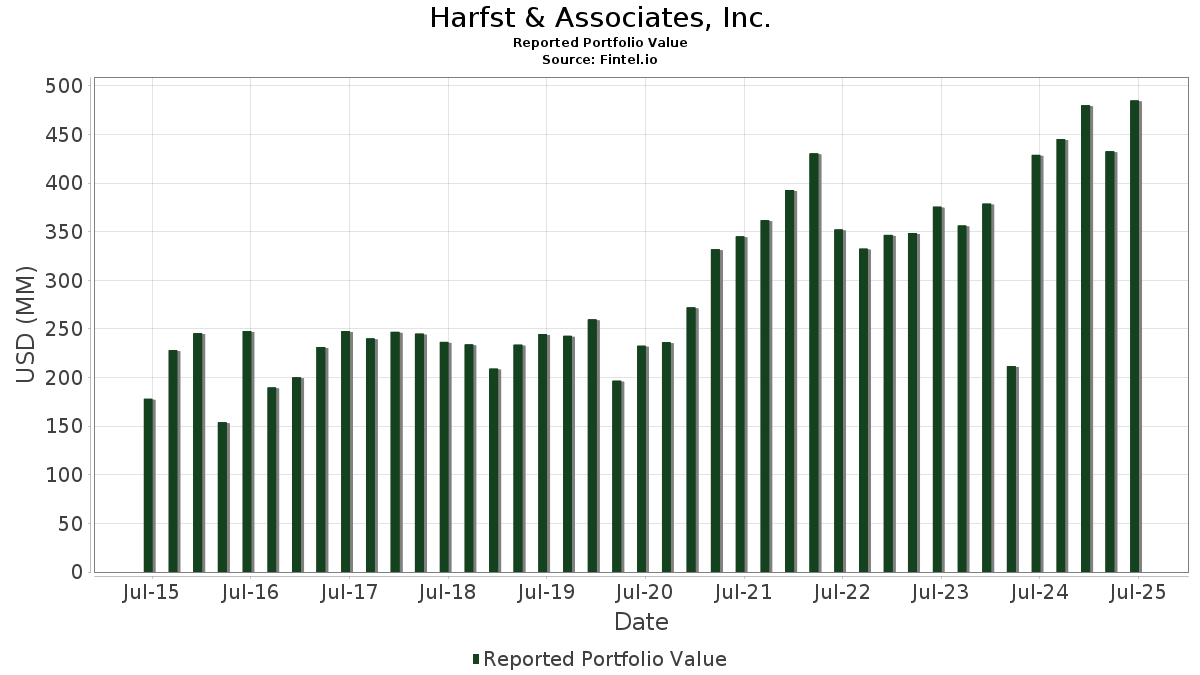
Harfst & Associates, Inc. a déclaré un total de 98 positions dans ses derniers dépôts auprès de la SEC. La valeur la plus récente du portefeuille est calculée à 484 936 875 USD. Les actifs sous gestion réels (ASG) sont cette valeur plus les liquidités (qui ne sont pas divulguées). Les principales positions de Harfst & Associates, Inc. sont Raymond James Financial, Inc. (US:RJF) , iShares Trust - iShares Core S&P 500 ETF (US:IVV) , Invesco QQQ Trust, Series 1 (US:QQQ) , Vanguard World Fund - Vanguard Industrials ETF (US:VIS) , and The Procter & Gamble Company (US:PG) . Les nouvelles positions de Harfst & Associates, Inc. incluent iShares Trust - iShares Core MSCI International Developed Markets ETF (US:IDEV) , .
Meilleures augmentations ce trimestre
Nous utilisons la variation de l'allocation du portefeuille car il s'agit de l'indicateur le plus significatif. Les changements peuvent être dus à des transactions ou à des variations de prix des actions.
| Titre | Actions (en millions) |
Valeur ($ en millions) |
% du portefeuille | ΔPortefeuille % |
|---|---|---|---|---|
| 0,31 | 10,95 | 2,2580 | 1,3255 | |
| 0,02 | 4,41 | 0,9098 | 0,7027 | |
| 0,00 | 2,19 | 0,4509 | 0,2889 | |
| 0,01 | 1,66 | 0,3431 | 0,2828 | |
| 0,00 | 2,04 | 0,4197 | 0,2753 | |
| 0,03 | 1,85 | 0,3825 | 0,2421 | |
| 0,05 | 29,11 | 6,0030 | 0,2417 | |
| 0,02 | 2,27 | 0,4679 | 0,2294 | |
| 0,01 | 1,84 | 0,3792 | 0,2272 | |
| 0,01 | 1,91 | 0,3934 | 0,2265 |
Principales baisses ce trimestre
Nous utilisons la variation de l'allocation du portefeuille car il s'agit de l'indicateur le plus significatif. Les changements peuvent être dus à des transactions ou à des variations de prix des actions.
| Titre | Actions (en millions) |
Valeur ($ en millions) |
% du portefeuille | ΔPortefeuille % |
|---|---|---|---|---|
| 1,04 | 159,11 | 32,8114 | -0,6084 | |
| 0,09 | 14,47 | 2,9832 | -0,6082 | |
| 0,04 | 7,42 | 1,5305 | -0,4359 | |
| 0,11 | 66,18 | 13,6480 | -0,4088 | |
| 0,01 | 4,19 | 0,8635 | -0,2750 | |
| 0,00 | 0,22 | 0,0459 | -0,2378 | |
| 0,00 | 3,65 | 0,7529 | -0,2273 | |
| 0,01 | 3,16 | 0,6511 | -0,1982 | |
| 0,02 | 2,38 | 0,4902 | -0,1980 | |
| 0,01 | 2,35 | 0,4847 | -0,1918 |
Déclarations 13F et dépôts de fonds
Ce formulaire a été déposé le 2025-08-13 pour la période de déclaration 2025-06-30. Cliquez sur l'icône du lien pour voir l'historique complet des transactions.
Mettre à niveau pour débloquer les données premium et exporter vers Excel ![]() .
.
| Titre | Type | Prix moyen de l'action | Actions (en millions) |
ΔActions (%) |
ΔActions (%) |
Valeur ($ en millions) |
Portefeuille (%) |
ΔPortefeuille (%) |
|
|---|---|---|---|---|---|---|---|---|---|
| RJF / Raymond James Financial, Inc. | 1,04 | -0,34 | 159,11 | 10,04 | 32,8114 | -0,6084 | |||
| IVV / iShares Trust - iShares Core S&P 500 ETF | 0,11 | -1,52 | 66,18 | 8,82 | 13,6480 | -0,4088 | |||
| QQQ / Invesco QQQ Trust, Series 1 | 0,05 | -0,73 | 29,11 | 16,78 | 6,0030 | 0,2417 | |||
| VIS / Vanguard World Fund - Vanguard Industrials ETF | 0,07 | 3,08 | 18,72 | 16,62 | 3,8600 | 0,1504 | |||
| PG / The Procter & Gamble Company | 0,09 | -0,41 | 14,47 | -6,91 | 2,9832 | -0,6082 | |||
| TCAF / T. Rowe Price Exchange-Traded Funds, Inc. - T. Rowe Price Capital Appreciation Equity ETF | 0,31 | 148,31 | 10,95 | 171,42 | 2,2580 | 1,3255 | |||
| LAD / Lithia Motors, Inc. | 0,03 | -2,25 | 9,45 | 12,49 | 1,9480 | 0,0071 | |||
| VTI / Vanguard Index Funds - Vanguard Total Stock Market ETF | 0,03 | -0,31 | 8,89 | 10,25 | 1,8325 | -0,0305 | |||
| AAPL / Apple Inc. | 0,04 | -5,55 | 7,42 | -12,78 | 1,5305 | -0,4359 | |||
| NVDA / NVIDIA Corporation | 0,04 | -28,96 | 6,14 | 3,57 | 1,2668 | -0,1042 | |||
| MSFT / Microsoft Corporation | 0,01 | -3,70 | 6,11 | 27,61 | 1,2608 | 0,1534 | |||
| VXF / Vanguard Index Funds - Vanguard Extended Market ETF | 0,02 | 340,03 | 4,41 | 392,41 | 0,9098 | 0,7027 | |||
| BRK.B / Berkshire Hathaway Inc. | 0,01 | -6,80 | 4,19 | -14,98 | 0,8635 | -0,2750 | |||
| AMZN / Amazon.com, Inc. | 0,02 | -10,24 | 3,69 | 3,47 | 0,7619 | -0,0632 | |||
| COST / Costco Wholesale Corporation | 0,00 | -17,75 | 3,65 | -13,91 | 0,7529 | -0,2273 | |||
| AMD / Advanced Micro Devices, Inc. | 0,02 | -4,79 | 3,44 | 31,48 | 0,7089 | 0,1047 | |||
| GOOGL / Alphabet Inc. | 0,02 | -12,83 | 3,38 | -0,65 | 0,6962 | -0,0893 | |||
| V / Visa Inc. | 0,01 | -15,19 | 3,16 | -14,07 | 0,6511 | -0,1982 | |||
| SCHW / The Charles Schwab Corporation | 0,03 | -22,97 | 3,07 | -10,22 | 0,6325 | -0,1570 | |||
| ADBE / Adobe Inc. | 0,01 | 1,79 | 3,05 | 2,69 | 0,6292 | -0,0576 | |||
| NTRS / Northern Trust Corporation | 0,02 | -13,61 | 3,02 | 11,04 | 0,6223 | -0,0058 | |||
| INTU / Intuit Inc. | 0,00 | -16,11 | 2,97 | 7,62 | 0,6115 | -0,0253 | |||
| AMAT / Applied Materials, Inc. | 0,02 | -6,21 | 2,85 | 18,33 | 0,5886 | 0,0310 | |||
| NOW / ServiceNow, Inc. | 0,00 | -21,39 | 2,72 | 1,53 | 0,5601 | -0,0583 | |||
| FAST / Fastenal Company | 0,06 | 86,88 | 2,67 | 1,22 | 0,5497 | -0,0590 | |||
| BLK / BlackRock, Inc. | 0,00 | -11,81 | 2,66 | -2,24 | 0,5492 | -0,0804 | |||
| TXN / Texas Instruments Incorporated | 0,01 | -8,27 | 2,64 | 5,99 | 0,5441 | -0,0313 | |||
| LRCX / Lam Research Corporation | 0,03 | -2,78 | 2,60 | 30,21 | 0,5352 | 0,0744 | |||
| META / Meta Platforms, Inc. | 0,00 | -14,52 | 2,56 | 9,45 | 0,5279 | -0,0126 | |||
| MPWR / Monolithic Power Systems, Inc. | 0,00 | 5,04 | 2,51 | 32,42 | 0,5182 | 0,0797 | |||
| CMI / Cummins Inc. | 0,01 | -21,53 | 2,48 | -18,03 | 0,5122 | -0,1880 | |||
| XOM / Exxon Mobil Corporation | 0,02 | -11,93 | 2,38 | -20,15 | 0,4902 | -0,1980 | |||
| AIT / Applied Industrial Technologies, Inc. | 0,01 | -22,15 | 2,35 | -19,69 | 0,4847 | -0,1918 | |||
| AMP / Ameriprise Financial, Inc. | 0,00 | -10,10 | 2,34 | -0,89 | 0,4821 | -0,0630 | |||
| VOO / Vanguard Index Funds - Vanguard S&P 500 ETF | 0,00 | -4,08 | 2,33 | 6,02 | 0,4796 | -0,0274 | |||
| APH / Amphenol Corporation | 0,02 | 46,03 | 2,27 | 119,98 | 0,4679 | 0,2294 | |||
| NFLX / Netflix, Inc. | 0,00 | 117,15 | 2,19 | 211,84 | 0,4509 | 0,2889 | |||
| CRM / Salesforce, Inc. | 0,01 | 0,39 | 2,11 | 2,03 | 0,4356 | -0,0430 | |||
| GGG / Graco Inc. | 0,02 | -5,67 | 2,05 | -2,90 | 0,4221 | -0,0650 | |||
| KLAC / KLA Corporation | 0,00 | 147,23 | 2,04 | 226,12 | 0,4197 | 0,2753 | |||
| PGR / The Progressive Corporation | 0,01 | -12,91 | 2,02 | -17,87 | 0,4162 | -0,1518 | |||
| ODFL / Old Dominion Freight Line, Inc. | 0,01 | 3,40 | 1,97 | 1,44 | 0,4056 | -0,0426 | |||
| MSTR / Strategy Inc | 0,00 | 59,36 | 1,94 | 123,50 | 0,4001 | 0,1994 | |||
| GE / General Electric Company | 0,01 | 105,52 | 1,91 | 164,49 | 0,3934 | 0,2265 | |||
| IBKR / Interactive Brokers Group, Inc. | 0,03 | 812,84 | 1,85 | 205,44 | 0,3825 | 0,2421 | |||
| MS / Morgan Stanley | 0,01 | 131,60 | 1,84 | 179,76 | 0,3792 | 0,2272 | |||
| WMT / Walmart Inc. | 0,02 | 107,00 | 1,80 | 130,77 | 0,3713 | 0,1908 | |||
| NTAP / NetApp, Inc. | 0,02 | 127,44 | 1,75 | 176,06 | 0,3615 | 0,2147 | |||
| HUBB / Hubbell Incorporated | 0,00 | 116,90 | 1,75 | 167,99 | 0,3610 | 0,2099 | |||
| CTAS / Cintas Corporation | 0,01 | 129,96 | 1,74 | 149,50 | 0,3587 | 0,1975 | |||
| TT / Trane Technologies plc | 0,00 | 114,15 | 1,73 | 178,17 | 0,3576 | 0,2134 | |||
| AFL / Aflac Incorporated | 0,02 | 153,25 | 1,72 | 140,11 | 0,3557 | 0,1897 | |||
| AME / AMETEK, Inc. | 0,01 | 66,52 | 1,72 | 75,20 | 0,3556 | 0,1279 | |||
| MLM / Martin Marietta Materials, Inc. | 0,00 | 51,32 | 1,70 | 73,72 | 0,3505 | 0,1244 | |||
| JNJ / Johnson & Johnson | 0,01 | -2,89 | 1,70 | -10,55 | 0,3499 | -0,0885 | |||
| VMC / Vulcan Materials Company | 0,01 | 470,48 | 1,66 | 539,62 | 0,3431 | 0,2828 | |||
| EBAY / eBay Inc. | 0,02 | 108,28 | 1,66 | 129,14 | 0,3422 | 0,1747 | |||
| J / Jacobs Solutions Inc. | 0,01 | 134,22 | 1,65 | 154,87 | 0,3402 | 0,1905 | |||
| ISRG / Intuitive Surgical, Inc. | 0,00 | 122,64 | 1,64 | 144,41 | 0,3383 | 0,1831 | |||
| EOG / EOG Resources, Inc. | 0,01 | -9,02 | 1,64 | -15,17 | 0,3382 | -0,1085 | |||
| DOV / Dover Corporation | 0,01 | 136,52 | 1,61 | 146,64 | 0,3328 | 0,1816 | |||
| DPZ / Domino's Pizza, Inc. | 0,00 | 143,34 | 1,61 | 138,63 | 0,3313 | 0,1757 | |||
| CPRT / Copart, Inc. | 0,03 | 111,00 | 1,61 | 83,12 | 0,3312 | 0,1283 | |||
| APO / Apollo Global Management, Inc. | 0,01 | 106,10 | 1,59 | 113,71 | 0,3280 | 0,1558 | |||
| DHR / Danaher Corporation | 0,01 | 142,87 | 1,58 | 134,02 | 0,3263 | 0,1700 | |||
| CVX / Chevron Corporation | 0,01 | -10,71 | 1,56 | -23,58 | 0,3222 | -0,1503 | |||
| SPGI / S&P Global Inc. | 0,00 | 141,91 | 1,55 | 151,13 | 0,3201 | 0,1772 | |||
| TSLA / Tesla, Inc. | 0,00 | 40,36 | 1,54 | 72,07 | 0,3176 | 0,1107 | |||
| PCAR / PACCAR Inc | 0,02 | 157,90 | 1,53 | 151,65 | 0,3147 | 0,1746 | |||
| WM / Waste Management, Inc. | 0,01 | 125,29 | 1,50 | 122,92 | 0,3089 | 0,1534 | |||
| BRK.A / Berkshire Hathaway Inc. | 0,00 | 0,00 | 1,46 | -8,71 | 0,3006 | -0,0685 | |||
| TMO / Thermo Fisher Scientific Inc. | 0,00 | 183,71 | 1,39 | 131,28 | 0,2868 | 0,1477 | |||
| SPLV / Invesco Exchange-Traded Fund Trust II - Invesco S&P 500 Low Volatility ETF | 0,02 | -3,77 | 1,27 | -6,25 | 0,2628 | -0,0513 | |||
| PSX / Phillips 66 | 0,01 | 77,46 | 1,15 | 71,58 | 0,2379 | 0,0824 | |||
| MCD / McDonald's Corporation | 0,00 | 97,89 | 1,15 | 85,16 | 0,2369 | 0,0935 | |||
| CAT / Caterpillar Inc. | 0,00 | 0,00 | 1,14 | 17,75 | 0,2354 | 0,0113 | |||
| IWF / iShares Trust - iShares Russell 1000 Growth ETF | 0,00 | -2,84 | 0,90 | 14,23 | 0,1855 | 0,0035 | |||
| DSI / iShares Trust - iShares ESG MSCI KLD 400 ETF | 0,01 | -1,32 | 0,86 | 11,99 | 0,1771 | -0,0002 | |||
| SCHM / Schwab Strategic Trust - Schwab U.S. Mid-Cap ETF | 0,02 | -0,23 | 0,70 | 6,71 | 0,1445 | -0,0071 | |||
| ABBV / AbbVie Inc. | 0,00 | -0,38 | 0,49 | -11,75 | 0,1007 | -0,0272 | |||
| ABT / Abbott Laboratories | 0,00 | -53,86 | 0,44 | -52,71 | 0,0902 | -0,1236 | |||
| MELI / MercadoLibre, Inc. | 0,00 | 0,00 | 0,39 | 34,25 | 0,0808 | 0,0132 | |||
| SDY / SPDR Series Trust - SPDR S&P Dividend ETF | 0,00 | 0,00 | 0,37 | 0,00 | 0,0754 | -0,0091 | |||
| SPY / SPDR S&P 500 ETF | 0,00 | 0,00 | 0,36 | 10,67 | 0,0749 | -0,0011 | |||
| PM / Philip Morris International Inc. | 0,00 | 0,00 | 0,32 | 14,59 | 0,0665 | 0,0015 | |||
| VTV / Vanguard Index Funds - Vanguard Value ETF | 0,00 | -15,55 | 0,31 | -13,81 | 0,0645 | -0,0192 | |||
| ICE / Intercontinental Exchange, Inc. | 0,00 | -47,34 | 0,28 | -44,07 | 0,0585 | -0,0585 | |||
| LOW / Lowe's Companies, Inc. | 0,00 | -3,62 | 0,28 | -8,28 | 0,0572 | -0,0127 | |||
| TSM / Taiwan Semiconductor Manufacturing Company Limited - Depositary Receipt (Common Stock) | 0,00 | 0,25 | 0,0525 | 0,0525 | |||||
| SUSA / iShares Trust - iShares ESG Optimized MSCI USA ETF | 0,00 | 0,00 | 0,24 | 10,14 | 0,0494 | -0,0008 | |||
| BAC / Bank of America Corporation | 0,01 | 0,00 | 0,24 | 13,46 | 0,0488 | 0,0006 | |||
| PEP / PepsiCo, Inc. | 0,00 | -0,28 | 0,24 | -12,31 | 0,0486 | -0,0134 | |||
| IDEV / iShares Trust - iShares Core MSCI International Developed Markets ETF | 0,00 | 0,23 | 0,0466 | 0,0466 | |||||
| GOOG / Alphabet Inc. | 0,00 | 0,22 | 0,0459 | 0,0459 | |||||
| EXPD / Expeditors International of Washington, Inc. | 0,00 | -80,92 | 0,22 | -81,91 | 0,0459 | -0,2378 | |||
| PPG / PPG Industries, Inc. | 0,00 | 0,00 | 0,22 | 3,76 | 0,0457 | -0,0035 | |||
| ORCL / Oracle Corporation | 0,00 | 0,22 | 0,0444 | 0,0444 | |||||
| IWP / iShares Trust - iShares Russell Mid-Cap Growth ETF | 0,00 | 0,20 | 0,0422 | 0,0422 | |||||
| ENSG / The Ensign Group, Inc. | 0,00 | -100,00 | 0,00 | 0,0000 | |||||
| MDT / Medtronic plc | 0,00 | -100,00 | 0,00 | 0,0000 | |||||
| CSCO / Cisco Systems, Inc. | 0,00 | -100,00 | 0,00 | 0,0000 | |||||
| MET / MetLife, Inc. | 0,00 | -100,00 | 0,00 | 0,0000 | |||||
| ADI / Analog Devices, Inc. | 0,00 | -100,00 | 0,00 | 0,0000 | |||||
| ONEQ / Fidelity Commonwealth Trust - Fidelity Nasdaq Composite Index ETF | 0,00 | -100,00 | 0,00 | 0,0000 | |||||
| ELV / Elevance Health, Inc. | 0,00 | -100,00 | 0,00 | 0,0000 | |||||
| UNH / UnitedHealth Group Incorporated | 0,00 | -100,00 | 0,00 | 0,0000 | |||||
| CI / The Cigna Group | 0,00 | -100,00 | 0,00 | 0,0000 | |||||
| MRK / Merck & Co., Inc. | 0,00 | -100,00 | 0,00 | 0,0000 | |||||
| TRV / The Travelers Companies, Inc. | 0,00 | -100,00 | 0,00 | 0,0000 | |||||
| HON / Honeywell International Inc. | 0,00 | -100,00 | 0,00 | 0,0000 | |||||
| ACN / Accenture plc | 0,00 | -100,00 | 0,00 | 0,0000 | |||||
| AOS / A. O. Smith Corporation | 0,00 | -100,00 | 0,00 | 0,0000 | |||||
| WST / West Pharmaceutical Services, Inc. | 0,00 | -100,00 | 0,00 | 0,0000 | |||||
| SSD / Simpson Manufacturing Co., Inc. | 0,00 | -100,00 | 0,00 | 0,0000 | |||||
| APD / Air Products and Chemicals, Inc. | 0,00 | -100,00 | 0,00 | 0,0000 | |||||
| UFPI / UFP Industries, Inc. | 0,00 | -100,00 | 0,00 | 0,0000 | |||||
| NKE / NIKE, Inc. | 0,00 | -100,00 | 0,00 | 0,0000 | |||||
| GNTX / Gentex Corporation | 0,00 | -100,00 | 0,00 | 0,0000 | |||||
| GWW / W.W. Grainger, Inc. | 0,00 | -100,00 | 0,00 | 0,0000 | |||||
| RMD / ResMed Inc. | 0,00 | -100,00 | 0,00 | 0,0000 | |||||
| QCOM / QUALCOMM Incorporated | 0,00 | -100,00 | 0,00 | 0,0000 |