Statistiques de base
| Propriétaires institutionnels | 338 total, 318 long only, 5 short only, 15 long/short - change of -1,17% MRQ |
| Allocation moyenne du portefeuille | 0.3062 % - change of 47,81% MRQ |
| Actions institutionnelles (Long) | 22 149 833 (ex 13D/G) - change of -0,07MM shares -0,30% MRQ |
| Valeur institutionnelle (Long) | $ 1 963 967 USD ($1000) |
Participation institutionnels et actionnaires
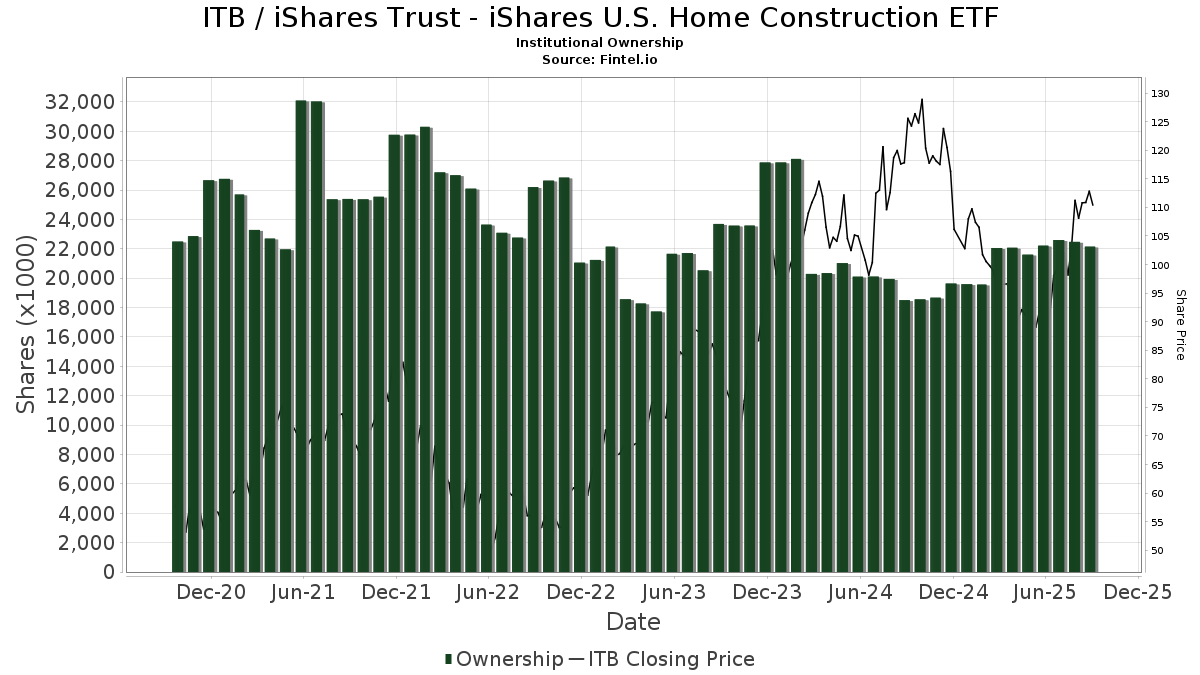
iShares Trust - iShares U.S. Home Construction ETF (US:ITB) détient 338 des propriétaires institutionnels et des actionnaires qui ont déposé des formulaires 13D/G ou 13F auprès de la Securities Exchange Commission (SEC). Ces institutions détiennent un total de 22,149,833 actions. Les principaux actionnaires incluent Bank Of America Corp /de/, Carronade Capital Management, LP, Morgan Stanley, Goldman Sachs Group Inc, Healthcare Of Ontario Pension Plan Trust Fund, UBS Group AG, Citadel Advisors Llc, Two Sigma Investments, Lp, Susquehanna International Group, Llp, and Jane Street Group, Llc .
iShares Trust - iShares U.S. Home Construction ETF (BATS:ITB) la structure de l'actionnariat institutionnel indique les positions actuelles des institutions et des fonds dans l'entreprise, ainsi que les derniers changements dans le volume des positions. Les principaux actionnaires peuvent être des investisseurs individuels, des fonds communs de placement, des fonds spéculatifs ou des institutions. L'annexe 13D indique que l'investisseur détient (ou a détenu) plus de 5 % de l'entreprise et qu'il a l'intention (ou a eu l'intention) de poursuivre activement un changement de stratégie commerciale. L'annexe 13G indique un investissement passif de plus de 5 %.
The share price as of September 12, 2025 is 113,69 / share. Previously, on September 13, 2024, the share price was 123,97 / share. This represents a decline of 8,29% over that period.
Indice de confiance des fonds
L'indice de confiance des fonds (anciennement score d'accumulation de participation) trouve les actions qui sont les plus achetées par les fonds. Il est le résultat d'un modèle quantitatif sophistiqué à plusieurs facteurs qui identifie les entreprises avec les niveaux les plus élevés d'accumulation institutionnelle. Le modèle de notation utilise une combinaison de l'augmentation totale des propriétaires déclarés, des variations des allocations de portefeuille chez ces propriétaires et d'autres indicateurs. Le chiffre varie de 0 à 100, les chiffres plus élevés indiquant un niveau d'accumulation plus élevé par rapport aux autres entreprises, 50 étant la moyenne.
Fréquence de mise à jour : Quotidienne
Ratio put/call institutionnel
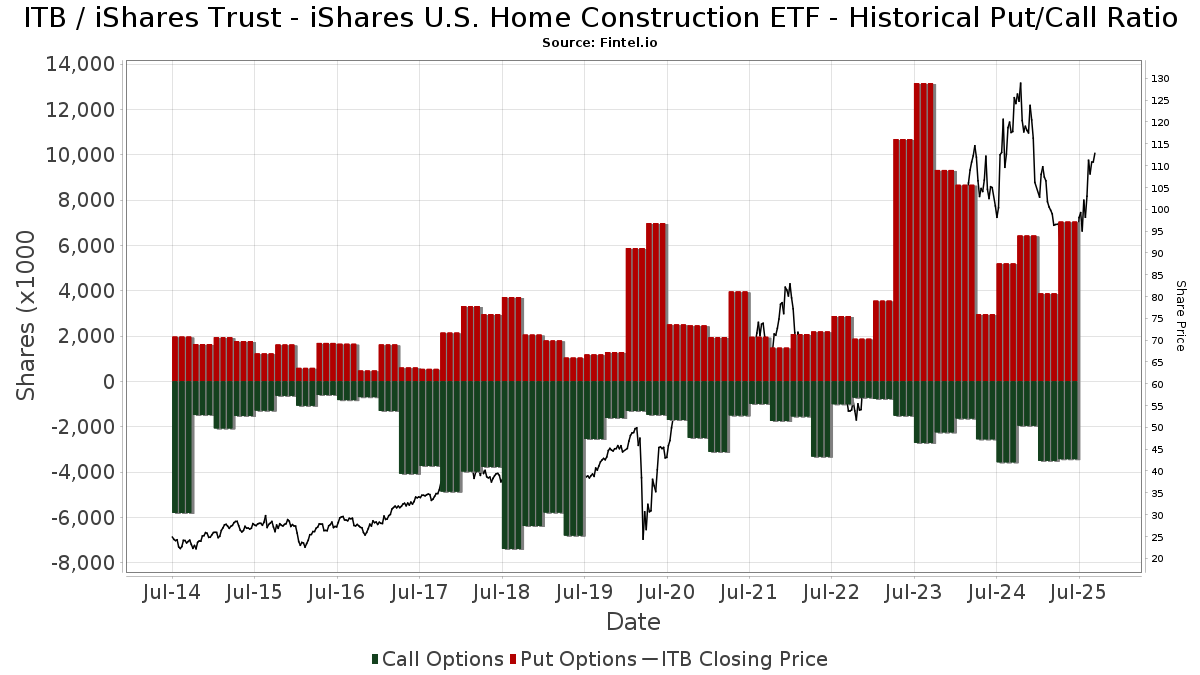
En plus de signaler les actions et les dettes standard, les institutions ayant plus de 100 millions d'actifs sous gestion doivent également divulguer leurs positions en options de vente et d'achat. Étant donné que les options de vente indiquent généralement une confiance négative, et les options d'achat indiquent une confiance positive, nous pouvons avoir une idée de la confiance institutionnelle globale en traçant le ratio des ventes à découvert par rapport aux achats d'options. Le graphique à droite trace l'historique du ratio des ventes à découvert/achats d'options pour cet instrument.
L'utilisation du ratio put/call comme indicateur de la confiance des investisseurs permet de pallier à l'une des principales lacunes de l'utilisation de la participation institutionnelle totale, à savoir qu'une part importante des actifs sous gestion est investie passivement pour suivre les indices. Les fonds gérés passivement n'achètent généralement pas d'options, de sorte que l'indicateur du ratio put/call suit de plus près la confiance des fonds gérés activement.
Déclarations 13F et NPORT
Les détails des déclarations 13F sont gratuits. Les détails des déclarations NP nécessitent une adhésion premium. Les lignes vertes indiquent de nouvelles positions. Les lignes rouges indiquent des positions clôturées. Cliquez sur l'icône du lien pour voir l'historique complet des transactions.
Mettre à niveau
pour débloquer des données premium et les exporter vers Excel ![]() .
.
| Date de dépôt | Source | Investisseur | Type | Prix moyen (Est) |
Actions | Δ Actions (%) |
Valeur déclarée (1000 $) |
Δ Valeur (%) |
Allocation de portefeuille (%) |
|
|---|---|---|---|---|---|---|---|---|---|---|
| 2025-08-08 | 13F | Kingsview Wealth Management, LLC | 5 513 | 0,13 | 514 | -2,10 | ||||
| 2025-07-15 | 13F | Cora Capital Advisors Llc | 3 547 | -55,23 | 330 | -56,23 | ||||
| 2025-08-14 | 13F | GWM Advisors LLC | 19 226 | -14,15 | 1 791 | -15,99 | ||||
| 2025-08-11 | 13F | Strategic Wealth Partners, Ltd. | 564 | -99,13 | 53 | -99,22 | ||||
| 2025-07-07 | 13F | RDA Financial Network | 10 005 | -0,21 | 932 | -2,31 | ||||
| 2025-08-26 | NP | WEEL - Peerless Option Income Wheel ETF | 5 300 | 0,00 | 494 | -2,18 | ||||
| 2025-05-06 | 13F | WESPAC Advisors SoCal, LLC | 0 | -100,00 | 0 | |||||
| 2025-08-14 | 13F | J. Goldman & Co LP | 0 | -100,00 | 0 | |||||
| 2025-08-14 | 13F | D. E. Shaw & Co., Inc. | 24 864 | 2 315 | ||||||
| 2025-08-28 | NP | TFAQX - TFA Quantitative Fund Class I | 11 500 | 146,25 | 1 071 | 141,22 | ||||
| 2025-07-14 | 13F | Sowell Financial Services LLC | 3 366 | 0,03 | 314 | -2,19 | ||||
| 2025-07-30 | 13F | Cullen/frost Bankers, Inc. | 14 | 0,00 | 1 | 0,00 | ||||
| 2025-07-11 | 13F | Grove Bank & Trust | 64 | 6 | ||||||
| 2025-08-14 | 13F | Quantum Capital Management, LLC / NJ | 1 899 | 1,99 | 177 | -0,56 | ||||
| 2025-08-14 | 13F | SummitTX Capital, L.P. | 12 060 | -50,13 | 1 124 | -51,22 | ||||
| 2025-08-12 | 13F | Jaffetilchin Investment Partners, LLC | 2 656 | -3,77 | 247 | -5,73 | ||||
| 2025-04-23 | 13F | Spirepoint Private Client, Llc | 0 | -100,00 | 0 | |||||
| 2025-08-07 | 13F | Resources Investment Advisors, LLC. | 0 | -100,00 | 0 | |||||
| 2025-08-08 | 13F | Creative Planning | 18 071 | -31,23 | 1 684 | -32,73 | ||||
| 2025-04-17 | 13F | Sound Income Strategies, LLC | 0 | 0 | ||||||
| 2025-07-31 | 13F | Oppenheimer & Co Inc | 7 117 | -4,11 | 663 | -6,09 | ||||
| 2025-08-06 | 13F | North Capital, Inc. | 493 | -40,24 | 46 | -42,31 | ||||
| 2025-08-14 | 13F | Polymer Capital Management (US) LLC | Call | 0 | -100,00 | 0 | ||||
| 2025-07-29 | 13F | Lyell Wealth Management, Lp | 6 983 | 47,01 | 651 | 43,81 | ||||
| 2025-08-05 | 13F | Bank of New York Mellon Corp | 2 518 | -25,37 | 235 | -27,10 | ||||
| 2025-08-08 | 13F | WP Advisors, LLC | 3 729 | -4,51 | 347 | -6,47 | ||||
| 2025-07-28 | 13F | Private Wealth Asset Management, LLC | 385 | 36 | ||||||
| 2025-08-13 | 13F | Everstar Asset Management, LLC | 0 | -100,00 | 0 | |||||
| 2025-08-14 | 13F | EP Wealth Advisors, Inc. | 1 931 | -30,56 | 180 | -32,20 | ||||
| 2025-08-12 | 13F | Steward Partners Investment Advisory, Llc | 7 171 | 25,72 | 668 | 23,02 | ||||
| 2025-04-09 | 13F | St Germain D J Co Inc | 0 | -100,00 | 0 | |||||
| 2025-08-14 | 13F | Napa Wealth Management | 0 | -100,00 | 0 | |||||
| 2025-08-14 | 13F | Vident Advisory, LLC | 2 621 | -0,19 | 244 | -2,40 | ||||
| 2025-08-04 | 13F | IFG Advisory, LLC | 2 218 | -33,23 | 207 | -34,81 | ||||
| 2025-08-13 | 13F | Beacon Pointe Advisors, LLC | 12 196 | 0,21 | 1 136 | -1,90 | ||||
| 2025-07-14 | 13F | Opal Wealth Advisors, LLC | 787 | -35,70 | 73 | -37,07 | ||||
| 2025-08-14 | 13F | Night Squared LP | 43 334 | 4 037 | ||||||
| 2025-04-22 | 13F | Synergy Financial Management, LLC | 0 | -100,00 | 0 | |||||
| 2025-08-12 | 13F | Park Square Financial Group, LLC | 50 | 0,00 | 5 | 0,00 | ||||
| 2025-07-17 | 13F | Nelson, Van Denburg & Campbell Wealth Management Group, LLC | 0 | -100,00 | 0 | |||||
| 2025-08-13 | 13F | Argyle Capital Partners, LLC | 4 077 | 380 | ||||||
| 2025-08-14 | 13F | Vista Investment Management | 2 203 | 0,00 | 205 | -1,91 | ||||
| 2025-08-12 | 13F | Retirement Planning Co of New England, Inc. | 8 465 | 0,34 | 789 | -1,87 | ||||
| 2025-05-09 | 13F | PrairieView Partners, LLC | 0 | -100,00 | 0 | |||||
| 2025-08-14 | 13F | CIBC World Markets Inc. | 3 936 | -15,32 | 367 | -17,19 | ||||
| 2025-07-31 | 13F | Guardian Asset Advisors, LLC | 4 204 | -10,95 | 393 | -12,89 | ||||
| 2025-07-02 | 13F | Crumly & Associates Inc. | 2 525 | -0,16 | 235 | -2,08 | ||||
| 2025-08-12 | 13F | Jefferies Financial Group Inc. | 0 | -100,00 | 0 | |||||
| 2025-08-14 | 13F | Synovus Financial Corp | 2 249 | -8,76 | 210 | -10,68 | ||||
| 2025-07-31 | 13F | Wealthfront Advisers Llc | 0 | -100,00 | 0 | |||||
| 2025-08-14 | 13F | Glen Eagle Advisors, LLC | 10 199 | 0,01 | 950 | -2,06 | ||||
| 2025-08-04 | 13F | Carret Asset Management, Llc | 2 229 | 0,00 | 208 | -2,36 | ||||
| 2025-07-28 | 13F | Axxcess Wealth Management, Llc | 407 477 | 11,44 | 37 965 | 9,05 | ||||
| 2025-07-31 | 13F/A | Interchange Capital Partners, LLC | 3 056 | -0,33 | 285 | -4,70 | ||||
| 2025-05-09 | 13F | Belvedere Trading LLC | 0 | -100,00 | 0 | |||||
| 2025-07-30 | 13F | D.a. Davidson & Co. | 12 947 | 4,32 | 1 206 | 2,12 | ||||
| 2025-08-05 | 13F | GPS Wealth Strategies Group, LLC | 346 | -8,22 | 32 | -8,57 | ||||
| 2025-08-08 | 13F | WASHINGTON TRUST Co | 0 | -100,00 | 0 | |||||
| 2025-08-18 | 13F | Hollencrest Capital Management | 0 | -100,00 | 0 | |||||
| 2025-05-13 | 13F | Great Diamond Partners, LLC | 0 | -100,00 | 0 | |||||
| 2025-07-10 | 13F | Wealth Enhancement Advisory Services, Llc | 3 625 | -90,58 | 349 | -90,48 | ||||
| 2025-08-14 | 13F | Scopus Asset Management, L.p. | 105 852 | -75,07 | 9 862 | -75,60 | ||||
| 2025-08-14 | 13F | Scopus Asset Management, L.p. | Put | 123 100 | 11 469 | |||||
| 2025-04-22 | 13F | Bright Futures Wealth Management, LLC. | 13 971 | -7,84 | 1 222 | -24,89 | ||||
| 2025-08-14 | 13F | Atom Investors LP | 63 733 | 5 938 | ||||||
| 2025-05-01 | 13F | Grant/GrossMendelsohn, LLC | 0 | -100,00 | 0 | |||||
| 2025-08-14 | 13F | Stansberry Asset Management, Llc | 20 102 | 9,28 | 1 873 | 6,91 | ||||
| 2025-08-19 | 13F | Delos Wealth Advisors, LLC | 10 | 1 | ||||||
| 2025-07-31 | 13F | Mader & Shannon Wealth Management, Inc. | 34 955 | 3 257 | ||||||
| 2025-07-17 | 13F | Janney Montgomery Scott LLC | 39 965 | 9,90 | 4 | 0,00 | ||||
| 2025-08-07 | 13F | Allworth Financial LP | 10 558 | -13,68 | 984 | -12,78 | ||||
| 2025-08-11 | 13F | Empowered Funds, LLC | 13 108 | 3,06 | 1 221 | 0,91 | ||||
| 2025-08-06 | 13F | Commonwealth Equity Services, Llc | 68 696 | -12,35 | 6 | -14,29 | ||||
| 2025-07-14 | 13F | UMA Financial Services, Inc. | 469 | 0,64 | 44 | -2,27 | ||||
| 2025-08-14 | 13F | Jane Street Group, Llc | Put | 707 900 | 46,29 | 65 955 | 43,16 | |||
| 2025-07-30 | 13F | Financial Perspectives, Inc | 365 | 0,00 | 34 | 0,00 | ||||
| 2025-08-18 | 13F | Wolverine Trading, Llc | Call | 90 000 | 44,00 | 8 388 | 42,22 | |||
| 2025-08-18 | 13F | Wolverine Trading, Llc | 19 548 | 74,69 | 1 822 | 72,44 | ||||
| 2025-08-14 | 13F | Jane Street Group, Llc | Call | 44 800 | 89,03 | 4 174 | 85,02 | |||
| 2025-05-16 | 13F | Coppell Advisory Solutions LLC | 0 | -100,00 | 0 | -100,00 | ||||
| 2025-08-14 | 13F | Boothbay Fund Management, Llc | Put | 0 | -100,00 | 0 | ||||
| 2025-08-19 | 13F | Advisory Services Network, LLC | 2 555 | -26,64 | 249 | -25,08 | ||||
| 2025-08-27 | 13F/A | Squarepoint Ops LLC | Put | 15 100 | 0,00 | 1 407 | -2,16 | |||
| 2025-04-11 | 13F | Sandbox Financial Partners, LLC | 0 | -100,00 | 0 | |||||
| 2025-08-27 | 13F/A | Squarepoint Ops LLC | Call | 4 600 | -44,58 | 429 | -45,82 | |||
| 2025-07-11 | 13F | Adirondack Trust Co | 180 | -44,62 | 17 | -46,67 | ||||
| 2025-08-12 | 13F | Proequities, Inc. | 0 | 0 | ||||||
| 2025-07-30 | 13F | Princeton Global Asset Management LLC | 145 | 0,00 | 14 | 0,00 | ||||
| 2025-05-12 | 13F | Sandy Spring Bank | 119 | 0,00 | 11 | -8,33 | ||||
| 2025-07-16 | 13F | Arlington Capital Management, Inc. | 0 | -100,00 | 0 | |||||
| 2025-04-23 | 13F | Creative Financial Designs Inc /adv | 0 | -100,00 | 0 | |||||
| 2025-08-05 | 13F | Simplex Trading, Llc | 134 719 | 13 | ||||||
| 2025-08-18 | 13F | Wolverine Trading, Llc | Put | 152 800 | 45,25 | 14 241 | 43,45 | |||
| 2025-08-28 | NP | GHTA - Goose Hollow Tactical Allocation ETF | 0 | -100,00 | 0 | -100,00 | ||||
| 2025-05-12 | 13F | Basso Capital Management, L.p. | 0 | -100,00 | 0 | |||||
| 2025-08-14 | 13F | Financial Advisory Service, Inc. | 0 | -100,00 | 0 | |||||
| 2025-08-14 | 13F | Fmr Llc | 13 645 | 2,88 | 1 271 | 0,71 | ||||
| 2025-08-27 | 13F/A | Squarepoint Ops LLC | 2 691 | 251 | ||||||
| 2025-05-14 | 13F | Oarsman Capital, Inc. | 0 | -100,00 | 0 | |||||
| 2025-04-15 | 13F | Ibex Wealth Advisors | 0 | -100,00 | 0 | |||||
| 2025-05-15 | 13F | Marshall Wace, Llp | 0 | -100,00 | 0 | -100,00 | ||||
| 2025-05-15 | 13F | Marshall Wace, Llp | Put | 0 | -100,00 | 0 | -100,00 | |||
| 2025-07-22 | 13F | IMC-Chicago, LLC | 19 330 | 1 801 | ||||||
| 2025-07-15 | 13F | Well Done, LLC | 0 | -100,00 | 0 | |||||
| 2025-07-24 | 13F | Blair William & Co/il | 1 066 | -50,78 | 99 | -51,94 | ||||
| 2025-08-13 | 13F | Capital Analysts, Inc. | 187 | 1 338,46 | 0 | |||||
| 2025-07-22 | 13F | SOL Capital Management CO | 22 040 | 0,00 | 2 | 0,00 | ||||
| 2025-04-23 | 13F | Terra Nova Asset Management LLC | 0 | -100,00 | 0 | |||||
| 2025-08-07 | 13F/A | Credit Industriel Et Commercial | 5 671 | 528 | ||||||
| 2025-08-08 | 13F | Gts Securities Llc | 0 | -100,00 | 0 | |||||
| 2025-08-14 | 13F | Citadel Advisors Llc | 8 375 | -96,80 | 780 | -96,87 | ||||
| 2025-08-14 | 13F | Citadel Advisors Llc | Put | 829 200 | -8,13 | 77 257 | -10,10 | |||
| 2025-08-06 | 13F | Prospera Financial Services Inc | 4 665 | 2,71 | 435 | 0,46 | ||||
| 2025-08-11 | 13F | Synergy Investment Management, LLC | 0 | -100,00 | 0 | |||||
| 2025-08-13 | 13F | EverSource Wealth Advisors, LLC | 0 | -100,00 | 0 | |||||
| 2025-08-12 | 13F | Trexquant Investment LP | 4 177 | 389 | ||||||
| 2025-08-07 | 13F/A | Credit Industriel Et Commercial | Put | 20 000 | 1 863 | |||||
| 2025-08-13 | 13F | Leuthold Group, Llc | 0 | -100,00 | 0 | |||||
| 2025-08-14 | 13F | Citadel Advisors Llc | Call | 599 800 | -13,15 | 55 883 | -15,01 | |||
| 2025-07-29 | 13F | Koshinski Asset Management, Inc. | 3 965 | -3,13 | 369 | -5,14 | ||||
| 2025-08-15 | 13F | Kestra Advisory Services, LLC | 16 242 | 10,56 | 1 513 | 8,23 | ||||
| 2025-08-14 | 13F | Mml Investors Services, Llc | 23 938 | 3,48 | 2 | 0,00 | ||||
| 2025-07-25 | 13F | Concurrent Investment Advisors, LLC | 6 232 | -13,49 | 581 | -15,33 | ||||
| 2025-08-14 | 13F | Lighthouse Investment Partners, LLC | 0 | -100,00 | 0 | |||||
| 2025-08-12 | 13F | XTX Topco Ltd | 11 353 | 1 058 | ||||||
| 2025-07-22 | 13F | Global Assets Advisory, LLC | 0 | -100,00 | 0 | |||||
| 2025-04-28 | 13F | Rosenberg Matthew Hamilton | 0 | -100,00 | 0 | |||||
| 2025-07-08 | 13F | Arlington Trust Co LLC | 18 | 0,00 | 2 | 0,00 | ||||
| 2025-05-20 | 13F/A | Colony Group, LLC | Call | 0 | -100,00 | 0 | ||||
| 2025-08-05 | 13F | W.G. Shaheen & Associates DBA Whitney & Co | 67 439 | 6 283 | ||||||
| 2025-07-18 | 13F | Trust Co Of Vermont | 1 757 | 30,92 | 164 | 28,35 | ||||
| 2025-07-25 | 13F | Cwm, Llc | 625 | -17,00 | 0 | |||||
| 2025-05-05 | 13F | Hazlett, Burt & Watson, Inc. | 0 | -100,00 | 0 | |||||
| 2025-04-10 | 13F | Park Edge Advisors, LLC | 0 | -100,00 | 0 | |||||
| 2025-08-11 | 13F | Nomura Asset Management Co Ltd | 0 | -100,00 | 0 | |||||
| 2025-08-28 | NP | TFAGX - TFA AlphaGen Growth Fund Class I | 7 900 | 27,42 | 736 | 24,75 | ||||
| 2025-08-13 | 13F | Northwestern Mutual Wealth Management Co | 26 639 | -8,72 | 2 482 | -10,69 | ||||
| 2025-04-09 | 13F | HBW Advisory Services LLC | 0 | -100,00 | 0 | -100,00 | ||||
| 2025-08-07 | 13F | PFG Advisors | 0 | -100,00 | 0 | |||||
| 2025-08-11 | 13F | Brown Brothers Harriman & Co | 1 018 | -50,73 | 95 | -52,04 | ||||
| 2025-08-14 | 13F | Alphadyne Asset Management, LLC | Call | 1 700 | 158 | |||||
| 2025-08-14 | 13F | Alphadyne Asset Management, LLC | 10 100 | 941 | ||||||
| 2025-07-08 | 13F | Nbc Securities, Inc. | 1 809 | 0,00 | 0 | |||||
| 2025-07-17 | 13F | SeaBridge Investment Advisors LLC | 5 560 | -12,67 | 518 | -14,52 | ||||
| 2025-08-14 | 13F | Bank Of America Corp /de/ | 6 964 804 | -3,67 | 648 911 | -5,73 | ||||
| 2025-05-16 | 13F | Arete Wealth Advisors, LLC | 0 | -100,00 | 0 | |||||
| 2025-07-10 | 13F | Trust Point Inc. | 2 308 | 0,00 | 215 | -1,83 | ||||
| 2025-08-11 | 13F | FSA Wealth Management LLC | 363 | 0,00 | 34 | -2,94 | ||||
| 2025-05-01 | 13F | Q3 Asset Management | 0 | -100,00 | 0 | |||||
| 2025-05-14 | 13F | Summit Financial, LLC | 0 | -100,00 | 0 | |||||
| 2025-08-08 | 13F/A | Ignite Planners, LLC | 2 326 | 0,00 | 221 | 3,76 | ||||
| 2025-08-14 | 13F | Bank Of America Corp /de/ | Put | 140 000 | -72,51 | 13 044 | -73,10 | |||
| 2025-05-13 | 13F | Eldridge Investment Advisors, Inc. | 0 | -100,00 | 0 | |||||
| 2025-07-25 | 13F | Atria Wealth Solutions, Inc. | 2 671 | -16,61 | 249 | -18,42 | ||||
| 2025-07-29 | 13F | Signature Estate & Investment Advisors Llc | 5 261 | 1,17 | 490 | -1,01 | ||||
| 2025-08-14 | 13F | Raymond James Financial Inc | 102 403 | -12,70 | 9 541 | -14,58 | ||||
| 2025-07-11 | 13F | Diversified Trust Co | 6 500 | -7,14 | 606 | -9,16 | ||||
| 2025-08-11 | 13F | Advisor Resource Council | 0 | -100,00 | 0 | |||||
| 2025-04-21 | 13F | Envestnet Portfolio Solutions, Inc. | 0 | -100,00 | 0 | |||||
| 2025-04-14 | 13F | Muirfield Wealth Advisors Llc | 0 | -100,00 | 0 | |||||
| 2025-05-05 | 13F | Csenge Advisory Group | 0 | -100,00 | 0 | |||||
| 2025-07-28 | 13F | BRYN MAWR TRUST Co | 1 248 | 11,23 | 116 | 9,43 | ||||
| 2025-08-14 | 13F | Bnp Paribas Arbitrage, Sa | 289 806 | -13,49 | 27 001 | -15,34 | ||||
| 2025-08-18 | 13F | Geneos Wealth Management Inc. | 1 097 | 0,00 | 102 | -1,92 | ||||
| 2025-07-28 | 13F | Duncker Streett & Co Inc | 16 | 0,00 | 1 | 0,00 | ||||
| 2025-07-29 | 13F | Cottonwood Capital Advisors, Llc | 54 354 | 0,93 | 5 064 | -1,23 | ||||
| 2025-07-30 | NP | EMPB - Efficient Market Portfolio Plus ETF | 12 648 | -303,77 | 1 132 | -284,50 | ||||
| 2025-05-15 | 13F | Amundi | 0 | -100,00 | 0 | |||||
| 2025-08-12 | 13F/A | Brightwater Advisory LLC | 5 365 | 0,00 | 500 | -2,16 | ||||
| 2025-08-14 | 13F | Peak6 Llc | Put | 1 100 | 102 | |||||
| 2025-08-14 | 13F | Peak6 Llc | Call | 52 400 | 177,25 | 4 882 | 171,37 | |||
| 2025-08-06 | 13F | Aspect Partners, LLC | 517 | 0,78 | 48 | 0,00 | ||||
| 2025-08-19 | 13F/A | Carronade Capital Management, LP | Put | 3 000 000 | 647 370 | |||||
| 2025-07-25 | 13F | SPC Financial, Inc. | 16 112 | -8,91 | 1 501 | -10,87 | ||||
| 2025-07-30 | 13F | Liberty One Investment Management, Llc | 4 879 | 4,39 | 455 | 2,02 | ||||
| 2025-08-11 | 13F | HighTower Advisors, LLC | 21 849 | -11,33 | 2 036 | -13,26 | ||||
| 2025-07-30 | 13F | Alexis Investment Partners, LLC | 3 993 | -6,11 | 372 | -7,92 | ||||
| 2025-08-04 | 13F | Creekmur Asset Management LLC | 100 | 9 | ||||||
| 2025-08-11 | 13F | Hopwood Financial Services, Inc. | 150 | 0,00 | 14 | -7,14 | ||||
| 2025-08-14 | 13F | Parallax Volatility Advisers, L.P. | Call | 6 800 | -77,70 | 634 | -78,19 | |||
| 2025-08-14 | 13F | MidWestOne Financial Group, Inc. | 7 020 | 0,00 | 654 | -2,10 | ||||
| 2025-04-11 | 13F | D. Scott Neal, Inc. | 0 | -100,00 | 0 | |||||
| 2025-08-13 | 13F | Quadrature Capital Ltd | 0 | -100,00 | 0 | |||||
| 2025-08-14 | 13F | Gallo Partners, LP | 0 | -100,00 | 0 | |||||
| 2025-08-14 | 13F | Sig Brokerage, Lp | Put | 84 500 | 7 873 | |||||
| 2025-07-29 | 13F | Werba Rubin Papier Wealth Management | 3 669 | 0,05 | 342 | -2,29 | ||||
| 2025-07-30 | 13F | FNY Investment Advisers, LLC | 1 751 | -41,63 | 0 | |||||
| 2025-05-15 | 13F | Barclays Plc | Put | 0 | -100,00 | 0 | -100,00 | |||
| 2025-08-14 | 13F | Parallax Volatility Advisers, L.P. | 689 | 68 800,00 | 64 | |||||
| 2025-08-26 | 13F/A | Thrivent Financial For Lutherans | 3 235 | -16,67 | 0 | |||||
| 2025-08-14 | 13F | Integrated Wealth Concepts LLC | 2 656 | -64,34 | 247 | -65,16 | ||||
| 2025-08-08 | 13F | Pnc Financial Services Group, Inc. | 2 781 | -11,55 | 259 | -13,38 | ||||
| 2025-08-12 | 13F | Nemes Rush Group LLC | 2 | 0 | ||||||
| 2025-04-14 | 13F | Patriot Financial Group Insurance Agency, LLC | 0 | -100,00 | 0 | -100,00 | ||||
| 2025-08-11 | 13F | Citigroup Inc | 87 532 | -40,49 | 8 155 | -41,76 | ||||
| 2025-08-14 | 13F | Parallax Volatility Advisers, L.P. | Put | 4 400 | -84,06 | 410 | -84,43 | |||
| 2025-07-10 | 13F | Wealth Enhancement Advisory Services, Llc | Put | 0 | -100,00 | 0 | -100,00 | |||
| 2025-07-16 | 13F/A | CX Institutional | 4 416 | 557,14 | 0 | |||||
| 2025-08-13 | 13F | Edgestream Partners, L.P. | 0 | -100,00 | 0 | |||||
| 2025-08-05 | 13F | Sigma Planning Corp | 0 | -100,00 | 0 | |||||
| 2025-07-18 | 13F | Bartlett & Co. Wealth Management Llc | 100 | 0,00 | 9 | 0,00 | ||||
| 2025-04-22 | 13F | Minichmacgregor Wealth Management, Llc | 0 | -100,00 | 0 | |||||
| 2025-08-14 | 13F | Toroso Investments, LLC | 5 300 | 0,00 | 494 | -2,18 | ||||
| 2025-05-14 | 13F | Snowden Capital Advisors LLC | 0 | -100,00 | 0 | -100,00 | ||||
| 2025-06-27 | NP | SECT - Main Sector Rotation ETF | 388 700 | -40,31 | 35 795 | -22,16 | ||||
| 2025-08-06 | 13F | AE Wealth Management LLC | 391 | -9,91 | 36 | -12,20 | ||||
| 2025-04-25 | 13F | Smallwood Wealth Investment Management, LLC | 105 | 10 | ||||||
| 2025-08-15 | 13F | Resources Management Corp /ct/ /adv | 8 | 0,00 | 0 | |||||
| 2025-05-15 | 13F | Glenmede Trust Co Na | 2 685 | 0,37 | 256 | -7,61 | ||||
| 2025-08-14 | 13F | Susquehanna International Group, Llp | 102 879 | -25,44 | 9 585 | -27,04 | ||||
| 2025-08-14 | 13F | Susquehanna International Group, Llp | Call | 664 200 | 14,91 | 61 884 | 12,45 | |||
| 2025-08-19 | 13F/A | Carronade Capital Management, LP | Call | 0 | -100,00 | 0 | -100,00 | |||
| 2025-08-14 | 13F | Susquehanna International Group, Llp | Put | 748 000 | 22,82 | 69 691 | 20,19 | |||
| 2025-08-19 | 13F/A | Carronade Capital Management, LP | 0 | -100,00 | 0 | -100,00 | ||||
| 2025-08-08 | 13F | Tortoise Investment Management, LLC | 335 | 0,00 | 31 | 0,00 | ||||
| 2025-08-19 | 13F | National Asset Management, Inc. | 0 | -100,00 | 0 | |||||
| 2025-08-08 | 13F | Capital Investment Advisory Services, LLC | 40 | 0,00 | 4 | 0,00 | ||||
| 2025-08-14 | 13F | Millennium Management Llc | Put | 134 200 | 22,33 | 12 503 | 19,71 | |||
| 2025-08-14 | 13F | Two Sigma Investments, Lp | 783 664 | 665,60 | 73 014 | 649,24 | ||||
| 2025-08-12 | 13F | LPL Financial LLC | 305 568 | 2,24 | 28 470 | 0,05 | ||||
| 2025-08-14 | 13F | Toronto Dominion Bank | 5 | 0,00 | 0 | |||||
| 2025-08-14 | 13F | Balyasny Asset Management Llc | Call | 0 | -100,00 | 0 | -100,00 | |||
| 2025-08-15 | 13F/A | MONECO Advisors, LLC | 0 | -100,00 | 0 | -100,00 | ||||
| 2025-08-08 | 13F | Cetera Investment Advisers | 73 830 | -21,08 | 6 879 | -22,78 | ||||
| 2025-07-30 | 13F | Brookstone Capital Management | 4 238 | -33,12 | 395 | -34,66 | ||||
| 2025-08-12 | 13F | Manchester Capital Management LLC | 2 360 | 0,00 | 220 | -2,23 | ||||
| 2025-08-15 | 13F | Morgan Stanley | 2 572 015 | 44,15 | 239 635 | 41,06 | ||||
| 2025-08-14 | 13F | Harwood Advisory Group, LLC | 313 | -0,32 | 29 | -9,37 | ||||
| 2025-07-08 | 13F | Juncture Wealth Strategies, Llc | 0 | -100,00 | 0 | |||||
| 2025-08-12 | 13F | Running Point Capital Advisors, LLC | 0 | -100,00 | 0 | |||||
| 2025-07-24 | 13F | Ronald Blue Trust, Inc. | 111 | -1,77 | 10 | 0,00 | ||||
| 2025-08-14 | 13F | Point72 Asset Management, L.P. | 119 701 | 11 153 | ||||||
| 2025-05-13 | 13F | Measured Risk Portfolios, Inc. | 0 | -100,00 | 0 | |||||
| 2025-07-17 | 13F | Hanson & Doremus Investment Management | 485 | 0,00 | 0 | |||||
| 2025-08-11 | 13F | United Capital Financial Advisers, Llc | 5 890 | -4,15 | 549 | -6,32 | ||||
| 2025-08-06 | 13F | Stonebridge Financial Planning Group, LLC | 8 850 | -39,72 | 825 | -41,02 | ||||
| 2025-08-07 | 13F | Commerce Bank | 10 817 | -7,74 | 1 008 | -9,77 | ||||
| 2025-08-13 | 13F | River Road Asset Management, LLC | 0 | -100,00 | 0 | |||||
| 2025-07-30 | 13F | Whittier Trust Co Of Nevada Inc | 283 | -8,12 | 26 | -10,34 | ||||
| 2025-05-14 | 13F | Bayview Asset Management, Llc | Put | 0 | -100,00 | 0 | -100,00 | |||
| 2025-08-13 | 13F | Scotia Capital Inc. | 34 940 | -34,79 | 3 255 | -36,19 | ||||
| 2025-08-14 | 13F | Comerica Bank | 478 | -72,34 | 45 | -73,17 | ||||
| 2025-05-14 | 13F | Capital Fund Management S.a. | 0 | -100,00 | 0 | -100,00 | ||||
| 2025-08-11 | 13F | Delta Asset Management Llc/tn | 246 | 0,00 | 23 | -4,35 | ||||
| 2025-08-14 | 13F | Boothbay Fund Management, Llc | Call | 96 700 | 504,38 | 9 010 | 491,53 | |||
| 2025-08-07 | 13F | Apeiron RIA LLC | 3 680 | -52,16 | 343 | -53,28 | ||||
| 2025-08-08 | 13F | Emerald Investment Partners, Llc | 0 | -100,00 | 0 | |||||
| 2025-08-13 | 13F | Walleye Trading LLC | Call | 40 900 | 207,52 | 3 811 | 200,95 | |||
| 2025-08-14 | 13F | Polymer Capital Management (US) LLC | 0 | -100,00 | 0 | |||||
| 2025-08-13 | 13F | Walleye Trading LLC | Put | 96 000 | 0,84 | 8 944 | -1,31 | |||
| 2025-08-13 | 13F | Walleye Trading LLC | 32 949 | 139,93 | 3 070 | 134,81 | ||||
| 2025-08-01 | 13F | Solstein Capital, LLC | 66 | 0,00 | 6 | 0,00 | ||||
| 2025-08-07 | 13F | Montag A & Associates Inc | 12 046 | -19,47 | 1 122 | -21,21 | ||||
| 2025-08-08 | 13F | Avantax Advisory Services, Inc. | 2 686 | -0,07 | 250 | -1,96 | ||||
| 2025-08-01 | 13F | Y-Intercept (Hong Kong) Ltd | 7 370 | 18,51 | 687 | 15,88 | ||||
| 2025-08-07 | 13F | Aspen Wealth Strategies, LLC | 2 333 | 217 | ||||||
| 2025-07-24 | 13F | Rice Partnership, LLC | 1 300 | 0,00 | 121 | -1,63 | ||||
| 2025-08-14 | 13F | Balyasny Asset Management Llc | 32 696 | 155,32 | 3 046 | 149,88 | ||||
| 2025-08-12 | 13F | Archer Investment Corp | 5 | 0,00 | 0 | |||||
| 2025-08-12 | 13F | Main Management LLC | 114 379 | 1 603,34 | 11 | |||||
| 2025-08-05 | 13F | Key FInancial Inc | 47 | 4 | ||||||
| 2025-07-17 | 13F | Sterling Investment Advisors, Ltd. | 5 769 | -1,27 | 538 | -3,42 | ||||
| 2025-08-14 | 13F | Balyasny Asset Management Llc | Put | 0 | -100,00 | 0 | -100,00 | |||
| 2025-08-12 | 13F | SRS Capital Advisors, Inc. | 40 | 4 | ||||||
| 2025-04-29 | 13F | Heritage Wealth Management, Inc. | 0 | -100,00 | 0 | |||||
| 2025-07-22 | 13F | Bank Hapoalim Bm | 3 246 | -12,06 | 0 | |||||
| 2025-08-13 | 13F | Financial Freedom, LLC | 1 251 | 0,72 | 117 | -1,69 | ||||
| 2025-08-14 | 13F | Goldman Sachs Group Inc | 1 944 882 | 2,74 | 181 205 | 0,53 | ||||
| 2025-07-30 | NP | ENDW - Cambria Endowment Style ETF | 63 | 6 | ||||||
| 2025-08-04 | 13F | Assetmark, Inc | 4 185 | 4,57 | 390 | 2,10 | ||||
| 2025-08-14 | 13F | Interval Partners, LP | Call | 43 000 | 4 006 | |||||
| 2025-07-25 | 13F | Prostatis Group LLC | 78 200 | 200,43 | 7 286 | 193,99 | ||||
| 2025-08-11 | 13F | Private Advisor Group, LLC | 50 580 | 1,99 | 4 713 | -0,19 | ||||
| 2025-08-04 | 13F | Arkadios Wealth Advisors | 3 744 | 74,46 | 349 | 70,59 | ||||
| 2025-08-11 | 13F | Y.D. More Investments Ltd | 8 700 | -12,12 | 811 | -14,01 | ||||
| 2025-08-13 | 13F | Walleye Capital LLC | 7 524 | -7,57 | 701 | -9,55 | ||||
| 2025-07-23 | 13F | Sachetta, LLC | 100 | 0,00 | 9 | 0,00 | ||||
| 2025-07-16 | 13F | Cambridge Advisors Inc. | 3 800 | 0,00 | 354 | -1,94 | ||||
| 2025-08-04 | 13F | Prairie Wealth Advisors, Inc. | 6 038 | -0,82 | 563 | -2,94 | ||||
| 2025-07-30 | 13F | Paul Damon & Associates, Inc. | 2 540 | 0,00 | 237 | -2,07 | ||||
| 2025-08-14 | 13F | Mariner, LLC | 13 202 | -40,35 | 1 230 | -41,62 | ||||
| 2025-09-04 | 13F/A | Advisor Group Holdings, Inc. | 36 728 | -0,54 | 3 426 | -2,59 | ||||
| 2025-08-14 | 13F | Stifel Financial Corp | 18 673 | -7,29 | 1 740 | -9,29 | ||||
| 2025-08-29 | 13F | Evolution Wealth Management Inc. | 181 | 17 | ||||||
| 2025-07-22 | 13F | DAVENPORT & Co LLC | 3 987 | 0,00 | 371 | -2,11 | ||||
| 2025-08-11 | 13F | Rothschild Investment Llc | 34 535 | 0,00 | 3 218 | -2,16 | ||||
| 2025-05-09 | 13F | GeoWealth Management, LLC | 0 | -100,00 | 0 | |||||
| 2025-07-29 | 13F | Kraft, Davis & Associates, LLC | 16 884 | 1 700 | ||||||
| 2025-08-28 | NP | TFAFX - Tactical Growth Allocation Fund Class I | 1 080 | 25,58 | 101 | 23,46 | ||||
| 2025-08-14 | 13F | Millennium Management Llc | 11 836 | 39,51 | 1 103 | 36,56 | ||||
| 2025-08-14 | 13F | Vienna Asset Management LLC | 0 | -100,00 | 0 | |||||
| 2025-08-05 | 13F | Huntington National Bank | 223 | -49,89 | 21 | -52,38 | ||||
| 2025-08-14 | 13F | Millennium Management Llc | Call | 432 300 | -26,19 | 40 277 | -27,77 | |||
| 2025-05-12 | 13F | Ciovacco Capital Management LLC | 0 | -100,00 | 0 | |||||
| 2025-07-21 | 13F | Barrett & Company, Inc. | 20 | 0,00 | 2 | 0,00 | ||||
| 2025-08-05 | 13F | Bank Of Montreal /can/ | 5 592 | 26,52 | 521 | 24,05 | ||||
| 2025-08-12 | 13F | Quantum Private Wealth, LLC | 8 059 | 0,00 | 751 | -2,22 | ||||
| 2025-08-14 | 13F | Hrt Financial Lp | 9 914 | 1 | ||||||
| 2025-05-09 | 13F | Headlands Technologies LLC | 0 | -100,00 | 0 | |||||
| 2025-08-14 | 13F | Benjamin Edwards Inc | 0 | -100,00 | 0 | |||||
| 2025-05-07 | 13F | Spectrum Wealth Counsel, LLC | 282 | -99,39 | 27 | -99,45 | ||||
| 2025-07-25 | 13F | Total Clarity Wealth Management, Inc. | 5 088 | -26,52 | 474 | -33,71 | ||||
| 2025-08-14 | 13F | Certified Advisory Corp | 4 687 | 1,08 | 437 | -1,13 | ||||
| 2025-07-31 | 13F | Cambridge Investment Research Advisors, Inc. | 60 582 | 7,11 | 6 | 0,00 | ||||
| 2025-08-13 | 13F | Elgethun Capital Management | 1 644 | 0,00 | 153 | -1,92 | ||||
| 2025-05-13 | 13F | Neuberger Berman Group LLC | 0 | -100,00 | 0 | |||||
| 2025-04-23 | 13F | Independent Solutions Wealth Management, LLC | 0 | -100,00 | 0 | |||||
| 2025-05-07 | 13F | Vista Private Wealth Partners. LLC | 0 | -100,00 | 0 | |||||
| 2025-07-30 | 13F | Evermay Wealth Management Llc | 58 | 0,00 | 5 | 0,00 | ||||
| 2025-07-31 | 13F | CNB Bank | 1 | 0,00 | 0 | |||||
| 2025-08-12 | 13F | Global Retirement Partners, LLC | 2 177 | -1,23 | 203 | -11,01 | ||||
| 2025-08-12 | 13F | MAI Capital Management | Call | 28 | -3,57 | |||||
| 2025-08-14 | 13F | Candlestick Capital Management LP | 338 276 | 31 517 | ||||||
| 2025-07-09 | 13F | FOCUS Wealth Advisors, LLC | 54 211 | 8,02 | 5 051 | 5,69 | ||||
| 2025-08-11 | 13F | Wealthgarden F.s. Llc | 4 122 | 0,00 | 402 | 2,30 | ||||
| 2025-08-04 | 13F | Pinnacle Associates Ltd | 16 235 | 0,62 | 1 513 | -1,56 | ||||
| 2025-07-22 | 13F | Valley National Advisers Inc | 0 | -100,00 | 0 | |||||
| 2025-08-14 | 13F | CoreCap Advisors, LLC | 3 | -94,00 | 0 | -100,00 | ||||
| 2025-08-14 | 13F | UBS Group AG | Call | 119 800 | 100,00 | 11 162 | 95,70 | |||
| 2025-08-14 | 13F | UBS Group AG | Put | 59 900 | 5 581 | |||||
| 2025-05-14 | 13F | Hudson Bay Capital Management LP | 0 | -100,00 | 0 | |||||
| 2025-08-14 | 13F | Federation des caisses Desjardins du Quebec | 22 250 | -5,20 | 2 073 | -7,21 | ||||
| 2025-08-14 | 13F | UBS Group AG | 984 887 | -15,77 | 91 762 | -17,58 | ||||
| 2025-08-13 | 13F | M&t Bank Corp | 14 175 | -2,84 | 1 321 | -4,97 | ||||
| 2025-08-19 | 13F | Anchor Investment Management, LLC | 423 | 0,00 | 39 | -2,50 | ||||
| 2025-08-11 | 13F | Outlook Wealth Advisors, LLC | 8 453 | -1,18 | 788 | -3,32 | ||||
| 2025-08-13 | 13F | Cerity Partners LLC | 5 556 | 125,03 | 518 | 120,00 | ||||
| 2025-08-13 | 13F | Giverny Capital Inc. | 11 518 | 5,08 | 1 073 | 2,88 | ||||
| 2025-09-12 | 13F/A | Valeo Financial Advisors, LLC | 2 187 | 0,00 | 204 | -2,40 | ||||
| 2025-08-12 | 13F | O'shaughnessy Asset Management, Llc | 1 101 | -8,40 | 103 | -10,53 | ||||
| 2025-07-24 | 13F | Us Bancorp \de\ | 6 713 | 2,68 | 625 | 0,48 | ||||
| 2025-08-13 | 13F | Marshall Wace, Llp | Call | 7 700 | 717 | |||||
| 2025-07-28 | 13F | Harbour Investments, Inc. | 3 001 | -1,25 | 280 | -3,46 | ||||
| 2025-04-28 | 13F | Strategic Financial Concepts, LLC | 0 | -100,00 | 0 | -100,00 | ||||
| 2025-05-14 | 13F | Caitlin John, LLC | 0 | -100,00 | 0 | |||||
| 2025-07-31 | 13F | Glass Jacobson Investment Advisors llc | 5 129 | 0,55 | 478 | -9,49 | ||||
| 2025-05-15 | 13F | Castleark Management Llc | 0 | -100,00 | 0 | |||||
| 2025-08-29 | 13F | Total Investment Management Inc | 3 | 0 | ||||||
| 2025-05-05 | 13F | Eagle Bay Advisors LLC | 0 | -100,00 | 0 | |||||
| 2025-08-01 | 13F | Advisory Alpha, LLC | 3 279 | 3,73 | 306 | 1,67 | ||||
| 2025-08-14 | 13F | Punch & Associates Investment Management, Inc. | 28 | 3 | ||||||
| 2025-07-14 | 13F | Abound Wealth Management | 22 | 0,00 | 2 | 0,00 | ||||
| 2025-08-12 | 13F | Founders Financial Alliance, LLC | 70 | -50,35 | 7 | -53,85 | ||||
| 2025-08-12 | 13F | Franklin Resources Inc | 200 | 19 | ||||||
| 2025-08-06 | 13F | Legacy Wealth Managment, LLC/ID | 28 | 0,00 | 3 | 0,00 | ||||
| 2025-04-22 | 13F | Castleview Partners, Llc | 0 | -100,00 | 0 | |||||
| 2025-08-06 | 13F | Golden State Wealth Management, LLC | 272 | 0,74 | 25 | 0,00 | ||||
| 2025-07-14 | 13F | AdvisorNet Financial, Inc | 4 575 | -21,42 | 426 | -23,10 | ||||
| 2025-08-15 | 13F | Provenance Wealth Advisors, LLC | 1 273 | -8,68 | 119 | -10,61 | ||||
| 2025-07-25 | 13F | NorthRock Partners, LLC | 200 | 0,00 | 19 | -5,26 | ||||
| 2025-08-14 | 13F | Wells Fargo & Company/mn | 386 296 | -25,55 | 35 991 | -27,14 | ||||
| 2025-08-12 | 13F | MAI Capital Management | 10 806 | 3,47 | 1 007 | 1,21 | ||||
| 2025-08-14 | 13F | Abound Financial, Llc | 0 | -100,00 | 0 | |||||
| 2025-08-01 | 13F | Capital Investment Counsel, LLC | 2 680 | 0,00 | 250 | -2,35 | ||||
| 2025-07-15 | 13F | Peddock Capital Advisors, Llc | 4 866 | -70,05 | 453 | -70,70 | ||||
| 2025-07-22 | 13F | Wealthcare Advisory Partners LLC | 0 | -100,00 | 0 | |||||
| 2025-08-11 | 13F | TD Waterhouse Canada Inc. | 422 | -77,58 | 39 | -78,21 | ||||
| 2025-08-12 | 13F | AlphaCore Capital LLC | 0 | -100,00 | 0 | |||||
| 2025-08-14 | 13F | LMR Partners LLP | Call | 0 | -100,00 | 0 | ||||
| 2025-07-29 | 13F | Stephens Inc /ar/ | 5 858 | -13,74 | 546 | -15,63 | ||||
| 2025-05-15 | 13F | Crestline Management, LP | 0 | -100,00 | 0 | |||||
| 2025-07-28 | 13F | Twin Tree Management, LP | Put | 79 600 | 7 416 | |||||
| 2025-08-29 | 13F | Centaurus Financial, Inc. | 0 | -100,00 | 0 | |||||
| 2025-08-14 | 13F | Menora Mivtachim Holdings Ltd. | 8 000 | -99,36 | 745 | -99,38 | ||||
| 2025-08-14 | 13F/A | Barclays Plc | 91 144 | -19,26 | 8 | -20,00 | ||||
| 2025-04-22 | 13F | PFG Investments, LLC | 0 | -100,00 | 0 | |||||
| 2025-07-10 | 13F | Secure Asset Management, LLC | 2 716 | -1,38 | 253 | -3,44 | ||||
| 2025-07-30 | 13F | Clifford Swan Investment Counsel Llc | 8 427 | 0,00 | 785 | -2,12 | ||||
| 2025-08-14 | 13F | Royal Bank Of Canada | 137 658 | -65,51 | 12 826 | -66,25 | ||||
| 2025-08-01 | 13F | Zhang Financial LLC | 0 | -100,00 | 0 | |||||
| 2025-08-14 | 13F | Ameriprise Financial Inc | 137 643 | 83,87 | 12 829 | 80,41 | ||||
| 2025-08-14 | 13F | Schonfeld Strategic Advisors LLC | Put | 65 000 | 6 056 | |||||
| 2025-07-24 | 13F | Wealthstar Advisors, Llc | 3 014 | 0,13 | 281 | -2,10 | ||||
| 2025-08-07 | 13F | Kestra Private Wealth Services, Llc | 7 912 | 9,40 | 737 | 7,12 | ||||
| 2025-08-14 | 13F | Tudor Investment Corp Et Al | 12 204 | -67,01 | 1 137 | -67,72 | ||||
| 2025-07-31 | 13F | Orion Capital Management LLC | 108 | 6,93 | 10 | 11,11 | ||||
| 2025-08-11 | 13F | Aptus Capital Advisors, LLC | 659 | 0,00 | 61 | -1,61 | ||||
| 2025-08-12 | 13F | Bokf, Na | 205 | 0,00 | 19 | 0,00 | ||||
| 2025-08-05 | 13F | Beckerman Institutional, LLC | 8 215 | 0,00 | 1 | |||||
| 2025-07-02 | 13F | Central Pacific Bank - Trust Division | 16 | 0,00 | 1 | 0,00 | ||||
| 2025-08-04 | 13F | Spire Wealth Management | 2 244 | -9,99 | 209 | -11,81 | ||||
| 2025-08-01 | 13F | Redwood Park Advisors LLC | 380 | 0,26 | 35 | -2,78 | ||||
| 2025-05-15 | 13F | Two Sigma Securities, Llc | 0 | -100,00 | 0 | -100,00 | ||||
| 2025-08-11 | 13F | Principal Securities, Inc. | 60 | -85,95 | 6 | -88,64 | ||||
| 2025-08-14 | 13F | Junto Capital Management LP | 0 | -100,00 | 0 | |||||
| 2025-08-14 | 13F | Gerber Kawasaki Wealth & Investment Management | 51 734 | -17,73 | 4 820 | -19,49 | ||||
| 2025-07-21 | 13F | DHJJ Financial Advisors, Ltd. | 130 | 0,00 | 12 | 0,00 | ||||
| 2025-07-24 | 13F | IFP Advisors, Inc | 14 341 | -59,64 | 1 336 | -60,51 | ||||
| 2025-07-21 | 13F | Jmac Enterprises Llc | 12 329 | -74,97 | 1 149 | -75,52 | ||||
| 2025-08-13 | 13F | Mount Yale Investment Advisors, LLC | 737 | 69 | ||||||
| 2025-04-30 | 13F | Pekin Hardy Strauss, Inc. | 0 | -100,00 | 0 | |||||
| 2025-08-14 | 13F | BW Gestao de Investimentos Ltda. | Put | 200 000 | 18 634 | |||||
| 2025-08-14 | 13F | KKM Financial LLC | 9 363 | -3,44 | 872 | -5,53 | ||||
| 2025-07-21 | 13F | Ameritas Advisory Services, LLC | 205 | -97,03 | 19 | -97,32 | ||||
| 2025-07-28 | 13F | RFG Advisory, LLC | 6 495 | -10,05 | 605 | -11,94 | ||||
| 2025-08-01 | 13F | Envestnet Asset Management Inc | 26 836 | -9,04 | 2 500 | -10,97 | ||||
| 2025-08-13 | 13F | Bayview Asset Management, Llc | Call | 19 500 | -62,43 | 1 817 | -63,25 | |||
| 2025-08-14 | 13F | Graham Capital Management, L.P. | 0 | -100,00 | 0 | |||||
| 2025-07-21 | 13F | Ameriflex Group, Inc. | 64 | -3,03 | 6 | -16,67 | ||||
| 2025-08-15 | 13F | Equitable Holdings, Inc. | 16 268 | -17,43 | 1 516 | -19,20 | ||||
| 2025-07-24 | 13F | Thompson Investment Management, Inc. | 350 | 0,00 | 33 | -3,03 | ||||
| 2025-08-14 | 13F/A | Rockefeller Capital Management L.P. | 10 893 | 1 015 | ||||||
| 2025-08-14 | 13F | Jupiter Wealth Management LLC | 10 000 | 1 112 | ||||||
| 2025-08-12 | 13F | J.w. Cole Advisors, Inc. | 2 346 | -8,50 | 219 | -10,66 | ||||
| 2025-07-22 | 13F | Keudell/Morrison Wealth Management | 2 767 | 0,00 | 258 | -2,28 | ||||
| 2025-08-15 | 13F | Morse Asset Management, Inc | 0 | -100,00 | 0 | |||||
| 2025-08-11 | 13F | One Capital Management, LLC | 4 211 | -1,66 | 392 | -3,69 | ||||
| 2025-08-13 | 13F | Jones Financial Companies Lllp | 13 619 | 1,14 | 1 269 | -0,08 | ||||
| 2025-08-08 | 13F | Family Firm, Inc. | 10 167 | 13,59 | 947 | 11,15 | ||||
| 2025-07-07 | 13F | Investors Research Corp | 150 | 0,00 | 14 | -7,14 | ||||
| 2025-08-27 | NP | FFOX - FundX Future Fund Opportunities ETF | 1 479 | 138 | ||||||
| 2025-04-23 | 13F | Mascagni Wealth Management, Inc. | 0 | -100,00 | 0 | -100,00 | ||||
| 2025-08-12 | 13F | Main Management ETF Advisors, LLC | 389 778 | 36 | ||||||
| 2025-08-13 | 13F | Healthcare Of Ontario Pension Plan Trust Fund | 1 154 000 | 0,00 | 107 518 | -2,14 | ||||
| 2025-05-01 | 13F | LRI Investments, LLC | 0 | -100,00 | 0 | -100,00 | ||||
| 2025-05-13 | 13F | SHEPHERD WEALTH MANAGEMENT Ltd LIABILITY Co | 0 | -100,00 | 0 | |||||
| 2025-08-13 | 13F | Kilter Group LLC | 1 714 | 160 | ||||||
| 2025-08-13 | 13F | Truvestments Capital Llc | 25 | -81,62 | 2 | -83,33 | ||||
| 2025-05-13 | 13F | Quantbot Technologies LP | 0 | -100,00 | 0 | |||||
| 2025-08-14 | 13F | Wiley Bros.-aintree Capital, Llc | 10 913 | -6,27 | 1 017 | -7,47 | ||||
| 2025-08-12 | 13F | Jpmorgan Chase & Co | 378 207 | 38,82 | 35 238 | 35,85 | ||||
| 2025-04-14 | 13F | Park Avenue Securities Llc | 0 | -100,00 | 0 | |||||
| 2025-08-14 | 13F | Shay Capital LLC | 12 500 | 1 165 | ||||||
| 2025-08-13 | 13F | Bank Of Nova Scotia | 10 995 | -1,79 | 1 024 | -3,85 | ||||
| 2025-07-10 | 13F | Peoples Bank/KS | 0 | -100,00 | 0 | |||||
| 2025-08-13 | 13F | Bank Of Nova Scotia | Put | 2 600 | 0,00 | 242 | -2,02 | |||
| 2025-05-13 | 13F | Russell Investments Group, Ltd. | 0 | -100,00 | 0 | |||||
| 2025-07-29 | 13F | Stratos Wealth Partners, LTD. | 0 | -100,00 | 0 | |||||
| 2025-04-22 | 13F | Genesee Capital Advisors, LLC | 0 | -100,00 | 0 | |||||
| 2025-08-14 | 13F | Candlestick Capital Management LP | Put | 0 | -100,00 | 0 | -100,00 | |||
| 2025-08-12 | 13F | CIBC Private Wealth Group, LLC | 3 172 | 46,04 | 296 | 59,46 | ||||
| 2025-08-14 | 13F | Scopus Asset Management, L.p. | Call | 0 | -100,00 | 0 | ||||
| 2025-08-14 | 13F | Mission Creek Capital Partners, Inc. | 10 300 | 0,63 | 960 | -1,54 | ||||
| 2025-07-31 | 13F/A | Avion Wealth | 1 327 | 0,00 | 0 | |||||
| 2025-08-08 | 13F | Meridian Wealth Management, LLC | 17 568 | 4,57 | 1 637 | 2,31 | ||||
| 2025-08-13 | 13F | Oribel Capital Management, LP | Call | 509 400 | 47 461 | |||||
| 2025-08-18 | 13F/A | National Bank Of Canada /fi/ | 80 479 | 2 187,64 | 7 876 | 2 257,78 | ||||
| 2025-07-18 | 13F | Parsons Capital Management Inc/ri | 17 584 | -1,22 | 1 638 | -3,31 | ||||
| 2025-07-18 | 13F | Institute for Wealth Management, LLC. | 2 150 | 0,00 | 200 | -1,96 | ||||
| 2025-05-15 | 13F | Aprio Wealth Management, LLC | 0 | -100,00 | 0 | |||||
| 2025-08-06 | 13F | Atlantic Union Bankshares Corp | 119 | 11 | ||||||
| 2025-08-14 | 13F | Glenmede Investment Management, LP | 2 675 | 249 | ||||||
| 2025-08-13 | 13F | Millstone Evans Group, LLC | 936 | 0,00 | 87 | -2,25 | ||||
| 2025-04-21 | 13F | PSI Advisors, LLC | 0 | -100,00 | 0 | |||||
| 2025-07-22 | 13F | Kessler Investment Group, LLC | 5 | 0,00 | 1 | |||||
| 2025-05-08 | 13F | Carl P. Sherr & Co., LLC | 0 | -100,00 | 0 | |||||
| 2025-08-19 | 13F | Newbridge Financial Services Group, Inc. | 7 | 0,00 | 1 | |||||
| 2025-07-07 | 13F | Wilson & Boucher Capital Management, LLC | 9 299 | -6,30 | 866 | -8,26 | ||||
| 2025-07-14 | 13F | Cathy Pareto & Associates, Inc | 3 025 | -11,91 | 282 | -13,80 | ||||
| 2025-07-11 | 13F | Farther Finance Advisors, LLC | 522 | 64,67 | 49 | 60,00 | ||||
| 2025-05-05 | 13F | Miller Financial Services LLC | 0 | -100,00 | 0 | |||||
| 2025-08-06 | 13F | Legacy Investment Solutions, LLC | 28 | -74,07 | 3 | -81,82 | ||||
| 2025-08-04 | 13F | Canton Hathaway, LLC | 395 | 0,00 | 0 | |||||
| 2025-07-24 | 13F | Costello Asset Management, INC | 2 262 | 17,08 | 211 | 14,75 | ||||
| 2025-08-07 | 13F | CENTRAL TRUST Co | 23 | 0,00 | 2 | 0,00 | ||||
| 2025-08-14 | 13F | Qube Research & Technologies Ltd | 588 556 | 1 142,99 | 54 836 | 1 116,39 | ||||
| 2025-08-14 | 13F | Mercer Global Advisors Inc /adv | 2 410 | -23,61 | 225 | -25,33 | ||||
| 2025-08-14 | 13F | Schonfeld Strategic Advisors LLC | 0 | -100,00 | 0 | -100,00 | ||||
| 2025-08-14 | 13F | Riggs Asset Managment Co. Inc. | 70 | -55,70 | 7 | -60,00 | ||||
| 2025-08-12 | 13F | Agur Provident & Training Funds Management Ltd | 74 400 | -36,08 | 7 | -45,45 | ||||
| 2025-07-09 | 13F | Lake Hills Wealth Management, LLC | 0 | -100,00 | 0 | |||||
| 2025-07-21 | 13F | Washington Growth Strategies Llc | 35 008 | 36 750,53 | 3 | 0,00 | ||||
| 2025-08-14 | 13F | Jane Street Group, Llc | 148 041 | -17,00 | 13 793 | -18,78 | ||||
| 2025-08-14 | 13F | Coastal Bridge Advisors, LLC | 2 529 | -5,63 | 236 | -7,84 | ||||
| 2025-07-07 | 13F | Capital Asset Advisory Services LLC | 421 086 | 11,54 | 40 900 | 12,14 | ||||
| 2025-08-07 | 13F | Flagship Wealth Advisors, Llc | 216 | -39,33 | 20 | -39,39 | ||||
| 2025-08-13 | 13F | Capital Fund Management S.a. | Call | 694 100 | 5,60 | 64 669 | 3,34 | |||
| 2025-08-11 | 13F | Bulltick Wealth Management, LLC | 77 453 | -0,07 | 7 216 | -2,21 | ||||
| 2025-08-13 | 13F | Capital Fund Management S.a. | Put | 587 300 | 48,08 | 54 719 | 44,91 | |||
| 2025-07-18 | 13F | Truist Financial Corp | 9 220 | 1,69 | 859 | -0,46 | ||||
| 2025-05-06 | 13F | Atria Investments Llc | 0 | -100,00 | 0 | |||||
| 2025-08-15 | 13F | WFA of San Diego, LLC | 1 778 | 0,00 | 166 | -26,67 | ||||
| 2025-08-11 | 13F | Howard Wealth Management, Llc | 3 030 | 0,17 | 282 | -2,08 | ||||
| 2025-05-12 | 13F | Empirical Asset Management, LLC | 0 | -100,00 | 0 | |||||
| 2025-07-30 | 13F | Fiduciary Planning LLC | 3 333 | -15,51 | 311 | -17,33 | ||||
| 2025-08-14 | 13F | Colony Group, LLC | 26 681 | -0,35 | 2 486 | -2,13 | ||||
| 2025-07-16 | 13F | Signaturefd, Llc | 97 | 0,00 | 9 | 0,00 | ||||
| 2025-07-08 | 13F | Parallel Advisors, LLC | 86 | -18,87 | 8 | -30,00 | ||||
| 2025-07-23 | 13F | RMG Wealth Management LLC | 710 | 67 | ||||||
| 2025-07-25 | 13F | Riverpoint Wealth Management Holdings, LLC | 8 554 | 0,74 | 797 | -1,49 | ||||
| 2025-08-08 | 13F | Larson Financial Group LLC | 282 | 0,00 | 26 | 0,00 | ||||
| 2025-08-13 | 13F | ExodusPoint Capital Management, LP | 0 | -100,00 | 0 | |||||
| 2025-08-26 | NP | LCR - Leuthold Core ETF | 0 | -100,00 | 0 | -100,00 | ||||
| 2025-08-11 | 13F | Lcnb Corp | 2 285 | -4,19 | 213 | -6,61 | ||||
| 2025-08-15 | 13F | Sender Co & Partners, Inc. | 11 349 | 1 057 | ||||||
| 2025-05-13 | 13F | Cookson Peirce & Co Inc | 0 | -100,00 | 0 | |||||
| 2025-08-11 | 13F | Hexagon Capital Partners LLC | 0 | -100,00 | 0 | |||||
| 2025-08-12 | 13F | BlackRock, Inc. | 8 893 | 0,00 | 829 | -2,13 | ||||
| 2025-04-16 | 13F/A | Western Wealth Management, LLC | 0 | -100,00 | 0 | |||||
| 2025-07-23 | 13F | H&H Retirement Design & Management INC | 11 184 | 13,40 | 1 060 | 22,97 | ||||
| 2025-07-15 | 13F | Fifth Third Bancorp | 147 | 14 | ||||||
| 2025-05-12 | 13F | Citigroup Inc | Call | 0 | -100,00 | 0 | -100,00 | |||
| 2025-08-05 | 13F | Obermeyer Wood Investment Counsel, Lllp | 2 200 | 205 | ||||||
| 2025-08-08 | 13F | Cedar Wealth Management, LLC | 500 | 0,00 | 47 | -2,13 | ||||
| 2025-05-27 | 13F | Advisors Capital Management, LLC | 0 | -100,00 | 0 | |||||
| 2025-04-22 | 13F | Retirement Planning Group, Llc / Ny | 0 | -100,00 | 0 | |||||
| 2025-07-10 | 13F | Oliver Lagore Vanvalin Investment Group | 145 | 15,08 | 14 | 0,00 | ||||
| 2025-05-14 | 13F | Flow Traders U.s. Llc | 0 | -100,00 | 0 | |||||
| 2025-08-14 | 13F | Sunbelt Securities, Inc. | 1 639 | 40,81 | 169 | 53,64 | ||||
| 2025-07-14 | 13F | Farmers Trust Co | 2 867 | 0,00 | 267 | -1,84 | ||||
| 2025-05-15 | 13F | Tobias Financial Advisors, Inc. | 0 | -100,00 | 0 | |||||
| 2025-08-15 | 13F | Tower Research Capital LLC (TRC) | 5 147 | 257 250,00 | 480 |