Statistiques de base
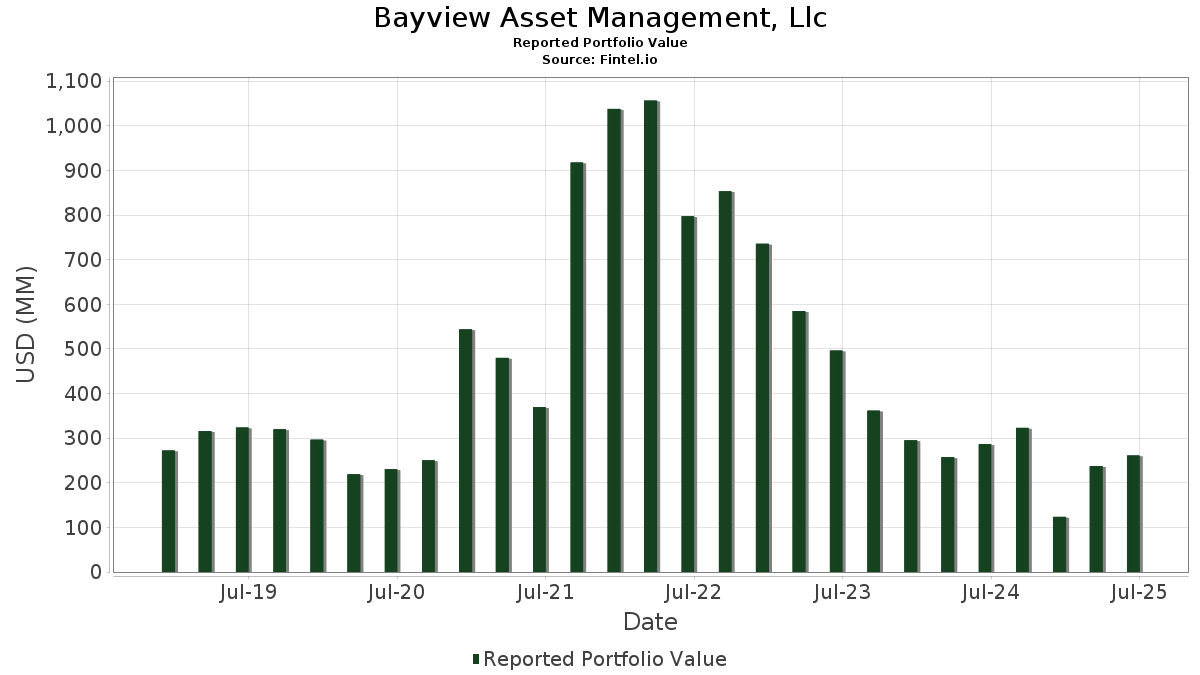
| Valeur du portefeuille | $ 261 190 343 |
| Positions actuelles | 57 |
Dernières positions, performances, ASG (à partir des dépôts 13F, 13D)
Bayview Asset Management, Llc a déclaré un total de 57 positions dans ses derniers dépôts auprès de la SEC. La valeur la plus récente du portefeuille est calculée à 261 190 343 USD. Les actifs sous gestion réels (ASG) sont cette valeur plus les liquidités (qui ne sont pas divulguées). Les principales positions de Bayview Asset Management, Llc sont SPDR S&P 500 ETF (US:SPY) , Guild Holdings Company (US:GHLD) , Banc of California, Inc. (US:BANC) , Berkshire Hills Bancorp, Inc. (US:BHLB) , and SPDR Series Trust - SPDR S&P Regional Banking ETF (US:KRE) . Les nouvelles positions de Bayview Asset Management, Llc incluent The Travelers Companies, Inc. (US:TRV) , The Hartford Insurance Group, Inc. (US:HIG) , Annaly Capital Management, Inc. (US:NLY) , Zions Bancorporation, National Association (US:ZION) , and The Allstate Corporation (US:ALL) . Les principales industries de Bayview Asset Management, Llc sont "Real Estate" (sic 65) , "Holding And Other Investment Offices" (sic 67) , and "Non-depository Credit Institutions" (sic 61) .
Meilleures augmentations ce trimestre
Nous utilisons la variation de l'allocation du portefeuille car il s'agit de l'indicateur le plus significatif. Les changements peuvent être dus à des transactions ou à des variations de prix des actions.
| Titre | Actions (en millions) |
Valeur ($ en millions) |
% du portefeuille | ΔPortefeuille % |
|---|---|---|---|---|
| 1,60 | 31,55 | 12,0793 | 1,7987 | |
| 0,04 | 4,10 | 1,5697 | 1,5697 | |
| 0,04 | 3,23 | 1,2383 | 1,2383 | |
| 0,02 | 5,80 | 2,2199 | 1,1871 | |
| 0,01 | 2,68 | 1,0243 | 1,0243 | |
| 0,02 | 2,54 | 0,9715 | 0,9715 | |
| 0,12 | 2,35 | 0,9007 | 0,9007 | |
| 0,05 | 2,26 | 0,8662 | 0,8662 | |
| 0,05 | 2,26 | 0,8662 | 0,8662 | |
| 0,05 | 2,15 | 0,8230 | 0,8230 |
Principales baisses ce trimestre
Nous utilisons la variation de l'allocation du portefeuille car il s'agit de l'indicateur le plus significatif. Les changements peuvent être dus à des transactions ou à des variations de prix des actions.
| Titre | Actions (en millions) |
Valeur ($ en millions) |
% du portefeuille | ΔPortefeuille % |
|---|---|---|---|---|
| 0,16 | 100,22 | 38,3687 | -2,3782 | |
| 0,02 | 1,82 | 0,6956 | -1,3850 | |
| 0,12 | 7,42 | 2,8423 | -1,3466 | |
| 0,00 | 0,00 | -0,6908 | ||
| 0,99 | 13,95 | 5,3423 | -0,5914 | |
| 0,00 | 0,00 | -0,5219 | ||
| 0,34 | 8,63 | 3,3058 | -0,4822 | |
| 0,00 | 0,31 | 0,1201 | -0,4087 | |
| 0,01 | 1,27 | 0,4854 | -0,3578 | |
| 0,00 | 0,63 | 0,2414 | -0,3148 |
Déclarations 13D/G
Il s'agit d'une liste des déclarations 13D et 13G déposées au cours de la dernière année (le cas échéant). Cliquez sur l'icône du lien pour voir l'historique complet des transactions. Les lignes vertes indiquent de nouvelles positions. Les lignes rouges indiquent des positions fermées.
| Date de dépôt | Formulaire | Titre | Actions précédentes |
Actions actuelles |
ΔActions % | % de participation |
% ΔParticipation | |
|---|---|---|---|---|---|---|---|---|
| 2025-01-14 | GHLD / Guild Holdings Company | 1 226 873 | 1 500 517 | 22,30 | 7,10 | 20,34 |
Déclarations 13F et dépôts de fonds
Ce formulaire a été déposé le 2025-08-13 pour la période de déclaration 2025-06-30. Cliquez sur l'icône du lien pour voir l'historique complet des transactions.
Mettre à niveau pour débloquer les données premium et exporter vers Excel ![]() .
.
| Titre | Type | Prix moyen de l'action | Actions (en millions) |
ΔActions (%) |
ΔActions (%) |
Valeur ($ en millions) |
Portefeuille (%) |
ΔPortefeuille (%) |
|
|---|---|---|---|---|---|---|---|---|---|
| SPY / SPDR S&P 500 ETF | Put | 0,16 | -6,24 | 100,22 | 3,56 | 38,3687 | -2,3782 | ||
| GHLD / Guild Holdings Company | 1,60 | 0,00 | 31,55 | 29,21 | 12,0793 | 1,7987 | |||
| BANC / Banc of California, Inc. | 0,99 | 0,00 | 13,95 | -0,99 | 5,3423 | -0,5914 | |||
| BHLB / Berkshire Hills Bancorp, Inc. | 0,34 | 0,00 | 8,63 | -4,02 | 3,3058 | -0,4822 | |||
| KRE / SPDR Series Trust - SPDR S&P Regional Banking ETF | Put | 0,12 | -28,57 | 7,42 | -25,38 | 2,8423 | -1,3466 | ||
| JPM / JPMorgan Chase & Co. | Put | 0,02 | 100,00 | 5,80 | 136,36 | 2,2199 | 1,1871 | ||
| KRE / SPDR Series Trust - SPDR S&P Regional Banking ETF | Call | 0,07 | 50,00 | 4,45 | 56,72 | 1,7054 | 0,5085 | ||
| BK / The Bank of New York Mellon Corporation | Put | 0,04 | 4,10 | 1,5697 | 1,5697 | ||||
| BAC / Bank of America Corporation | Put | 0,07 | 87,50 | 3,55 | 112,64 | 1,3588 | 0,6560 | ||
| BK / The Bank of New York Mellon Corporation | 0,04 | 3,23 | 1,2383 | 1,2383 | |||||
| PNC / The PNC Financial Services Group, Inc. | Put | 0,01 | 0,00 | 2,80 | 6,07 | 1,0706 | -0,0395 | ||
| TRV / The Travelers Companies, Inc. | Put | 0,01 | 2,68 | 1,0243 | 1,0243 | ||||
| STT / State Street Corporation | Put | 0,03 | 0,00 | 2,66 | 18,77 | 1,0178 | 0,0754 | ||
| JPM / JPMorgan Chase & Co. | 0,01 | -0,63 | 2,61 | 17,47 | 0,9990 | 0,0635 | |||
| C / Citigroup Inc. | Put | 0,03 | 0,00 | 2,55 | 19,92 | 0,9777 | 0,0810 | ||
| HIG / The Hartford Insurance Group, Inc. | Call | 0,02 | 2,54 | 0,9715 | 0,9715 | ||||
| NTRS / Northern Trust Corporation | Put | 0,02 | -33,33 | 2,54 | -14,33 | 0,9709 | -0,2752 | ||
| NLY / Annaly Capital Management, Inc. | Put | 0,12 | 2,35 | 0,9007 | 0,9007 | ||||
| RF / Regions Financial Corporation | Put | 0,10 | 0,00 | 2,35 | 8,24 | 0,9005 | -0,0144 | ||
| SCHW / The Charles Schwab Corporation | Put | 0,03 | 25,00 | 2,28 | 45,75 | 0,8733 | 0,2141 | ||
| USB / U.S. Bancorp | Put | 0,05 | 2,26 | 0,8662 | 0,8662 | ||||
| USB / U.S. Bancorp | 0,05 | 2,26 | 0,8662 | 0,8662 | |||||
| FISI / Financial Institutions, Inc. | 0,09 | 9,36 | 2,25 | 12,56 | 0,8611 | 0,0195 | |||
| PNC / The PNC Financial Services Group, Inc. | 0,01 | -20,00 | 2,24 | -15,14 | 0,8565 | -0,2536 | |||
| TFC / Truist Financial Corporation | Put | 0,05 | 2,15 | 0,8230 | 0,8230 | ||||
| ZION / Zions Bancorporation, National Association | Put | 0,04 | 2,08 | 0,7954 | 0,7954 | ||||
| ALL / The Allstate Corporation | Call | 0,01 | 2,01 | 0,7707 | 0,7707 | ||||
| BAC / Bank of America Corporation | 0,04 | 15,49 | 2,01 | 31,01 | 0,7700 | 0,1234 | |||
| RF / Regions Financial Corporation | 0,08 | -16,00 | 1,98 | -9,11 | 0,7564 | -0,1585 | |||
| STT / State Street Corporation | 0,02 | -8,75 | 1,94 | 8,38 | 0,7430 | -0,0109 | |||
| ITB / iShares Trust - iShares U.S. Home Construction ETF | Call | 0,02 | -62,43 | 1,82 | -63,25 | 0,6956 | -1,3850 | ||
| TRV / The Travelers Companies, Inc. | 0,01 | 1,79 | 0,6863 | 0,6863 | |||||
| NLY / Annaly Capital Management, Inc. | 0,10 | 1,79 | 0,6845 | 0,6845 | |||||
| FLG / Flagstar Financial, Inc. | 0,17 | 0,00 | 1,77 | -8,78 | 0,6764 | -0,1390 | |||
| WSBC / WesBanco, Inc. | 0,05 | 343,02 | 1,71 | 353,05 | 0,6539 | 0,4950 | |||
| IYR / iShares Trust - iShares U.S. Real Estate ETF | Put | 0,02 | 1,71 | 0,6531 | 0,6531 | ||||
| C / Citigroup Inc. | 0,02 | -32,20 | 1,70 | -18,72 | 0,6518 | -0,2300 | |||
| BPOP / Popular, Inc. | 0,01 | 13,23 | 1,58 | 35,05 | 0,6037 | 0,1123 | |||
| SCHW / The Charles Schwab Corporation | 0,02 | 64,19 | 1,57 | 91,36 | 0,6026 | 0,2563 | |||
| REM / iShares Trust - iShares Mortgage Real Estate ETF | Put | 0,07 | 1,53 | 0,5853 | 0,5853 | ||||
| BUSE / First Busey Corporation | 0,06 | 173,87 | 1,47 | 190,53 | 0,5641 | 0,3503 | |||
| BKU / BankUnited, Inc. | 0,04 | 45,45 | 1,42 | 50,26 | 0,5450 | 0,1463 | |||
| NTRS / Northern Trust Corporation | 0,01 | -50,74 | 1,27 | -36,71 | 0,4854 | -0,3578 | |||
| TFC / Truist Financial Corporation | 0,03 | 1,18 | 0,4526 | 0,4526 | |||||
| FAF / First American Financial Corporation | 0,02 | 14,34 | 1,18 | 6,90 | 0,4510 | -0,0127 | |||
| ZION / Zions Bancorporation, National Association | 0,02 | 1,04 | 0,3977 | 0,3977 | |||||
| ONB / Old National Bancorp | 0,05 | 0,00 | 1,00 | 0,71 | 0,3814 | -0,0351 | |||
| TMHC / Taylor Morrison Home Corporation | 0,02 | 0,00 | 0,99 | 2,38 | 0,3783 | -0,0284 | |||
| RITM / Rithm Capital Corp. | 0,09 | 0,00 | 0,99 | -1,40 | 0,3782 | -0,0436 | |||
| PHM / PulteGroup, Inc. | 0,01 | -34,70 | 0,98 | -33,04 | 0,3767 | -0,2417 | |||
| ESNT / Essent Group Ltd. | 0,01 | 0,00 | 0,75 | 5,22 | 0,2860 | -0,0129 | |||
| DHI / D.R. Horton, Inc. | 0,00 | -52,94 | 0,63 | -52,27 | 0,2414 | -0,3148 | |||
| UMBF / UMB Financial Corporation | 0,01 | 0,58 | 0,2214 | 0,2214 | |||||
| GL / Globe Life Inc. | 0,00 | -40,00 | 0,37 | -43,47 | 0,1428 | -0,1345 | |||
| FNB / F.N.B. Corporation | 0,03 | 0,36 | 0,1396 | 0,1396 | |||||
| JLL / Jones Lang LaSalle Incorporated | 0,00 | -75,80 | 0,31 | -75,06 | 0,1201 | -0,4087 | |||
| MTH / Meritage Homes Corporation | 0,00 | 0,00 | 0,26 | -5,80 | 0,0999 | -0,0164 | |||
| FAF / First American Financial Corporation | Put | 0,00 | -100,00 | 0,00 | -100,00 | -0,6908 | |||
| HBAN / Huntington Bancshares Incorporated | 0,00 | -100,00 | 0,00 | 0,0000 | |||||
| WBS / Webster Financial Corporation | 0,00 | -100,00 | 0,00 | 0,0000 | |||||
| JLL / Jones Lang LaSalle Incorporated | Put | 0,00 | -100,00 | 0,00 | -100,00 | -0,5219 | |||
| SPGI / S&P Global Inc. | 0,00 | -100,00 | 0,00 | 0,0000 | |||||
| MA / Mastercard Incorporated | 0,00 | -100,00 | 0,00 | 0,0000 | |||||
| V / Visa Inc. | 0,00 | -100,00 | 0,00 | 0,0000 | |||||
| HBAN / Huntington Bancshares Incorporated | Put | 0,00 | -100,00 | 0,00 | 0,0000 | ||||
| AVB / AvalonBay Communities, Inc. | 0,00 | -100,00 | 0,00 | 0,0000 | |||||
| WBS / Webster Financial Corporation | Put | 0,00 | -100,00 | 0,00 | 0,0000 | ||||
| XLF / The Select Sector SPDR Trust - The Financial Select Sector SPDR Fund | Put | 0,00 | -100,00 | 0,00 | 0,0000 | ||||
| AVB / AvalonBay Communities, Inc. | Put | 0,00 | -100,00 | 0,00 | 0,0000 | ||||
| SPGI / S&P Global Inc. | Put | 0,00 | -100,00 | 0,00 | 0,0000 | ||||
| V / Visa Inc. | Put | 0,00 | -100,00 | 0,00 | 0,0000 | ||||
| MA / Mastercard Incorporated | Put | 0,00 | -100,00 | 0,00 | 0,0000 |