Statistiques de base
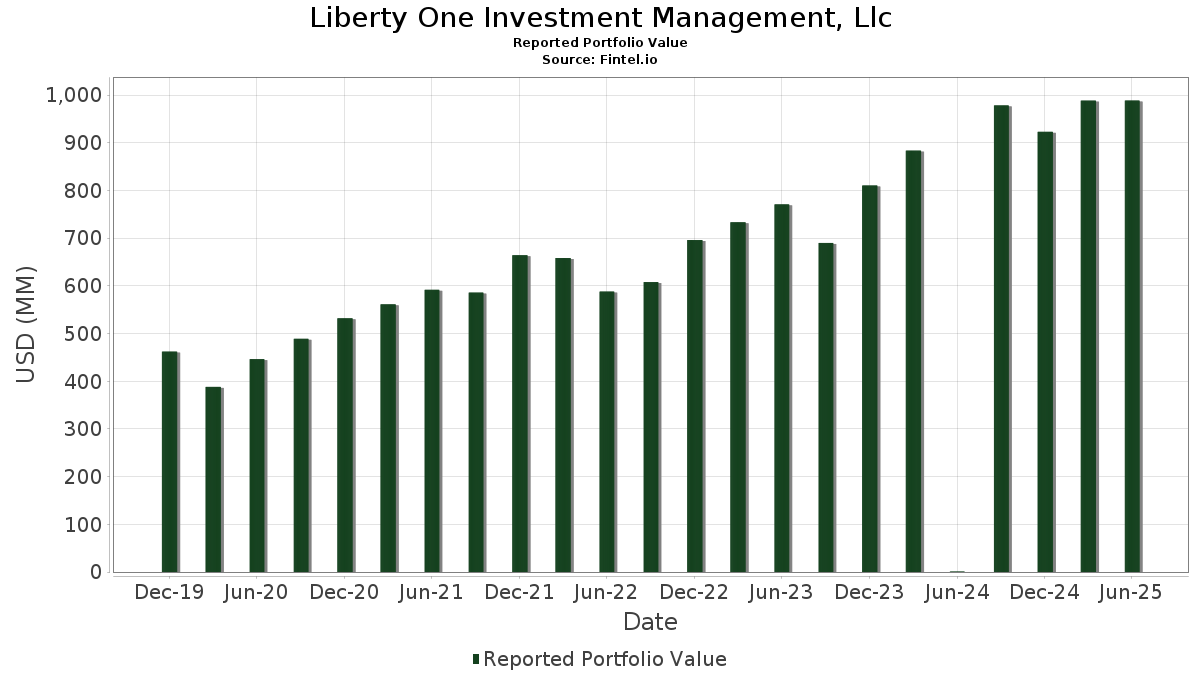
| Valeur du portefeuille | $ 988 496 599 |
| Positions actuelles | 145 |
Dernières positions, performances, ASG (à partir des dépôts 13F, 13D)
Liberty One Investment Management, Llc a déclaré un total de 145 positions dans ses derniers dépôts auprès de la SEC. La valeur la plus récente du portefeuille est calculée à 988 496 599 USD. Les actifs sous gestion réels (ASG) sont cette valeur plus les liquidités (qui ne sont pas divulguées). Les principales positions de Liberty One Investment Management, Llc sont Cardinal Health, Inc. (US:CAH) , The Kroger Co. (US:KR) , The Southern Company (US:SO) , The Coca-Cola Company (US:KO) , and Duke Energy Corporation (US:DUK) . Les nouvelles positions de Liberty One Investment Management, Llc incluent Nebius Group N.V. (US:NBIS) , .
Meilleures augmentations ce trimestre
Nous utilisons la variation de l'allocation du portefeuille car il s'agit de l'indicateur le plus significatif. Les changements peuvent être dus à des transactions ou à des variations de prix des actions.
| Titre | Actions (en millions) |
Valeur ($ en millions) |
% du portefeuille | ΔPortefeuille % |
|---|---|---|---|---|
| 0,05 | 26,91 | 2,7220 | 0,6653 | |
| 0,52 | 26,77 | 2,7082 | 0,4899 | |
| 0,46 | 33,25 | 3,3642 | 0,2337 | |
| 0,06 | 30,08 | 3,0428 | 0,2154 | |
| 1,23 | 29,70 | 3,0050 | 0,1809 | |
| 0,02 | 6,42 | 0,6496 | 0,1555 | |
| 0,01 | 5,76 | 0,5823 | 0,1010 | |
| 0,03 | 5,40 | 0,5459 | 0,0896 | |
| 0,35 | 26,20 | 2,6503 | 0,0894 | |
| 0,01 | 5,50 | 0,5564 | 0,0881 |
Principales baisses ce trimestre
Nous utilisons la variation de l'allocation du portefeuille car il s'agit de l'indicateur le plus significatif. Les changements peuvent être dus à des transactions ou à des variations de prix des actions.
| Titre | Actions (en millions) |
Valeur ($ en millions) |
% du portefeuille | ΔPortefeuille % |
|---|---|---|---|---|
| 0,08 | 25,58 | 2,5880 | -0,3878 | |
| 0,51 | 31,07 | 3,1432 | -0,3670 | |
| 0,11 | 26,64 | 2,6953 | -0,2904 | |
| 0,10 | 30,22 | 3,0567 | -0,2885 | |
| 0,22 | 27,00 | 2,7315 | -0,2742 | |
| 0,27 | 31,96 | 3,2336 | -0,2164 | |
| 0,20 | 30,47 | 3,0822 | -0,1822 | |
| 0,11 | 26,14 | 2,6446 | -0,1596 | |
| 0,35 | 32,36 | 3,2732 | -0,1371 | |
| 0,45 | 31,98 | 3,2355 | -0,1306 |
Déclarations 13F et dépôts de fonds
Ce formulaire a été déposé le 2025-07-30 pour la période de déclaration 2025-06-30. Cliquez sur l'icône du lien pour voir l'historique complet des transactions.
Mettre à niveau pour débloquer les données premium et exporter vers Excel ![]() .
.
| Titre | Type | Prix moyen de l'action | Actions (en millions) |
ΔActions (%) |
ΔActions (%) |
Valeur ($ en millions) |
Portefeuille (%) |
ΔPortefeuille (%) |
|
|---|---|---|---|---|---|---|---|---|---|
| CAH / Cardinal Health, Inc. | 0,22 | -18,36 | 36,14 | -0,45 | 3,6562 | -0,0170 | |||
| KR / The Kroger Co. | 0,46 | 1,43 | 33,25 | 7,48 | 3,3642 | 0,2337 | |||
| SO / The Southern Company | 0,35 | -3,88 | 32,36 | -4,01 | 3,2732 | -0,1371 | |||
| KO / The Coca-Cola Company | 0,45 | -2,68 | 31,98 | -3,87 | 3,2355 | -0,1306 | |||
| DUK / Duke Energy Corporation | 0,27 | -3,10 | 31,96 | -6,26 | 3,2336 | -0,2164 | |||
| LNT / Alliant Energy Corporation | 0,51 | -4,69 | 31,07 | -10,44 | 3,1432 | -0,3670 | |||
| JNJ / Johnson & Johnson | 0,20 | 2,52 | 30,47 | -5,57 | 3,0822 | -0,1822 | |||
| MCD / McDonald's Corporation | 0,10 | -2,29 | 30,22 | -8,61 | 3,0567 | -0,2885 | |||
| LMT / Lockheed Martin Corporation | 0,06 | 3,81 | 30,08 | 7,63 | 3,0428 | 0,2154 | |||
| PFE / Pfizer Inc. | 1,23 | 11,25 | 29,70 | 6,42 | 3,0050 | 0,1809 | |||
| GJR / Strats Trust For Procter & Gambel Security - Preferred Security | 0,19 | 4,13 | 29,70 | -2,65 | 3,0046 | -0,0823 | |||
| LLY / Eli Lilly and Company | 0,04 | 4,71 | 29,20 | -1,17 | 2,9536 | -0,0354 | |||
| T / AT&T Inc. | 0,96 | -3,83 | 27,90 | -1,58 | 2,8229 | -0,0458 | |||
| CLX / The Clorox Company | 0,22 | 11,47 | 27,00 | -9,11 | 2,7315 | -0,2742 | |||
| MSFT / Microsoft Corporation | 0,05 | -0,10 | 26,91 | 32,37 | 2,7220 | 0,6653 | |||
| LW / Lamb Weston Holdings, Inc. | 0,52 | 25,52 | 26,77 | 22,10 | 2,7082 | 0,4899 | |||
| RSG / Republic Services, Inc. | 0,11 | -11,34 | 26,64 | -9,71 | 2,6953 | -0,2904 | |||
| MDLZ / Mondelez International, Inc. | 0,39 | 1,75 | 26,51 | 1,14 | 2,6820 | 0,0298 | |||
| SYY / Sysco Corporation | 0,35 | 2,55 | 26,20 | 3,51 | 2,6503 | 0,0894 | |||
| WM / Waste Management, Inc. | 0,11 | -4,57 | 26,14 | -5,68 | 2,6446 | -0,1596 | |||
| KDP / Keurig Dr Pepper Inc. | 0,78 | 3,53 | 25,81 | 0,02 | 2,6112 | 0,0001 | |||
| UNH / UnitedHealth Group Incorporated | 0,08 | 46,03 | 25,58 | -13,02 | 2,5880 | -0,3878 | |||
| CASY / Casey's General Stores, Inc. | 0,04 | -13,92 | 21,41 | 1,20 | 2,1663 | 0,0253 | |||
| DOX / Amdocs Limited | 0,21 | -5,27 | 18,86 | -5,54 | 1,9075 | -0,1121 | |||
| SPHQ / Invesco Exchange-Traded Fund Trust - Invesco S&P 500 Quality ETF | 0,11 | -6,78 | 7,71 | 0,14 | 0,7801 | 0,0009 | |||
| GILD / Gilead Sciences, Inc. | 0,07 | -12,73 | 7,64 | -13,64 | 0,7728 | -0,1223 | |||
| VZ / Verizon Communications Inc. | 0,17 | -3,05 | 7,50 | -7,52 | 0,7590 | -0,0618 | |||
| ETR / Entergy Corporation | 0,09 | 0,04 | 7,37 | -2,72 | 0,7453 | -0,0210 | |||
| SPGP / Invesco Exchange-Traded Fund Trust - Invesco S&P 500 GARP ETF | 0,07 | 1,37 | 7,29 | 9,32 | 0,7371 | 0,0627 | |||
| XLV / The Select Sector SPDR Trust - The Health Care Select Sector SPDR Fund | 0,05 | 7,79 | 6,57 | -0,48 | 0,6651 | -0,0034 | |||
| PEP / PepsiCo, Inc. | 0,05 | 9,98 | 6,55 | -3,14 | 0,6621 | -0,0216 | |||
| GSCE / GS Connect S&P GSCI Enhanced Commodity Total Return ETN | 0,01 | -11,08 | 6,48 | 15,20 | 0,6557 | 0,0864 | |||
| AVGO / Broadcom Inc. | 0,02 | -20,14 | 6,42 | 31,48 | 0,6496 | 0,1555 | |||
| AMZN / Amazon.com, Inc. | 0,03 | -3,12 | 6,37 | 11,72 | 0,6441 | 0,0675 | |||
| RTX / RTX Corporation | 0,04 | -10,76 | 6,32 | -1,63 | 0,6392 | -0,0106 | |||
| JPM / JPMorgan Chase & Co. | 0,02 | -11,09 | 5,80 | 5,09 | 0,5870 | 0,0283 | |||
| INTU / Intuit Inc. | 0,01 | -5,68 | 5,76 | 21,00 | 0,5823 | 0,1010 | |||
| XMHQ / Invesco Exchange-Traded Fund Trust - Invesco S&P MidCap Quality ETF | 0,06 | 0,48 | 5,61 | 7,86 | 0,5680 | 0,0412 | |||
| CL / Colgate-Palmolive Company | 0,06 | 1,92 | 5,51 | -1,11 | 0,5577 | -0,0064 | |||
| CAT / Caterpillar Inc. | 0,01 | 0,95 | 5,50 | 18,84 | 0,5564 | 0,0881 | |||
| WMT / Walmart Inc. | 0,06 | -11,94 | 5,48 | -1,92 | 0,5541 | -0,0109 | |||
| BLK / BlackRock, Inc. | 0,01 | -4,59 | 5,48 | 5,78 | 0,5540 | 0,0302 | |||
| TXN / Texas Instruments Incorporated | 0,03 | 3,56 | 5,40 | 19,65 | 0,5459 | 0,0896 | |||
| DE / Deere & Company | 0,01 | -7,10 | 5,37 | 0,64 | 0,5431 | 0,0034 | |||
| AAPL / Apple Inc. | 0,03 | 6,21 | 5,32 | -1,90 | 0,5379 | -0,0105 | |||
| TRV / The Travelers Companies, Inc. | 0,02 | -6,76 | 5,30 | -5,68 | 0,5364 | -0,0324 | |||
| HON / Honeywell International Inc. | 0,02 | 2,61 | 5,28 | 12,86 | 0,5337 | 0,0607 | |||
| AFL / Aflac Incorporated | 0,05 | -3,13 | 5,17 | -8,12 | 0,5231 | -0,0463 | |||
| O / Realty Income Corporation | 0,09 | 3,77 | 5,15 | 3,04 | 0,5212 | 0,0154 | |||
| TJX / The TJX Companies, Inc. | 0,04 | -3,26 | 5,11 | -1,92 | 0,5169 | -0,0102 | |||
| COST / Costco Wholesale Corporation | 0,01 | -7,27 | 5,07 | -2,93 | 0,5125 | -0,0156 | |||
| PLD / Prologis, Inc. | 0,05 | 8,88 | 4,98 | 2,38 | 0,5041 | 0,0117 | |||
| MDT / Medtronic plc | 0,06 | 3,45 | 4,98 | 0,36 | 0,5040 | 0,0017 | |||
| ELV / Elevance Health, Inc. | 0,01 | 20,01 | 4,98 | 7,31 | 0,5034 | 0,0342 | |||
| HR / Healthcare Realty Trust Incorporated | 0,31 | 7,97 | 4,96 | 1,33 | 0,5020 | 0,0065 | |||
| HD / The Home Depot, Inc. | 0,01 | 3,95 | 4,92 | 4,00 | 0,4976 | 0,0191 | |||
| EXR / Extra Space Storage Inc. | 0,03 | 4,98 | 4,83 | 4,26 | 0,4882 | 0,0198 | |||
| DPZ / Domino's Pizza, Inc. | 0,01 | 2,55 | 4,82 | 0,56 | 0,4878 | 0,0027 | |||
| TSN / Tyson Foods, Inc. | 0,09 | 4,99 | 4,82 | -7,96 | 0,4876 | -0,0422 | |||
| HSY / The Hershey Company | 0,03 | 12,34 | 4,77 | 9,00 | 0,4830 | 0,0398 | |||
| NEE / NextEra Energy, Inc. | 0,07 | 3,47 | 4,75 | 1,32 | 0,4801 | 0,0062 | |||
| CVX / Chevron Corporation | 0,03 | 8,42 | 4,73 | -7,20 | 0,4783 | -0,0372 | |||
| FR / First Industrial Realty Trust, Inc. | 0,10 | 6,36 | 4,70 | -5,15 | 0,4754 | -0,0258 | |||
| AVUV / American Century ETF Trust - Avantis U.S. Small Cap Value ETF | 0,05 | 3,63 | 4,68 | 8,31 | 0,4733 | 0,0362 | |||
| AMGN / Amgen Inc. | 0,02 | 3,48 | 4,67 | -7,25 | 0,4724 | -0,0371 | |||
| BAX / Baxter International Inc. | 0,15 | 14,41 | 4,64 | 1,20 | 0,4696 | 0,0055 | |||
| MRK / Merck & Co., Inc. | 0,05 | 27,93 | 4,31 | 12,84 | 0,4356 | 0,0494 | |||
| MOAT / VanEck ETF Trust - VanEck Morningstar Wide Moat ETF | 0,03 | 0,07 | 2,62 | 6,65 | 0,2646 | 0,0165 | |||
| RSPU / Invesco Exchange-Traded Fund Trust - Invesco S&P 500 Equal Weight Utilities ETF | 0,04 | -7,75 | 2,54 | -5,79 | 0,2569 | -0,0159 | |||
| TDV / ProShares Trust - ProShares S&P Technology Dividend Aristocrats ETF | 0,03 | -3,72 | 2,51 | 9,98 | 0,2542 | 0,0230 | |||
| XMLV / Invesco Exchange-Traded Fund Trust II - Invesco S&P MidCap Low Volatility ETF | 0,04 | -2,89 | 2,49 | -2,97 | 0,2516 | -0,0077 | |||
| SPLV / Invesco Exchange-Traded Fund Trust II - Invesco S&P 500 Low Volatility ETF | 0,03 | -2,48 | 2,48 | -4,95 | 0,2506 | -0,0131 | |||
| SDY / SPDR Series Trust - SPDR S&P Dividend ETF | 0,02 | 0,72 | 2,47 | 0,78 | 0,2496 | 0,0018 | |||
| NOBL / ProShares Trust - ProShares S&P 500 Dividend Aristocrats ETF | 0,02 | 2,09 | 2,44 | 0,58 | 0,2466 | 0,0015 | |||
| RWJ / Invesco Exchange-Traded Fund Trust II - Invesco S&P SmallCap 600 Revenue ETF | 0,05 | 5,21 | 2,14 | 11,90 | 0,2170 | 0,0230 | |||
| SCHD / Schwab Strategic Trust - Schwab U.S. Dividend Equity ETF | 0,08 | 1,97 | 2,05 | -3,31 | 0,2069 | -0,0072 | |||
| IUSG / iShares Trust - iShares Core S&P U.S. Growth ETF | 0,01 | -2,46 | 1,79 | 15,45 | 0,1814 | 0,0242 | |||
| GSLC / Goldman Sachs ETF Trust - Goldman Sachs ActiveBeta U.S. Large Cap Equity ETF | 0,01 | 0,78 | 1,75 | 11,10 | 0,1772 | 0,0177 | |||
| QQQ / Invesco QQQ Trust, Series 1 | 0,00 | -4,67 | 1,71 | 12,12 | 0,1733 | 0,0187 | |||
| CRWD / CrowdStrike Holdings, Inc. | 0,00 | -12,01 | 1,67 | 27,15 | 0,1692 | 0,0361 | |||
| IUSV / iShares Trust - iShares Core S&P U.S. Value ETF | 0,02 | 1,25 | 1,65 | 3,84 | 0,1669 | 0,0061 | |||
| VDC / Vanguard World Fund - Vanguard Consumer Staples ETF | 0,01 | -0,64 | 1,61 | -0,56 | 0,1625 | -0,0009 | |||
| XTL / SPDR Series Trust - SPDR S&P Telecom ETF | 0,01 | -14,67 | 1,39 | 0,14 | 0,1404 | 0,0002 | |||
| AMD / Advanced Micro Devices, Inc. | 0,01 | 12,28 | 1,30 | 55,08 | 0,1314 | 0,0467 | |||
| SPEM / SPDR Index Shares Funds - SPDR Portfolio Emerging Markets ETF | 0,03 | -3,42 | 1,28 | 4,82 | 0,1300 | 0,0060 | |||
| LULU / lululemon athletica inc. | 0,00 | 21,95 | 1,00 | 2,36 | 0,1011 | 0,0023 | |||
| GOOG / Alphabet Inc. | 0,01 | -3,92 | 0,98 | 9,15 | 0,0989 | 0,0082 | |||
| KTOS / Kratos Defense & Security Solutions, Inc. | 0,02 | -19,78 | 0,98 | 25,58 | 0,0989 | 0,0201 | |||
| ISRG / Intuitive Surgical, Inc. | 0,00 | -4,03 | 0,97 | 5,32 | 0,0982 | 0,0049 | |||
| ELF / e.l.f. Beauty, Inc. | 0,01 | 13,43 | 0,89 | 124,69 | 0,0903 | 0,0501 | |||
| CRM / Salesforce, Inc. | 0,00 | 1,45 | 0,88 | 3,06 | 0,0886 | 0,0027 | |||
| LNTH / Lantheus Holdings, Inc. | 0,01 | 6,91 | 0,87 | -10,31 | 0,0881 | -0,0102 | |||
| SSB / SouthState Corporation | 0,01 | 8,89 | 0,82 | 7,86 | 0,0834 | 0,0061 | |||
| MELI / MercadoLibre, Inc. | 0,00 | -13,81 | 0,82 | 15,44 | 0,0825 | 0,0110 | |||
| TWLO / Twilio Inc. | 0,01 | -15,42 | 0,78 | 7,40 | 0,0793 | 0,0055 | |||
| NGG / National Grid plc - Depositary Receipt (Common Stock) | 0,01 | -9,91 | 0,73 | 2,23 | 0,0741 | 0,0016 | |||
| NVS / Novartis AG - Depositary Receipt (Common Stock) | 0,01 | -5,38 | 0,72 | 2,71 | 0,0730 | 0,0019 | |||
| LNG / Cheniere Energy, Inc. | 0,00 | -11,84 | 0,72 | -7,21 | 0,0730 | -0,0057 | |||
| BABA / Alibaba Group Holding Limited - Depositary Receipt (Common Stock) | 0,01 | -12,96 | 0,72 | -25,36 | 0,0727 | -0,0247 | |||
| CAVA / CAVA Group, Inc. | 0,01 | 14,70 | 0,72 | 11,84 | 0,0727 | 0,0077 | |||
| WPC / W. P. Carey Inc. | 0,01 | -6,37 | 0,70 | -7,39 | 0,0711 | -0,0057 | |||
| VNQI / Vanguard International Equity Index Funds - Vanguard Global ex-U.S. Real Estate ETF | 0,02 | -7,40 | 0,70 | 5,61 | 0,0706 | 0,0037 | |||
| UBS / UBS Group AG | 0,02 | -4,20 | 0,69 | 5,81 | 0,0701 | 0,0038 | |||
| UL / Unilever PLC - Depositary Receipt (Common Stock) | 0,01 | -8,41 | 0,69 | -5,89 | 0,0695 | -0,0044 | |||
| V / Visa Inc. | 0,00 | -10,68 | 0,69 | -9,63 | 0,0694 | -0,0073 | |||
| D / Dominion Energy, Inc. | 0,01 | -5,69 | 0,67 | -4,97 | 0,0677 | -0,0035 | |||
| CDNS / Cadence Design Systems, Inc. | 0,00 | -7,23 | 0,66 | 12,35 | 0,0672 | 0,0074 | |||
| VICI / VICI Properties Inc. | 0,02 | -6,14 | 0,65 | -6,30 | 0,0662 | -0,0044 | |||
| SWX / Southwest Gas Holdings, Inc. | 0,01 | -5,60 | 0,65 | -2,10 | 0,0662 | -0,0015 | |||
| BANF / BancFirst Corporation | 0,01 | -6,17 | 0,64 | 5,60 | 0,0649 | 0,0034 | |||
| INGR / Ingredion Incorporated | 0,00 | -7,70 | 0,60 | -7,50 | 0,0612 | -0,0049 | |||
| SNA / Snap-on Incorporated | 0,00 | -4,98 | 0,60 | -12,28 | 0,0607 | -0,0085 | |||
| BURL / Burlington Stores, Inc. | 0,00 | -4,53 | 0,60 | -6,71 | 0,0605 | -0,0044 | |||
| RGA / Reinsurance Group of America, Incorporated | 0,00 | -3,57 | 0,59 | -2,78 | 0,0601 | -0,0018 | |||
| STLD / Steel Dynamics, Inc. | 0,00 | -5,35 | 0,59 | -3,10 | 0,0600 | -0,0020 | |||
| NUE / Nucor Corporation | 0,00 | 35,54 | 0,58 | 45,96 | 0,0585 | 0,0184 | |||
| IQV / IQVIA Holdings Inc. | 0,00 | 7,71 | 0,52 | -3,68 | 0,0530 | -0,0021 | |||
| ITB / iShares Trust - iShares U.S. Home Construction ETF | 0,00 | 4,39 | 0,45 | 2,02 | 0,0460 | 0,0010 | |||
| NFLX / Netflix, Inc. | 0,00 | -28,20 | 0,41 | 3,05 | 0,0410 | 0,0012 | |||
| SG / Sweetgreen, Inc. | 0,03 | 50,77 | 0,40 | -10,22 | 0,0409 | -0,0047 | |||
| NOW / ServiceNow, Inc. | 0,00 | 13,17 | 0,39 | 46,42 | 0,0393 | 0,0124 | |||
| PLTR / Palantir Technologies Inc. | 0,00 | -53,47 | 0,39 | -25,00 | 0,0392 | -0,0130 | |||
| AXON / Axon Enterprise, Inc. | 0,00 | -8,87 | 0,37 | 43,85 | 0,0379 | 0,0115 | |||
| CEG / Constellation Energy Corporation | 0,00 | -0,09 | 0,35 | 60,45 | 0,0357 | 0,0134 | |||
| TW / Tradeweb Markets Inc. | 0,00 | -10,47 | 0,35 | -11,65 | 0,0353 | -0,0047 | |||
| SPGI / S&P Global Inc. | 0,00 | -3,02 | 0,34 | 0,60 | 0,0343 | 0,0002 | |||
| PGR / The Progressive Corporation | 0,00 | -10,76 | 0,33 | -15,99 | 0,0336 | -0,0063 | |||
| TMUS / T-Mobile US, Inc. | 0,00 | 2,22 | 0,32 | -8,65 | 0,0321 | -0,0031 | |||
| OXY / Occidental Petroleum Corporation | 0,01 | 21,51 | 0,29 | 3,57 | 0,0294 | 0,0010 | |||
| DKNG / DraftKings Inc. | 0,01 | 32,96 | 0,26 | 71,43 | 0,0268 | 0,0112 | |||
| NET / Cloudflare, Inc. | 0,00 | -38,16 | 0,26 | 7,35 | 0,0266 | 0,0018 | |||
| RBLX / Roblox Corporation | 0,00 | -43,56 | 0,26 | 1,97 | 0,0263 | 0,0005 | |||
| VRT / Vertiv Holdings Co | 0,00 | 7,28 | 0,26 | 91,85 | 0,0262 | 0,0125 | |||
| SNOW / Snowflake Inc. | 0,00 | -15,47 | 0,25 | 29,69 | 0,0252 | 0,0057 | |||
| TSM / Taiwan Semiconductor Manufacturing Company Limited - Depositary Receipt (Common Stock) | 0,00 | 4,26 | 0,24 | 42,11 | 0,0247 | 0,0073 | |||
| SNPS / Synopsys, Inc. | 0,00 | 40,65 | 0,24 | 68,75 | 0,0246 | 0,0100 | |||
| NBIS / Nebius Group N.V. | 0,00 | 0,24 | 0,0246 | 0,0246 | |||||
| NTNX / Nutanix, Inc. | 0,00 | 0,23 | 0,24 | 9,72 | 0,0241 | 0,0021 | |||
| UAL / United Airlines Holdings, Inc. | 0,00 | 1,18 | 0,23 | 17,17 | 0,0235 | 0,0034 | |||
| CHWY / Chewy, Inc. | 0,01 | -22,82 | 0,23 | 0,87 | 0,0235 | 0,0003 | |||
| S / SentinelOne, Inc. | 0,01 | 32,08 | 0,23 | 32,75 | 0,0230 | 0,0057 | |||
| CWST / Casella Waste Systems, Inc. | 0,00 | 7,79 | 0,23 | 11,33 | 0,0229 | 0,0024 | |||
| ESTC / Elastic N.V. | 0,00 | 55,66 | 0,23 | 47,71 | 0,0229 | 0,0073 | |||
| POST / Post Holdings, Inc. | 0,00 | 18,39 | 0,23 | 11,33 | 0,0229 | 0,0023 | |||
| CPRT / Copart, Inc. | 0,00 | 31,70 | 0,22 | 14,06 | 0,0223 | 0,0028 | |||
| HUM / Humana Inc. | 0,00 | -100,00 | 0,00 | 0,0000 | |||||
| SKX / Skechers U.S.A., Inc. | 0,00 | -100,00 | 0,00 | -100,00 | -0,0174 |