Statistiques de base
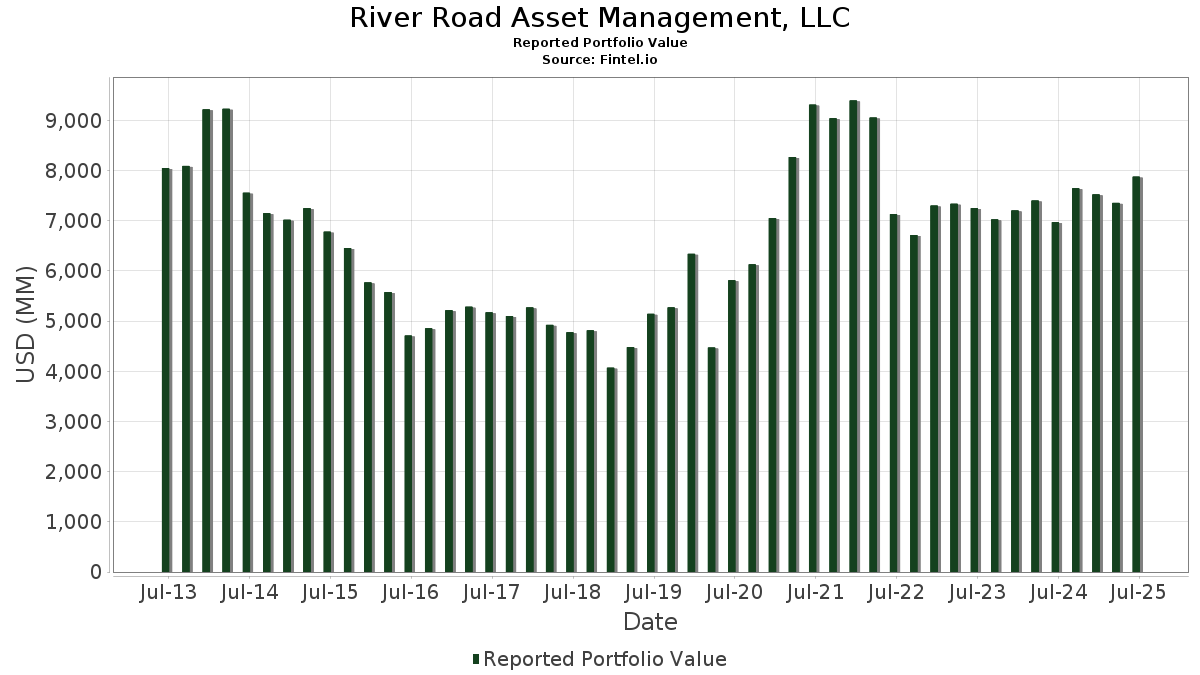
| Valeur du portefeuille | $ 7 876 544 189 |
| Positions actuelles | 182 |
Dernières positions, performances, ASG (à partir des dépôts 13F, 13D)
River Road Asset Management, LLC a déclaré un total de 182 positions dans ses derniers dépôts auprès de la SEC. La valeur la plus récente du portefeuille est calculée à 7 876 544 189 USD. Les actifs sous gestion réels (ASG) sont cette valeur plus les liquidités (qui ne sont pas divulguées). Les principales positions de River Road Asset Management, LLC sont McGrath RentCorp (US:MGRC) , BJ's Wholesale Club Holdings, Inc. (US:BJ) , White Mountains Insurance Group, Ltd. (US:WTM) , Murphy USA Inc. (US:MUSA) , and CoreCivic, Inc. (US:CXW) . Les nouvelles positions de River Road Asset Management, LLC incluent Titan America SA (US:TTAM) , Amrize AG (CH:AMRZ) , The Cooper Companies, Inc. (US:COO) , ICON Public Limited Company (US:ICLR) , and Brookfield Corporation (US:BN) . Les principales industries de River Road Asset Management, LLC sont "Insurance Agents, Brokers, And Service" (sic 64) , "Apparel And Other Finished Products Made From Fabrics And Similar Materials" (sic 23) , and "Apparel And Accessory Stores" (sic 56) .
Meilleures augmentations ce trimestre
Nous utilisons la variation de l'allocation du portefeuille car il s'agit de l'indicateur le plus significatif. Les changements peuvent être dus à des transactions ou à des variations de prix des actions.
| Titre | Actions (en millions) |
Valeur ($ en millions) |
% du portefeuille | ΔPortefeuille % |
|---|---|---|---|---|
| 0,61 | 125,40 | 1,5921 | 0,7717 | |
| 0,37 | 168,33 | 2,1371 | 0,7012 | |
| 3,65 | 52,33 | 0,6643 | 0,6643 | |
| 0,65 | 83,66 | 1,0621 | 0,6614 | |
| 0,62 | 55,55 | 0,7053 | 0,6045 | |
| 1,79 | 151,55 | 1,9241 | 0,5683 | |
| 0,83 | 42,26 | 0,5365 | 0,5365 | |
| 3,12 | 129,21 | 1,6405 | 0,5229 | |
| 1,25 | 89,03 | 1,1303 | 0,5169 | |
| 0,57 | 40,42 | 0,5132 | 0,5132 |
Principales baisses ce trimestre
Nous utilisons la variation de l'allocation du portefeuille car il s'agit de l'indicateur le plus significatif. Les changements peuvent être dus à des transactions ou à des variations de prix des actions.
| Titre | Actions (en millions) |
Valeur ($ en millions) |
% du portefeuille | ΔPortefeuille % |
|---|---|---|---|---|
| 1,84 | 54,29 | 0,6892 | -1,2874 | |
| 2,07 | 218,89 | 2,7790 | -1,0324 | |
| 0,56 | 23,60 | 0,2997 | -0,7253 | |
| 1,14 | 55,41 | 0,7034 | -0,6695 | |
| 0,39 | 27,33 | 0,3470 | -0,6344 | |
| 0,04 | 21,26 | 0,2699 | -0,4909 | |
| 0,13 | 23,93 | 0,3038 | -0,4809 | |
| 0,66 | 21,40 | 0,2717 | -0,4728 | |
| 1,61 | 150,94 | 1,9163 | -0,3797 | |
| 0,11 | 196,46 | 2,4943 | -0,3773 |
Déclarations 13D/G
Il s'agit d'une liste des déclarations 13D et 13G déposées au cours de la dernière année (le cas échéant). Cliquez sur l'icône du lien pour voir l'historique complet des transactions. Les lignes vertes indiquent de nouvelles positions. Les lignes rouges indiquent des positions fermées.
| Date de dépôt | Formulaire | Titre | Actions précédentes |
Actions actuelles |
ΔActions % | % de participation |
% ΔParticipation | |
|---|---|---|---|---|---|---|---|---|
| 2025-08-01 | PKE / Park Aerospace Corp. | 1 186 617 | 976 678 | -17,69 | 4,90 | -16,95 | ||
| 2025-05-08 | CNNE / Cannae Holdings, Inc. | 5 593 612 | 4 678 876 | -16,35 | 7,40 | -16,85 | ||
| 2025-05-08 | PRSU / Pursuit Attractions and Hospitality, Inc. | 1 830 472 | 1 887 193 | 3,10 | 6,70 | -23,86 | ||
| 2025-05-08 | PX / P10, Inc. | 4 855 166 | 4 725 477 | -2,67 | 6,90 | -22,47 | ||
| 2025-05-08 | PLUS / ePlus inc. | 1 328 883 | 1 386 853 | 4,36 | 5,20 | 6,12 | ||
| 2025-05-06 | PZZA / Papa John's International, Inc. | 2 138 084 | 1 480 033 | -30,78 | 4,50 | -31,82 | ||
| 2025-02-06 | IMKTA / Ingles Markets, Incorporated | 832 191 | 976 424 | 17,33 | 6,70 | 17,54 | ||
| 2025-02-06 | MGRC / McGrath RentCorp | 1 896 943 | 7,70 | |||||
| 2025-01-07 | ATSG / Air Transport Services Group, Inc. | 8 439 673 | 3 081 823 | -63,48 | 4,70 | -63,57 | ||
| 2024-11-06 | AGX / Argan, Inc. | 1 109 515 | 435 111 | -60,78 | 3,20 | -61,45 |
Déclarations 13F et dépôts de fonds
Ce formulaire a été déposé le 2025-08-13 pour la période de déclaration 2025-06-30. Cliquez sur l'icône du lien pour voir l'historique complet des transactions.
Mettre à niveau pour débloquer les données premium et exporter vers Excel ![]() .
.
| Titre | Type | Prix moyen de l'action | Actions (en millions) |
ΔActions (%) |
ΔActions (%) |
Valeur ($ en millions) |
Portefeuille (%) |
ΔPortefeuille (%) |
|
|---|---|---|---|---|---|---|---|---|---|
| MGRC / McGrath RentCorp | 1,97 | 4,03 | 245,96 | 16,53 | 3,1227 | 0,2527 | |||
| BJ / BJ's Wholesale Club Holdings, Inc. | 2,07 | -15,86 | 218,89 | -21,91 | 2,7790 | -1,0324 | |||
| WTM / White Mountains Insurance Group, Ltd. | 0,11 | 0,21 | 196,46 | -6,97 | 2,4943 | -0,3773 | |||
| MUSA / Murphy USA Inc. | 0,49 | 24,03 | 178,21 | -4,30 | 2,2625 | -0,2696 | |||
| CXW / CoreCivic, Inc. | 8,72 | -0,13 | 174,65 | -1,37 | 2,2173 | -0,1903 | |||
| CACI / CACI International Inc | 0,37 | 26,99 | 168,33 | 59,40 | 2,1371 | 0,7012 | |||
| AGO / Assured Guaranty Ltd. | 1,79 | 58,32 | 151,55 | 51,99 | 1,9241 | 0,5683 | |||
| AXS / AXIS Capital Holdings Limited | 1,61 | -4,52 | 150,94 | -10,61 | 1,9163 | -0,3797 | |||
| GXO / GXO Logistics, Inc. | 2,97 | 5,42 | 147,49 | 34,09 | 1,8725 | 0,3770 | |||
| UNF / UniFirst Corporation | 0,79 | 0,55 | 135,76 | -1,17 | 1,7236 | -0,1441 | |||
| WEX / WEX Inc. | 0,80 | 20,85 | 135,38 | 30,60 | 1,7188 | 0,3093 | |||
| GNW / Genworth Financial, Inc. | 16,69 | -2,29 | 131,20 | 8,32 | 1,6657 | 0,0188 | |||
| VNT / Vontier Corporation | 3,12 | 24,53 | 129,21 | 57,21 | 1,6405 | 0,5229 | |||
| WCC / WESCO International, Inc. | 0,61 | 55,96 | 125,40 | 107,84 | 1,5921 | 0,7717 | |||
| NWE / NorthWestern Energy Group, Inc. | 2,30 | -3,23 | 123,46 | -10,21 | 1,5675 | -0,3021 | |||
| HAE / Haemonetics Corporation | 1,66 | 18,68 | 122,59 | 38,27 | 1,5563 | 0,3509 | |||
| LAD / Lithia Motors, Inc. | 0,41 | 26,39 | 118,80 | 24,00 | 1,5083 | 0,2056 | |||
| PLUS / ePlus inc. | 1,62 | 17,17 | 105,26 | 24,37 | 1,3364 | 0,1855 | |||
| WTW / Willis Towers Watson Public Limited Company | 0,33 | 19,49 | 104,68 | 11,66 | 1,3290 | 0,0543 | |||
| CNNE / Cannae Holdings, Inc. | 4,72 | 0,86 | 100,90 | 17,65 | 1,2810 | 0,1148 | |||
| SNN / Smith & Nephew plc - Depositary Receipt (Common Stock) | 3,18 | 9,30 | 97,18 | 17,74 | 1,2337 | 0,1114 | |||
| BRK.B / Berkshire Hathaway Inc. | 0,20 | 72,53 | 93,38 | 52,86 | 1,1855 | 0,3549 | |||
| CRH / CRH plc | 0,95 | 14,77 | 90,71 | 24,53 | 1,1517 | 0,1612 | |||
| RTO / Rentokil Initial plc - Depositary Receipt (Common Stock) | 3,63 | -10,08 | 89,88 | -2,74 | 1,1411 | -0,1154 | |||
| GEHC / GE HealthCare Technologies Inc. | 1,25 | 123,34 | 89,03 | 97,36 | 1,1303 | 0,5169 | |||
| PRKS / United Parks & Resorts Inc. | 1,87 | 2,98 | 88,51 | 7,22 | 1,1238 | 0,0013 | |||
| SWX / Southwest Gas Holdings, Inc. | 1,12 | -1,50 | 87,27 | 7,20 | 1,1079 | 0,0010 | |||
| PSMT / PriceSmart, Inc. | 0,79 | 0,20 | 84,55 | 22,61 | 1,0734 | 0,1358 | |||
| WSC / WillScot Holdings Corporation | 2,87 | 75,60 | 84,34 | 85,39 | 1,0707 | 0,4522 | |||
| ICUI / ICU Medical, Inc. | 0,65 | 206,98 | 83,66 | 183,88 | 1,0621 | 0,6614 | |||
| CNH / CNH Industrial N.V. | 6,02 | -5,42 | 78,00 | -0,18 | 0,9903 | -0,0722 | |||
| SNX / TD SYNNEX Corporation | 0,53 | -21,93 | 76,79 | 8,43 | 0,9749 | 0,0120 | |||
| DK / Delek US Holdings, Inc. | 3,43 | -11,09 | 76,64 | 31,98 | 0,9730 | 0,1835 | |||
| TLN / Talen Energy Corporation | 0,20 | -55,01 | 76,62 | -14,93 | 0,9728 | -0,2520 | |||
| MAA / Mid-America Apartment Communities, Inc. | 0,52 | 24,92 | 74,40 | 6,17 | 0,9446 | -0,0083 | |||
| TXNM / TXNM Energy, Inc. | 1,29 | -12,38 | 73,02 | -6,96 | 0,9271 | -0,1401 | |||
| AWI / Armstrong World Industries, Inc. | 0,36 | -6,63 | 68,22 | 24,72 | 0,8661 | 0,1223 | |||
| PR / Permian Resources Corporation | 4,81 | -2,59 | 68,17 | -0,41 | 0,8654 | -0,0653 | |||
| EVTC / EVERTEC, Inc. | 1,85 | -1,35 | 66,85 | -3,02 | 0,8487 | -0,0885 | |||
| NOMD / Nomad Foods Limited | 3,88 | -0,78 | 65,33 | -14,97 | 0,8295 | -0,2153 | |||
| KAR / OPENLANE, Inc. | 2,61 | -36,79 | 64,35 | -19,21 | 0,8169 | -0,2660 | |||
| PX / P10, Inc. | 5,10 | 7,83 | 62,67 | 12,87 | 0,7957 | 0,0407 | |||
| IMKTA / Ingles Markets, Incorporated | 0,98 | 0,91 | 61,97 | -2,50 | 0,7867 | -0,0774 | |||
| ATKR / Atkore Inc. | 0,79 | 1,03 | 61,03 | 29,71 | 0,7749 | 0,1351 | |||
| TRIP / Tripadvisor, Inc. | 3,42 | -7,96 | 59,78 | 13,61 | 0,7589 | 0,0435 | |||
| PRSU / Pursuit Attractions and Hospitality, Inc. | 1,96 | 3,76 | 59,21 | -11,34 | 0,7518 | -0,1564 | |||
| QSR / Restaurant Brands International Inc. | 0,86 | 90,45 | 58,57 | 93,93 | 0,7437 | 0,3330 | |||
| HII / Huntington Ingalls Industries, Inc. | 0,21 | -35,43 | 58,25 | -11,76 | 0,7396 | -0,1580 | |||
| DOLE / Dole plc | 4,07 | 2,80 | 58,01 | 1,31 | 0,7365 | -0,0421 | |||
| LH / Labcorp Holdings Inc. | 0,22 | -21,79 | 56,63 | -12,60 | 0,7189 | -0,1621 | |||
| SBUX / Starbucks Corporation | 0,62 | 724,80 | 55,55 | 649,79 | 0,7053 | 0,6045 | |||
| CSX / CSX Corporation | 1,56 | -21,64 | 55,46 | -5,38 | 0,7042 | -0,0928 | |||
| TAP.A / Molson Coors Beverage Company | 1,14 | -31,44 | 55,41 | -45,13 | 0,7034 | -0,6695 | |||
| MTN / Vail Resorts, Inc. | 0,37 | 3,91 | 55,18 | -2,42 | 0,7005 | -0,0684 | |||
| ALIT / Alight, Inc. | 10,21 | 1,63 | 54,74 | -8,14 | 0,6949 | -0,1152 | |||
| LKQ / LKQ Corporation | 1,84 | -46,09 | 54,29 | -62,66 | 0,6892 | -1,2874 | |||
| GMS / GMS Inc. | 0,48 | -41,76 | 53,17 | -12,74 | 0,6750 | -0,1534 | |||
| SSNC / SS&C Technologies Holdings, Inc. | 0,61 | 43,94 | 52,44 | 47,30 | 0,6658 | 0,1817 | |||
| TTAM / Titan America SA | 3,65 | 52,33 | 0,6643 | 0,6643 | |||||
| CSL / Carlisle Companies Incorporated | 0,14 | 22,80 | 50,89 | 27,92 | 0,6461 | 0,1052 | |||
| HCC / Warrior Met Coal, Inc. | 0,98 | 7,89 | 50,25 | 16,17 | 0,6380 | 0,0498 | |||
| LEN / Lennar Corporation | 0,44 | 86,14 | 49,75 | 81,93 | 0,6316 | 0,2598 | |||
| LGIH / LGI Homes, Inc. | 0,90 | -3,73 | 48,17 | -22,85 | 0,6116 | -0,2374 | |||
| SM / SM Energy Company | 1,74 | -1,13 | 47,96 | -8,92 | 0,6088 | -0,1071 | |||
| NSP / Insperity, Inc. | 0,78 | -0,86 | 46,50 | -33,81 | 0,5904 | -0,3648 | |||
| JBI / Janus International Group, Inc. | 5,22 | -0,42 | 44,70 | 18,53 | 0,5676 | 0,0547 | |||
| ABG / Asbury Automotive Group, Inc. | 0,20 | 122,03 | 44,41 | 123,33 | 0,5639 | 0,2934 | |||
| AMRZ / Amrize AG | 0,83 | 42,26 | 0,5365 | 0,5365 | |||||
| HHH / Howard Hughes Holdings Inc. | 0,61 | -13,85 | 41,77 | -20,07 | 0,5303 | -0,1803 | |||
| COO / The Cooper Companies, Inc. | 0,57 | 40,42 | 0,5132 | 0,5132 | |||||
| YELP / Yelp Inc. | 1,17 | -2,82 | 40,11 | -9,64 | 0,5093 | -0,0944 | |||
| LULU / lululemon athletica inc. | 0,20 | 116,87 | 39,82 | 53,64 | 0,5056 | 0,1531 | |||
| FIS / Fidelity National Information Services, Inc. | 0,49 | 39,11 | 0,4965 | 0,4965 | |||||
| CNA / CNA Financial Corporation | 0,88 | -10,08 | 39,09 | -21,52 | 0,4962 | -0,1809 | |||
| HUBG / Hub Group, Inc. | 1,10 | 79,21 | 38,64 | 68,85 | 0,4906 | 0,1794 | |||
| ENOV / Enovis Corporation | 1,44 | 3,45 | 38,59 | -27,44 | 0,4899 | -0,2332 | |||
| KKR / KKR & Co. Inc. | 0,26 | -6,44 | 38,37 | 18,63 | 0,4872 | 0,0473 | |||
| PGR / The Progressive Corporation | 0,15 | 145,59 | 36,81 | 110,04 | 0,4673 | 0,2290 | |||
| ICLR / ICON Public Limited Company | 0,21 | 35,38 | 0,4491 | 0,4491 | |||||
| VYX / NCR Voyix Corporation | 2,54 | -0,50 | 34,66 | 39,00 | 0,4401 | 0,1010 | |||
| DINO / HF Sinclair Corporation | 0,78 | -0,05 | 34,33 | 33,57 | 0,4359 | 0,0864 | |||
| AER / AerCap Holdings N.V. | 0,31 | -25,36 | 33,57 | -21,65 | 0,4262 | -0,1564 | |||
| EMBC / Embecta Corp. | 3,24 | 0,38 | 32,92 | -20,01 | 0,4180 | -0,1416 | |||
| UL / Unilever PLC - Depositary Receipt (Common Stock) | 0,56 | -5,81 | 32,59 | -7,58 | 0,4138 | -0,0657 | |||
| BN / Brookfield Corporation | 0,45 | 30,44 | 0,3864 | 0,3864 | |||||
| DE / Deere & Company | 0,05 | 2 041,66 | 28,14 | 2 293,03 | 0,3573 | 0,3413 | |||
| KR / The Kroger Co. | 0,39 | -63,43 | 27,33 | -62,13 | 0,3470 | -0,6344 | |||
| ORCL / Oracle Corporation | 0,11 | -35,52 | 27,01 | 17,03 | 0,3429 | 0,0291 | |||
| MDU / MDU Resources Group, Inc. | 1,51 | 26,11 | 0,3314 | 0,3314 | |||||
| IWD / iShares Trust - iShares Russell 1000 Value ETF | 0,13 | 25,50 | 0,3238 | 0,3238 | |||||
| DEO / Diageo plc - Depositary Receipt (Common Stock) | 0,25 | 24,83 | 0,3152 | 0,3152 | |||||
| WMB / The Williams Companies, Inc. | 0,41 | 0,61 | 24,28 | 0,93 | 0,3083 | -0,0188 | |||
| BDX / Becton, Dickinson and Company | 0,13 | -46,71 | 23,93 | -58,53 | 0,3038 | -0,4809 | |||
| KMI / Kinder Morgan, Inc. | 0,84 | -33,64 | 23,63 | -34,73 | 0,3000 | -0,1923 | |||
| PZZA / Papa John's International, Inc. | 0,56 | -69,67 | 23,60 | -68,69 | 0,2997 | -0,7253 | |||
| RDN / Radian Group Inc. | 0,66 | -60,36 | 21,40 | -60,91 | 0,2717 | -0,4728 | |||
| CASY / Casey's General Stores, Inc. | 0,04 | -68,29 | 21,26 | -62,00 | 0,2699 | -0,4909 | |||
| RPRX / Royalty Pharma plc | 0,54 | 19,04 | 20,03 | 40,72 | 0,2543 | 0,0607 | |||
| TNC / Tennant Company | 0,24 | 131,05 | 19,82 | 139,15 | 0,2517 | 0,1390 | |||
| SAIC / Science Applications International Corporation | 0,18 | 19,77 | 0,2510 | 0,2510 | |||||
| PNC / The PNC Financial Services Group, Inc. | 0,10 | 1,82 | 19,26 | 10,21 | 0,2446 | 0,0069 | |||
| FI / Fiserv, Inc. | 0,14 | 19,03 | 0,2415 | 0,2415 | |||||
| EXPD / Expeditors International of Washington, Inc. | 0,16 | 85,97 | 18,96 | 79,76 | 0,2407 | 0,0973 | |||
| MMS / Maximus, Inc. | 0,24 | 18,07 | 0,2294 | 0,2294 | |||||
| VMI / Valmont Industries, Inc. | 0,05 | 151,88 | 17,75 | 221,29 | 0,2254 | 0,1502 | |||
| AMT / American Tower Corporation | 0,08 | 9,37 | 17,62 | 4,74 | 0,2238 | -0,0050 | |||
| PKE / Park Aerospace Corp. | 0,98 | -19,71 | 17,60 | 7,57 | 0,2234 | 0,0010 | |||
| MU / Micron Technology, Inc. | 0,16 | 7,89 | 17,03 | 35,52 | 0,2162 | 0,0453 | |||
| BLCO / Bausch + Lomb Corporation | 1,23 | -22,74 | 16,77 | -27,37 | 0,2129 | -0,1010 | |||
| WMG / Warner Music Group Corp. | 0,57 | 51,86 | 16,62 | 41,74 | 0,2109 | 0,0515 | |||
| ITRN / Ituran Location and Control Ltd. | 0,41 | -0,94 | 16,20 | 8,21 | 0,2057 | 0,0021 | |||
| DAL / Delta Air Lines, Inc. | 0,30 | 223,51 | 15,99 | 294,81 | 0,2030 | 0,1479 | |||
| BXC / BlueLinx Holdings Inc. | 0,22 | 4,31 | 15,91 | 1,93 | 0,2020 | -0,0102 | |||
| CB / Chubb Limited | 0,06 | 3,62 | 15,55 | -8,72 | 0,1975 | -0,0342 | |||
| GEO / The GEO Group, Inc. | 0,58 | -54,10 | 15,14 | -59,27 | 0,1922 | -0,3132 | |||
| CRM / Salesforce, Inc. | 0,06 | 81,17 | 15,01 | 74,39 | 0,1905 | 0,0735 | |||
| PAYC / Paycom Software, Inc. | 0,06 | 14,48 | 14,65 | 21,34 | 0,1860 | 0,0218 | |||
| APG / APi Group Corporation | 0,40 | 37,22 | 14,55 | 38,41 | 0,1847 | 0,0418 | |||
| EXPE / Expedia Group, Inc. | 0,08 | 77,11 | 14,41 | 89,90 | 0,1829 | 0,0797 | |||
| ACN / Accenture plc | 0,05 | 190,28 | 14,35 | 148,50 | 0,1822 | 0,1037 | |||
| CMCSA / Comcast Corporation | 0,43 | 1,55 | 14,33 | -8,55 | 0,1820 | -0,0311 | |||
| PGNY / Progyny, Inc. | 0,61 | -20,72 | 14,26 | -16,58 | 0,1811 | -0,0514 | |||
| TPG / TPG Inc. | 0,24 | 13,95 | 0,1771 | 0,1771 | |||||
| FERG / Ferguson Enterprises Inc. | 0,06 | 103,46 | 13,77 | 183,62 | 0,1748 | 0,1088 | |||
| CPAY / Corpay, Inc. | 0,04 | 3 768,79 | 13,17 | 3 489,37 | 0,1672 | 0,1622 | |||
| OVV / Ovintiv Inc. | 0,30 | -1,15 | 12,35 | -4,89 | 0,1568 | -0,0198 | |||
| VOYA / Voya Financial, Inc. | 0,18 | 85,78 | 12,30 | 91,93 | 0,1562 | 0,0690 | |||
| RPAY / Repay Holdings Corporation | 2,41 | -3,28 | 11,86 | -14,57 | 0,1506 | -0,0382 | |||
| EL / The Estée Lauder Companies Inc. | 0,12 | 76,95 | 11,62 | 150,27 | 0,1475 | 0,0844 | |||
| CCL / Carnival Corporation & plc | 0,38 | 78,02 | 11,22 | 171,37 | 0,1425 | 0,0863 | |||
| AMGN / Amgen Inc. | 0,04 | 1,76 | 11,20 | -3,62 | 0,1422 | -0,0158 | |||
| FCNCA / First Citizens BancShares, Inc. | 0,01 | 11,11 | 0,1410 | 0,1410 | |||||
| CCOI / Cogent Communications Holdings, Inc. | 0,24 | 0,58 | 11,04 | -25,21 | 0,1401 | -0,0605 | |||
| FAF / First American Financial Corporation | 0,18 | 10,78 | 0,1369 | 0,1369 | |||||
| KMB / Kimberly-Clark Corporation | 0,09 | 1,75 | 10,70 | -10,84 | 0,1358 | -0,0273 | |||
| GLW / Corning Incorporated | 0,17 | 3,33 | 10,65 | 42,74 | 0,1353 | 0,0338 | |||
| ACIW / ACI Worldwide, Inc. | 0,24 | 12,93 | 10,34 | -12,15 | 0,1313 | -0,0288 | |||
| ALG / Alamo Group Inc. | 0,05 | 10,22 | 0,1298 | 0,1298 | |||||
| OSK / Oshkosh Corporation | 0,08 | 10,21 | 0,1297 | 0,1297 | |||||
| STZ / Constellation Brands, Inc. | 0,06 | 213,88 | 9,76 | 185,72 | 0,1240 | 0,0775 | |||
| BATRK / Atlanta Braves Holdings, Inc. | 0,22 | 85,97 | 9,75 | 107,14 | 0,1238 | 0,0598 | |||
| JOE / The St. Joe Company | 0,19 | 85,97 | 9,43 | 100,04 | 0,1198 | 0,0556 | |||
| UFPI / UFP Industries, Inc. | 0,09 | 9,31 | 0,1181 | 0,1181 | |||||
| SN / SharkNinja, Inc. | 0,08 | 9,21 | 0,1169 | 0,1169 | |||||
| EOG / EOG Resources, Inc. | 0,08 | 15,18 | 9,11 | 7,79 | 0,1156 | 0,0007 | |||
| AVT / Avnet, Inc. | 0,16 | 2,59 | 8,62 | 12,93 | 0,1094 | 0,0057 | |||
| AHL / Aspen Insurance Holdings Limited | 0,26 | 8,36 | 0,1061 | 0,1061 | |||||
| ABBV / AbbVie Inc. | 0,04 | 1,58 | 8,19 | -8,37 | 0,1040 | -0,0176 | |||
| ARE / Alexandria Real Estate Equities, Inc. | 0,11 | 72,43 | 8,07 | 42,47 | 0,1025 | 0,0254 | |||
| PEP / PepsiCo, Inc. | 0,06 | 3,19 | 7,92 | -5,08 | 0,1005 | -0,0129 | |||
| WFC / Wells Fargo & Company | 0,10 | 7,75 | 0,0984 | 0,0984 | |||||
| IDA / IDACORP, Inc. | 0,06 | -46,08 | 7,13 | -41,86 | 0,0905 | -0,0762 | |||
| VAL / Valaris Limited | 0,14 | 7,63 | 6,97 | 33,30 | 0,0885 | 0,0174 | |||
| PSX / Phillips 66 | 0,06 | 51,73 | 6,87 | 51,85 | 0,0872 | 0,0257 | |||
| JNJ / Johnson & Johnson | 0,04 | 1,58 | 6,49 | 0,92 | 0,0823 | -0,0051 | |||
| UPS / United Parcel Service, Inc. | 0,07 | -27,72 | 6,30 | -43,39 | 0,0799 | -0,0713 | |||
| EPM / Evolution Petroleum Corporation | 1,30 | -1,28 | 6,29 | -7,96 | 0,0799 | -0,0131 | |||
| CSGS / CSG Systems International, Inc. | 0,10 | 3,00 | 6,19 | 6,39 | 0,0786 | -0,0005 | |||
| CSCO / Cisco Systems, Inc. | 0,09 | -22,16 | 5,87 | -14,14 | 0,0745 | -0,0184 | |||
| DUK / Duke Energy Corporation | 0,05 | -46,24 | 5,86 | -46,40 | 0,0744 | -0,0742 | |||
| USB / U.S. Bancorp | 0,13 | -56,15 | 5,79 | -53,30 | 0,0735 | -0,0950 | |||
| ACA / Arcosa, Inc. | 0,07 | 5,72 | 0,0727 | 0,0727 | |||||
| HPE.PRC / Hewlett Packard Enterprise Company - Preferred Security | 0,10 | 3,41 | 5,72 | 29,98 | 0,0726 | 0,0128 | |||
| GPC / Genuine Parts Company | 0,04 | -57,42 | 5,66 | -53,94 | 0,0718 | -0,0952 | |||
| TXN / Texas Instruments Incorporated | 0,03 | 2,65 | 5,53 | 3,42 | 0,0702 | -0,0025 | |||
| FNF / Fidelity National Financial, Inc. | 0,09 | 1,53 | 5,33 | -11,95 | 0,0676 | -0,0146 | |||
| TDW / Tidewater Inc. | 0,10 | 85,96 | 5,09 | 120,06 | 0,0646 | 0,0332 | |||
| EXE / Expand Energy Corporation | 0,05 | -44,80 | 5,05 | -48,05 | 0,0641 | -0,0681 | |||
| BAH / Booz Allen Hamilton Holding Corporation | 0,04 | 4,76 | 0,0604 | 0,0604 | |||||
| KELYA / Kelly Services, Inc. | 0,37 | 0,02 | 4,48 | -6,98 | 0,0569 | -0,0086 | |||
| AES / The AES Corporation | 0,33 | -57,83 | 4,40 | -55,36 | 0,0558 | -0,0781 | |||
| EPD / Enterprise Products Partners L.P. - Limited Partnership | 0,14 | -1,52 | 4,39 | -10,60 | 0,0558 | -0,0110 | |||
| BMY / Bristol-Myers Squibb Company | 0,10 | -40,28 | 4,34 | -57,60 | 0,0551 | -0,0841 | |||
| TGT / Target Corporation | 0,04 | -82,86 | 4,25 | -83,50 | 0,0540 | -0,2964 | |||
| INMD / InMode Ltd. | 0,24 | -52,84 | 3,31 | -63,69 | 0,0420 | -0,0818 | |||
| CCI / Crown Castle Inc. | 0,03 | 3,72 | 3,14 | 4,57 | 0,0398 | -0,0010 | |||
| WSO / Watsco, Inc. | 0,01 | 1,55 | 2,45 | -9,91 | 0,0312 | -0,0059 | |||
| CNI / Canadian National Railway Company | 0,01 | 11,09 | 1,07 | 6,60 | 0,0135 | -0,0001 | |||
| SSD / Simpson Manufacturing Co., Inc. | 0,00 | 0,84 | 0,0106 | 0,0106 | |||||
| APO / Apollo Global Management, Inc. | 0,00 | 0,00 | 0,49 | 6,01 | 0,0063 | -0,0001 | |||
| NVR / NVR, Inc. | 0,00 | 0,00 | 0,42 | 4,20 | 0,0054 | -0,0001 | |||
| ARES / Ares Management Corporation | 0,00 | -3,53 | 0,42 | 22,09 | 0,0053 | 0,0007 | |||
| AAP / Advance Auto Parts, Inc. | 0,00 | -100,00 | 0,00 | 0,0000 | |||||
| SU / Suncor Energy Inc. | 0,00 | -100,00 | 0,00 | 0,0000 | |||||
| ELV / Elevance Health, Inc. | 0,00 | -100,00 | 0,00 | 0,0000 | |||||
| MSM / MSC Industrial Direct Co., Inc. | 0,00 | -100,00 | 0,00 | 0,0000 | |||||
| TRS / TriMas Corporation | 0,00 | -100,00 | 0,00 | 0,0000 | |||||
| RHI / Robert Half Inc. | 0,00 | -100,00 | 0,00 | 0,0000 | |||||
| OIH / VanEck ETF Trust - VanEck Oil Services ETF | 0,00 | -100,00 | 0,00 | 0,0000 | |||||
| FSK / FS KKR Capital Corp. | 0,00 | -100,00 | 0,00 | 0,0000 | |||||
| NTAP / NetApp, Inc. | 0,00 | -100,00 | 0,00 | 0,0000 | |||||
| GOOGL / Alphabet Inc. | 0,00 | -100,00 | 0,00 | 0,0000 | |||||
| ITB / iShares Trust - iShares U.S. Home Construction ETF | 0,00 | -100,00 | 0,00 | 0,0000 | |||||
| DNOW / DNOW Inc. | 0,00 | -100,00 | 0,00 | 0,0000 | |||||
| DNB / Dun & Bradstreet Holdings, Inc. | 0,00 | -100,00 | 0,00 | 0,0000 | |||||
| CNC / Centene Corporation | 0,00 | -100,00 | 0,00 | 0,0000 | |||||
| HUM / Humana Inc. | 0,00 | -100,00 | 0,00 | 0,0000 | |||||
| PFE / Pfizer Inc. | 0,00 | -100,00 | 0,00 | 0,0000 | |||||
| NKE / NIKE, Inc. | 0,00 | -100,00 | 0,00 | 0,0000 | |||||
| UNH / UnitedHealth Group Incorporated | 0,00 | -100,00 | 0,00 | 0,0000 | |||||
| IPG / The Interpublic Group of Companies, Inc. | 0,00 | -100,00 | 0,00 | 0,0000 | |||||
| AGX / Argan, Inc. | 0,00 | -100,00 | 0,00 | 0,0000 | |||||
| ACI / Albertsons Companies, Inc. | 0,00 | -100,00 | 0,00 | 0,0000 | |||||
| TH / Target Hospitality Corp. | 0,00 | -100,00 | 0,00 | 0,0000 | |||||
| GPN / Global Payments Inc. | 0,00 | -100,00 | 0,00 | 0,0000 |