Statistiques de base
| Actions institutionnelles (Long) | 20 682 203 - 18,73% (ex 13D/G) - change of -8,60MM shares -29,37% MRQ |
| Valeur institutionnelle (Long) | $ 609 241 USD ($1000) |
Participation institutionnels et actionnaires
AllianceBernstein Holding L.P. - Limited Partnership (US:AB) détient 311 des propriétaires institutionnels et des actionnaires qui ont déposé des formulaires 13D/G ou 13F auprès de la Securities Exchange Commission (SEC). Ces institutions détiennent un total de 20,682,203 actions. Les principaux actionnaires incluent Kingstone Capital Partners Texas, LLC, Fmr Llc, FCPVX - Fidelity Small Cap Value Fund, American Century Companies Inc, Bank Of America Corp /de/, TWEIX - Equity Income Fund Investor Class, PGOAX - PGIM JENNISON SMALL COMPANY FUND Class A, Morgan Stanley, Wells Fargo & Company/mn, and FDMLX - Fidelity Series Intrinsic Opportunities Fund .
AllianceBernstein Holding L.P. - Limited Partnership (NYSE:AB) la structure de l'actionnariat institutionnel indique les positions actuelles des institutions et des fonds dans l'entreprise, ainsi que les derniers changements dans le volume des positions. Les principaux actionnaires peuvent être des investisseurs individuels, des fonds communs de placement, des fonds spéculatifs ou des institutions. L'annexe 13D indique que l'investisseur détient (ou a détenu) plus de 5 % de l'entreprise et qu'il a l'intention (ou a eu l'intention) de poursuivre activement un changement de stratégie commerciale. L'annexe 13G indique un investissement passif de plus de 5 %.
The share price as of September 11, 2025 is 38,36 / share. Previously, on September 12, 2024, the share price was 34,21 / share. This represents an increase of 12,13% over that period.

Indice de confiance des fonds
L'indice de confiance des fonds (anciennement score d'accumulation de participation) trouve les actions qui sont les plus achetées par les fonds. Il est le résultat d'un modèle quantitatif sophistiqué à plusieurs facteurs qui identifie les entreprises avec les niveaux les plus élevés d'accumulation institutionnelle. Le modèle de notation utilise une combinaison de l'augmentation totale des propriétaires déclarés, des variations des allocations de portefeuille chez ces propriétaires et d'autres indicateurs. Le chiffre varie de 0 à 100, les chiffres plus élevés indiquant un niveau d'accumulation plus élevé par rapport aux autres entreprises, 50 étant la moyenne.
Fréquence de mise à jour : Quotidienne
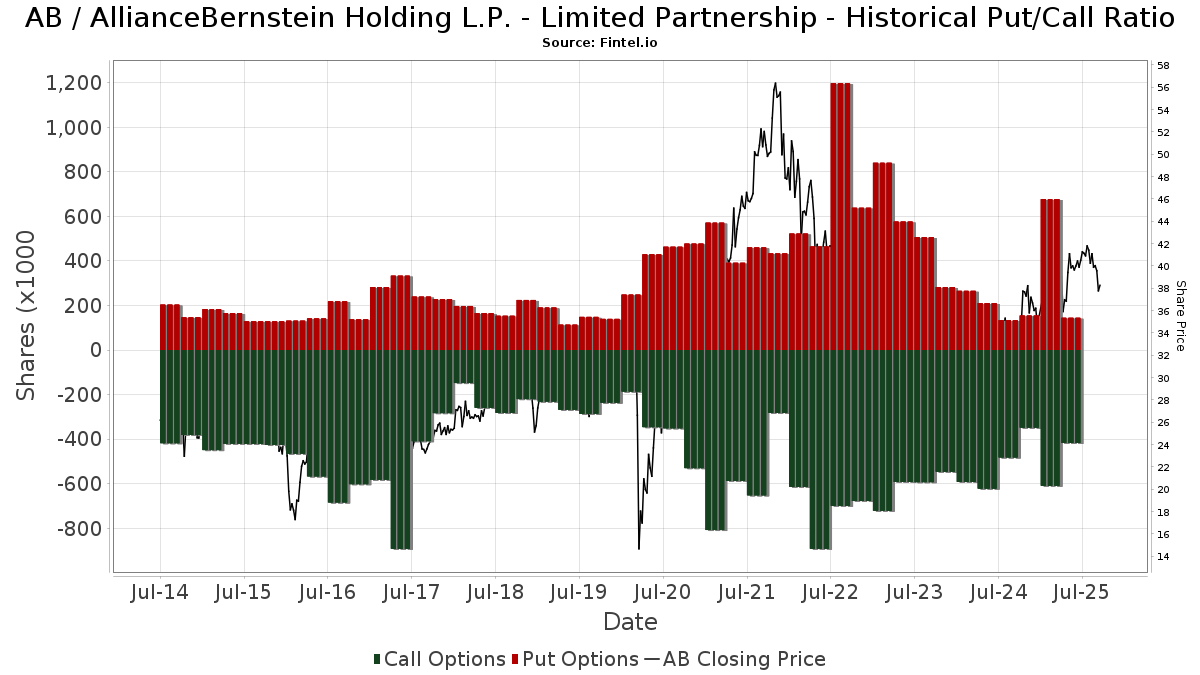
Ratio put/call institutionnel
En plus de signaler les actions et les dettes standard, les institutions ayant plus de 100 millions d'actifs sous gestion doivent également divulguer leurs positions en options de vente et d'achat. Étant donné que les options de vente indiquent généralement une confiance négative, et les options d'achat indiquent une confiance positive, nous pouvons avoir une idée de la confiance institutionnelle globale en traçant le ratio des ventes à découvert par rapport aux achats d'options. Le graphique à droite trace l'historique du ratio des ventes à découvert/achats d'options pour cet instrument.
L'utilisation du ratio put/call comme indicateur de la confiance des investisseurs permet de pallier à l'une des principales lacunes de l'utilisation de la participation institutionnelle totale, à savoir qu'une part importante des actifs sous gestion est investie passivement pour suivre les indices. Les fonds gérés passivement n'achètent généralement pas d'options, de sorte que l'indicateur du ratio put/call suit de plus près la confiance des fonds gérés activement.
Déclarations 13D/G
Nous présentons les dépôts 13D/G séparément des dépôts 13F en raison de leur traitement différent par la SEC. Les déclarations 13D/G peuvent être déposées par des groupes d'investisseurs (avec un leader), ce qui n'est pas le cas des déclarations 13F. Il en résulte des situations dans lesquelles un investisseur peut déposer une déclaration 13D/G indiquant une valeur pour le total des actions (représentant toutes les actions détenues par le groupe d'investisseurs), mais déposer ensuite une déclaration 13F indiquant une valeur différente pour le total des actions (représentant strictement ses propres actions). Cela signifie que l'actionnariat des déclarations 13D/G et des déclarations 13F n'est souvent pas directement comparable, c'est pourquoi nous les présentons séparément.
Note : À compter du 16 mai 2021, nous n'affichons plus les propriétaires qui n'ont pas déposé de déclaration 13D/G au cours de l'année écoulée. Auparavant, nous montrions l'historique complet des déclarations 13D/G. En général, les entités qui sont tenues de déposer des déclarations 13D/G doivent le faire au moins une fois par an avant de soumettre une déclaration de clôture. Cependant, il arrive que des fonds sortent de positions sans soumettre de déclaration de clôture (c'est-à-dire qu'ils procèdent à une liquidation), de sorte que l'affichage de l'historique complet pouvait prêter à confusion quant à l'actionnariat actuel. Pour éviter toute confusion, nous n'affichons désormais que les propriétaires "actuels", c'est-à-dire les propriétaires qui ont déposé des documents au cours de l'année écoulée.
Upgrade to unlock premium data.
| Date de dépôt | Formulaire | Investisseur | Actions précédentes |
Actions actuelles |
&Delta ; Actions (Pourcentage) |
Participation (Pourcentage) |
&Delta ; Participation (Pourcentage) |
|
|---|---|---|---|---|---|---|---|---|
| 2025-07-14 | Equitable Holdings, Inc. | 184,336,885 | 199,231,025 | 8.08 | 68.17 | 8.02 |
Déclarations 13F et NPORT
Les détails des déclarations 13F sont gratuits. Les détails des déclarations NP nécessitent une adhésion premium. Les lignes vertes indiquent de nouvelles positions. Les lignes rouges indiquent des positions clôturées. Cliquez sur l'icône du lien pour voir l'historique complet des transactions.
Mettre à niveau
pour débloquer des données premium et les exporter vers Excel ![]() .
.
| Date de dépôt | Source | Investisseur | Type | Prix moyen (Est) |
Actions | Δ Actions (%) |
Valeur déclarée (1000 $) |
Δ Valeur (%) |
Allocation de portefeuille (%) |
|
|---|---|---|---|---|---|---|---|---|---|---|
| 2025-08-05 | 13F | Simplex Trading, Llc | Put | 12 700 | -11,19 | 1 | ||||
| 2025-05-13 | 13F | Cresset Asset Management, LLC | 0 | -100,00 | 0 | |||||
| 2025-03-21 | NP | AAARX - Strategic Allocation: Aggressive Fund R Class This fund is a listed as child fund of American Century Companies Inc and if that institution has disclosed ownership in this security, then these positions will not be double counted when calculating total shares and total value | 5 572 | 9,75 | 223 | 18,62 | ||||
| 2025-08-05 | 13F | Simplex Trading, Llc | 911 | 0 | ||||||
| 2025-08-07 | 13F | Kestra Private Wealth Services, Llc | 0 | -100,00 | 0 | |||||
| 2025-08-05 | 13F | Simplex Trading, Llc | Call | 12 500 | -63,45 | 1 | -100,00 | |||
| 2025-08-13 | 13F | Gabelli Funds Llc | 60 000 | -69,23 | 2 450 | -67,22 | ||||
| 2025-08-13 | 13F | Cary Street Partners Financial Llc | 7 860 | 0,87 | 321 | 7,38 | ||||
| 2025-07-14 | 13F | Armstrong Advisory Group, Inc | 503 | 0,00 | 21 | 11,11 | ||||
| 2025-08-14 | 13F | Ursa Fund Management, LLC | 0 | -100,00 | 0 | |||||
| 2025-05-16 | 13F | Coppell Advisory Solutions LLC | 0 | -100,00 | 0 | |||||
| 2025-07-11 | 13F | Caldwell Securities, Inc | 3 520 | -2,36 | 144 | 3,62 | ||||
| 2025-08-14 | 13F | CIBC World Markets Inc. | 0 | -100,00 | 0 | |||||
| 2025-08-12 | 13F | Coldstream Capital Management Inc | 0 | -100,00 | 0 | |||||
| 2025-05-07 | 13F | Sheaff Brock Investment Advisors, LLC | 6 680 | 0,00 | 256 | 3,24 | ||||
| 2025-08-14 | 13F | RBF Capital, LLC | 30 000 | 0,00 | 1 225 | 6,53 | ||||
| 2025-08-14 | 13F | RMB Capital Management, LLC | 7 575 | 309 | ||||||
| 2025-08-11 | 13F | FSA Wealth Management LLC | 604 | 0,00 | 25 | 4,35 | ||||
| 2025-08-11 | 13F | Citigroup Inc | 27 115 | 1 255,75 | 1 107 | 1 356,58 | ||||
| 2025-05-12 | 13F | Sandy Spring Bank | 0 | -100,00 | 0 | |||||
| 2025-08-11 | 13F | Regal Investment Advisors LLC | 7 290 | -10,10 | 298 | -4,19 | ||||
| 2025-08-19 | 13F | State of Wyoming | 8 599 | -3,03 | 351 | 3,54 | ||||
| 2025-08-07 | 13F | Allworth Financial LP | 6 615 | 1 102,73 | 270 | 1 250,00 | ||||
| 2025-08-14 | 13F | Peak6 Llc | Call | 34 100 | 3 000,00 | 1 392 | 3 214,29 | |||
| 2025-05-29 | NP | DSMC - Distillate Small/Mid Cash Flow ETF | 13 155 | -6,28 | 504 | 2,86 | ||||
| 2025-08-15 | 13F | CI Private Wealth, LLC | 20 445 | 4,42 | 835 | 11,20 | ||||
| 2025-08-12 | 13F | J.w. Cole Advisors, Inc. | 12 323 | 62,68 | 503 | 73,45 | ||||
| 2025-08-11 | 13F | Western Wealth Management, LLC | 9 599 | 0,05 | 392 | 6,54 | ||||
| 2025-08-18 | 13F/A | National Bank Of Canada /fi/ | 255 | -16,67 | 10 | -9,09 | ||||
| 2025-08-05 | 13F | Fourth Dimension Wealth, LLC | 240 | 0,00 | 10 | 0,00 | ||||
| 2025-08-11 | 13F | Nicola Wealth Management Ltd. | 114 000 | -26,45 | 4 655 | -21,62 | ||||
| 2025-08-13 | 13F | Mackenzie Financial Corp | 13 430 | -8,14 | 548 | -2,14 | ||||
| 2025-08-12 | 13F | Proequities, Inc. | Put | 0 | 0 | |||||
| 2025-08-12 | 13F | Proequities, Inc. | Call | 0 | 0 | |||||
| 2025-08-12 | 13F | Proequities, Inc. | 0 | 0 | ||||||
| 2025-08-06 | 13F | Equitec Proprietary Markets, Llc | 0 | -100,00 | 0 | |||||
| 2025-08-15 | 13F | Equitable Holdings, Inc. | 19 973 | 79,87 | 815 | 91,76 | ||||
| 2025-08-06 | 13F | Equitec Proprietary Markets, Llc | Call | 0 | -100,00 | 0 | ||||
| 2025-07-29 | 13F | Chevy Chase Trust Holdings, Inc. | 9 000 | 0,00 | 367 | 6,69 | ||||
| 2025-07-08 | 13F/A | Salem Investment Counselors Inc | 450 | 0,00 | 18 | 5,88 | ||||
| 2025-08-08 | 13F | TD Capital Management LLC | 226 | 0,00 | 9 | 12,50 | ||||
| 2025-08-08 | 13F | Hartland & Co., LLC | 444 | -10,12 | 18 | 0,00 | ||||
| 2025-07-17 | 13F/A | Capital Investment Advisors, LLC | 5 185 | -1,33 | 212 | 4,98 | ||||
| 2025-08-14 | 13F | Nomura Holdings Inc | 0 | -100,00 | 0 | |||||
| 2025-08-14 | 13F | Schonfeld Strategic Advisors LLC | Put | 0 | -100,00 | 0 | ||||
| 2025-08-01 | 13F | Rossby Financial, LCC | 300 | 0,00 | 12 | 9,09 | ||||
| 2025-08-06 | 13F | Equitec Proprietary Markets, Llc | Put | 0 | -100,00 | 0 | ||||
| 2025-07-17 | 13F | Sonora Investment Management Group, LLC | 8 927 | 0,89 | 364 | 7,69 | ||||
| 2025-08-13 | 13F | Callodine Capital Management, LP | 0 | -100,00 | 0 | |||||
| 2025-06-30 | NP | RIVSX - River Oak Discovery Fund | 21 518 | 0,00 | 848 | -1,74 | ||||
| 2025-08-14 | 13F | Balyasny Asset Management Llc | Put | 0 | -100,00 | 0 | ||||
| 2025-08-07 | 13F | Americana Partners, LLC | 5 062 | 207 | ||||||
| 2025-08-14 | 13F | GWM Advisors LLC | 3 298 | 0,58 | 135 | 7,20 | ||||
| 2025-05-30 | NP | GABCX - The Gabelli Abc Fund Class Aaa | 120 000 | 207,69 | 4 597 | 217,91 | ||||
| 2025-05-27 | NP | Advanced Series Trust - Ast Prudential Growth Allocation Portfolio | 12 056 | -11,43 | 462 | -8,53 | ||||
| 2025-08-04 | 13F | Assetmark, Inc | 1 | -97,67 | 0 | -100,00 | ||||
| 2025-07-10 | 13F | Atticus Wealth Management, Llc | 2 345 | 0,00 | 96 | 6,74 | ||||
| 2025-08-13 | 13F | Lido Advisors, LLC | 15 267 | -0,01 | 623 | 6,68 | ||||
| 2025-08-13 | 13F | Four Tree Island Advisory LLC | 208 083 | 0,00 | 8 496 | 6,59 | ||||
| 2025-07-08 | 13F | Nbc Securities, Inc. | 126 | -94,50 | 0 | |||||
| 2025-08-29 | NP | GCAEX - The Gabelli Equity Income Fund Class A | 20 000 | 0,00 | 817 | 6,53 | ||||
| 2025-07-18 | 13F/A | MJT & Associates Financial Advisory Group, Inc. | 187 | 0,00 | 8 | 0,00 | ||||
| 2025-08-14 | 13F | Schonfeld Strategic Advisors LLC | Call | 0 | -100,00 | 0 | ||||
| 2025-07-22 | 13F | Iron Horse Wealth Management, LLC | 286 | 12 | ||||||
| 2025-07-16 | 13F | Essex Financial Services, Inc. | 6 995 | 0,00 | 286 | 6,74 | ||||
| 2025-08-07 | 13F | Resources Investment Advisors, LLC. | 16 201 | 13,34 | 661 | 20,84 | ||||
| 2025-08-15 | 13F | Tower Research Capital LLC (TRC) | 124 | -87,44 | 5 | -86,49 | ||||
| 2025-04-14 | 13F | IMC-Chicago, LLC | Call | 0 | -100,00 | 0 | -100,00 | |||
| 2025-08-13 | 13F | MONECO Advisors, LLC | 10 495 | -8,05 | 429 | -2,06 | ||||
| 2025-07-24 | 13F | Baldwin Brothers Inc/ma | 17 525 | 0,00 | 716 | 6,56 | ||||
| 2025-07-09 | 13F | Bank of New Hampshire | 300 | 12 | ||||||
| 2025-07-25 | NP | TEMGX - Templeton Global Smaller Companies Fund Class A | 375 765 | -1,67 | 15 012 | 4,30 | ||||
| 2025-08-14 | 13F | Beck Mack & Oliver Llc | 7 658 | -13,55 | 313 | -7,96 | ||||
| 2025-08-11 | 13F | Principal Securities, Inc. | 479 | -24,21 | 20 | -17,39 | ||||
| 2025-04-22 | 13F | Duncker Streett & Co Inc | 0 | -100,00 | 0 | |||||
| 2025-06-09 | NP | Bmc Fund Inc | 1 312 | 0,00 | 52 | -1,92 | ||||
| 2025-08-01 | 13F | Vision Financial Markets Llc | 5 800 | 0,00 | 237 | 6,31 | ||||
| 2025-08-14 | 13F | Kovitz Investment Group Partners, LLC | 5 214 | 213 | ||||||
| 2025-07-17 | 13F | Oakworth Capital, Inc. | 0 | -100,00 | 0 | |||||
| 2025-03-21 | NP | AACRX - Strategic Allocation: Conservative Fund R Class This fund is a listed as child fund of American Century Companies Inc and if that institution has disclosed ownership in this security, then these positions will not be double counted when calculating total shares and total value | 1 530 | 27,39 | 61 | 38,64 | ||||
| 2025-08-01 | 13F | Bessemer Group Inc | 4 001 | 0 | ||||||
| 2025-08-14 | 13F | 10Elms LLP | 15 460 | 0,00 | 631 | 6,59 | ||||
| 2025-08-12 | 13F | Steward Partners Investment Advisory, Llc | 4 135 | 0,00 | 169 | 6,33 | ||||
| 2025-05-30 | NP | Gabelli Global Utility & Income Trust | 5 000 | -28,57 | 192 | -26,25 | ||||
| 2025-05-02 | 13F | Fortis Group Advisors, LLC | 0 | -100,00 | 0 | |||||
| 2025-08-08 | 13F | Compass Wealth Management LLC | 0 | -100,00 | 0 | |||||
| 2025-07-16 | 13F | Formidable Asset Management, LLC | 22 320 | 0,00 | 855 | 0,00 | ||||
| 2025-07-25 | 13F | We Are One Seven, LLC | 27 882 | -2,64 | 1 138 | 3,74 | ||||
| 2025-08-08 | 13F | Sittner & Nelson, Llc | 8 100 | 0,00 | 331 | 6,45 | ||||
| 2025-08-15 | 13F | Resources Management Corp /ct/ /adv | 15 550 | -1,11 | 1 | |||||
| 2025-07-21 | 13F | DHJJ Financial Advisors, Ltd. | 16 | 0,00 | 1 | |||||
| 2025-08-05 | 13F | GPS Wealth Strategies Group, LLC | 1 435 | 0,00 | 59 | 7,41 | ||||
| 2025-08-08 | 13F | Cetera Investment Advisers | 126 153 | -3,20 | 5 151 | 3,17 | ||||
| 2025-08-12 | 13F | XTX Topco Ltd | 35 384 | 349,43 | 1 445 | 379,73 | ||||
| 2025-07-31 | 13F | Oppenheimer & Co Inc | 17 876 | -10,49 | 730 | -4,71 | ||||
| 2025-08-08 | 13F | Avantax Advisory Services, Inc. | 15 644 | -4,95 | 639 | 1,27 | ||||
| 2025-08-14 | 13F | American Trust Investment Advisors, LLC | 0 | -100,00 | 0 | |||||
| 2025-08-14 | 13F | Ancora Advisors, LLC | 11 550 | 0,00 | 472 | 6,56 | ||||
| 2025-07-16 | 13F | Cadent Capital Advisors, LLC | 10 080 | 0,00 | 412 | 6,48 | ||||
| 2025-08-15 | NP | Guardian Variable Products Trust - Guardian Select Mid Cap Core VIP Fund | 20 934 | -1,91 | 855 | 4,53 | ||||
| 2025-06-26 | NP | FAFDX - Fidelity Advisor Financial Services Fund Class A This fund is a listed as child fund of Fmr Llc and if that institution has disclosed ownership in this security, then these positions will not be double counted when calculating total shares and total value | 138 700 | -42,64 | 5 465 | -43,59 | ||||
| 2025-05-15 | 13F | Manufacturers Life Insurance Company, The | 0 | -100,00 | 0 | |||||
| 2025-07-28 | 13F | BRYN MAWR TRUST Co | 5 150 | 0,00 | 210 | 6,60 | ||||
| 2025-08-12 | 13F | Horizon Kinetics Asset Management Llc | 164 892 | 42,17 | 6 733 | 51,52 | ||||
| 2025-04-24 | NP | PFSAX - PGIM Jennison Financial Services Fund Class A | 27 126 | -53,91 | 1 022 | -52,16 | ||||
| 2025-08-15 | 13F | 44 Wealth Management Llc | 5 000 | 204 | ||||||
| 2025-07-31 | 13F | Richards, Merrill & Peterson, Inc. | 0 | -100,00 | 0 | |||||
| 2025-07-29 | NP | BPSIX - Boston Partners Small Cap Value Fund II INSTITUTIONAL | 36 797 | -3,62 | 1 470 | 2,30 | ||||
| 2025-08-14 | 13F | Vident Advisory, LLC | 0 | -100,00 | 0 | |||||
| 2025-08-14 | 13F | 683 Capital Management, LLC | 0 | -100,00 | 0 | |||||
| 2025-08-15 | 13F | Morgan Stanley | 644 042 | -86,31 | 26 296 | -85,41 | ||||
| 2025-07-24 | 13F | Trust Co Of Toledo Na /oh/ | 500 | 20 | ||||||
| 2025-08-12 | 13F | Oak Associates Ltd /oh/ | 23 711 | 3,00 | 968 | 9,88 | ||||
| 2025-08-13 | 13F | Blue Fin Capital, Inc. | 26 717 | -33,45 | 1 091 | -26,80 | ||||
| 2025-08-04 | 13F | Pensionmark Financial Group, Llc | 8 717 | 0,00 | 356 | 6,61 | ||||
| 2025-07-11 | 13F | Grove Bank & Trust | 500 | 20 | ||||||
| 2025-08-12 | 13F | Franklin Resources Inc | 384 740 | -1,14 | 15 709 | 5,37 | ||||
| 2025-08-13 | 13F | JBR Co Financial Management Inc | 13 605 | 13,06 | 555 | 20,65 | ||||
| 2025-04-03 | 13F | Central Pacific Bank - Trust Division | 0 | -100,00 | 0 | -100,00 | ||||
| 2025-05-14 | 13F | Brown Brothers Harriman & Co | 0 | -100,00 | 0 | |||||
| 2025-07-28 | 13F | Disciplined Equity Management, Inc. | 60 293 | 12,06 | 2 462 | 19,41 | ||||
| 2025-08-11 | 13F | Private Advisor Group, LLC | 12 291 | -73,81 | 502 | -72,14 | ||||
| 2025-04-22 | 13F | Brown, Lisle/cummings, Inc. | 0 | -100,00 | 0 | -100,00 | ||||
| 2025-08-01 | 13F | Brookwood Investment Group LLC | 27 344 | 76,47 | 1 116 | 88,20 | ||||
| 2025-05-23 | NP | PGOAX - PGIM JENNISON SMALL COMPANY FUND Class A | 872 376 | 0,00 | 33 421 | 3,29 | ||||
| 2025-08-08 | 13F | Larson Financial Group LLC | 1 500 | 0,00 | 61 | 7,02 | ||||
| 2025-08-14 | 13F | Integrated Wealth Concepts LLC | 5 618 | -4,47 | 229 | 1,78 | ||||
| 2025-08-12 | 13F | Bokf, Na | 800 | 0,00 | 33 | 6,67 | ||||
| 2025-08-19 | 13F | Newbridge Financial Services Group, Inc. | 100 | 0,00 | 4 | 33,33 | ||||
| 2025-05-15 | 13F | Talon Private Wealth, LLC | 0 | -100,00 | 0 | |||||
| 2025-08-19 | 13F | Advisory Services Network, LLC | 7 525 | 0,56 | 307 | 6,99 | ||||
| 2025-08-07 | 13F | CENTRAL TRUST Co | 1 000 | 0,00 | 41 | 5,26 | ||||
| 2025-08-12 | 13F | CIBC Private Wealth Group, LLC | 1 | 0,00 | 0 | |||||
| 2025-07-24 | NP | FMCDX - Fidelity Advisor Stock Selector Mid Cap Fund Class A This fund is a listed as child fund of Fmr Llc and if that institution has disclosed ownership in this security, then these positions will not be double counted when calculating total shares and total value | 245 809 | -28,90 | 9 820 | -24,57 | ||||
| 2025-08-14 | 13F | Ieq Capital, Llc | 6 200 | 0,00 | 253 | 6,75 | ||||
| 2025-06-26 | NP | FCPVX - Fidelity Small Cap Value Fund This fund is a listed as child fund of Fmr Llc and if that institution has disclosed ownership in this security, then these positions will not be double counted when calculating total shares and total value | 1 606 357 | 4,43 | 63 290 | 2,71 | ||||
| 2025-07-15 | 13F | Northside Capital Management, LLC | 13 625 | 556 | ||||||
| 2025-08-13 | 13F | Haverford Trust Co | 7 906 | 0,00 | 323 | 6,62 | ||||
| 2025-04-25 | NP | CFMCX - Column Mid Cap Fund | 17 395 | 0,68 | 655 | 4,63 | ||||
| 2025-08-11 | 13F | Rothschild Investment Llc | 7 500 | 0,00 | 306 | 6,62 | ||||
| 2025-08-05 | 13F | Bank Of Montreal /can/ | 0 | -100,00 | 0 | |||||
| 2025-08-14 | 13F | Sit Investment Associates Inc | 40 200 | 0,00 | 2 | 0,00 | ||||
| 2025-07-21 | 13F | Ameritas Advisory Services, LLC | 22 079 | -2,65 | 901 | 3,92 | ||||
| 2025-08-14 | 13F | Alpine Global Management, LLC | 0 | -100,00 | 0 | |||||
| 2025-07-29 | 13F | Stratos Wealth Partners, LTD. | 12 901 | -2,61 | 527 | 3,75 | ||||
| 2025-08-14 | 13F | Williams Jones Wealth Management, LLC. | 81 600 | -2,04 | 3 332 | 4,39 | ||||
| 2025-04-22 | 13F | Center for Financial Planning, Inc. | 0 | -100,00 | 0 | |||||
| 2025-08-14 | 13F | Hrt Financial Lp | 108 143 | 438,08 | 4 | |||||
| 2025-08-14 | 13F | Wells Fargo & Company/mn | 456 156 | 1,67 | 18 625 | 8,35 | ||||
| 2025-07-15 | 13F | Tepp RIA, LLC | 7 683 | 0,00 | 314 | 6,46 | ||||
| 2025-07-30 | 13F | D.a. Davidson & Co. | 149 922 | 1,44 | 6 121 | 8,13 | ||||
| 2025-08-14 | 13F | Ausdal Financial Partners, Inc. | 5 133 | 210 | ||||||
| 2025-08-14 | 13F | CoreFirst Bank & Trust | 600 | 24 | ||||||
| 2025-07-31 | 13F | Glass Jacobson Investment Advisors llc | 1 129 | 4,93 | 46 | 17,95 | ||||
| 2025-08-14 | 13F | Peak6 Llc | 0 | -100,00 | 0 | |||||
| 2025-08-12 | 13F | CFC Planning Co LLC | 5 633 | 230 | ||||||
| 2025-07-31 | 13F | Orion Capital Management LLC | 4 | 0,00 | 0 | |||||
| 2025-07-25 | 13F | Joel Adams & Associates, Inc. | 5 000 | 204 | ||||||
| 2025-05-02 | 13F | Cullen/frost Bankers, Inc. | 0 | -100,00 | 0 | |||||
| 2025-08-18 | 13F | Second Line Capital, LLC | 9 295 | 13,98 | 379 | 21,47 | ||||
| 2025-08-11 | 13F | HighTower Advisors, LLC | 32 568 | 3,60 | 1 330 | 10,38 | ||||
| 2025-08-14 | 13F | Bank Of America Corp /de/ | 1 083 131 | -19,54 | 44 224 | -14,25 | ||||
| 2025-08-08 | 13F | WASHINGTON TRUST Co | 0 | -100,00 | 0 | |||||
| 2025-08-05 | 13F | Scarborough Advisors, LLC | 279 | 11 | ||||||
| 2025-08-15 | 13F | Captrust Financial Advisors | 8 973 | -4,33 | 366 | 1,95 | ||||
| 2025-07-23 | 13F | Tyche Wealth Partners LLC | 5 000 | 204 | ||||||
| 2025-07-18 | 13F | Consolidated Planning Corp | 7 051 | 0,00 | 288 | 6,30 | ||||
| 2025-08-14 | 13F | IPG Investment Advisors LLC | 0 | -100,00 | 0 | |||||
| 2025-08-07 | 13F | Merrion Investment Management Co, LLC | 6 500 | 0,00 | 265 | 6,43 | ||||
| 2025-08-13 | 13F | Virtus ETF Advisers LLC | 0 | -100,00 | 0 | |||||
| 2025-05-13 | 13F | State of Tennessee, Treasury Department | 0 | -100,00 | 0 | |||||
| 2025-08-26 | NP | AZBAX - AllianzGI Small-Cap Fund Class A | 7 513 | -51,88 | 307 | -48,83 | ||||
| 2025-07-22 | 13F | Belpointe Asset Management LLC | 19 311 | -12,02 | 788 | -6,19 | ||||
| 2025-08-13 | 13F | Transce3nd, LLC | 670 | -0,74 | 27 | 8,00 | ||||
| 2025-08-13 | 13F | Northwestern Mutual Wealth Management Co | 17 654 | 0,87 | 721 | 7,46 | ||||
| 2025-07-25 | 13F | Johnson Investment Counsel Inc | 10 434 | 0,00 | 426 | 6,77 | ||||
| 2025-07-18 | 13F | CHURCHILL MANAGEMENT Corp | 314 844 | -2,01 | 12 855 | 4,44 | ||||
| 2025-08-14 | 13F | Sei Investments Co | 9 563 | -48,27 | 390 | -44,92 | ||||
| 2025-07-08 | 13F | Parallel Advisors, LLC | 350 | 0,57 | 14 | 7,69 | ||||
| 2025-08-01 | 13F | Chilton Capital Management Llc | 31 190 | 0,00 | 1 273 | 6,62 | ||||
| 2025-08-11 | 13F | Delta Asset Management Llc/tn | 310 | 0,00 | 13 | 9,09 | ||||
| 2025-05-07 | 13F | Bastion Asset Management Inc. | 0 | -100,00 | 0 | -100,00 | ||||
| 2025-05-15 | 13F | Virtus Investment Advisers, Inc. | 0 | -100,00 | 0 | |||||
| 2025-07-25 | 13F | LRI Investments, LLC | 197 | 0,00 | 8 | 14,29 | ||||
| 2025-07-21 | 13F | Ameriflex Group, Inc. | 0 | -100,00 | 0 | |||||
| 2025-08-14 | 13F | Summit Trail Advisors, Llc | 8 755 | 0,00 | 357 | 6,57 | ||||
| 2025-08-18 | 13F | Geneos Wealth Management Inc. | 1 992 | 1,17 | 81 | 8,00 | ||||
| 2025-08-14 | 13F | Citadel Advisors Llc | Call | 56 800 | -51,54 | 2 319 | -48,34 | |||
| 2025-08-14 | 13F | Citadel Advisors Llc | 10 805 | -98,04 | 441 | -97,91 | ||||
| 2025-08-14 | 13F | Citadel Advisors Llc | Put | 72 200 | -33,09 | 2 948 | -28,70 | |||
| 2025-08-18 | 13F | Old North State Trust, LLC | 6 035 | 0,00 | 0 | |||||
| 2025-07-18 | 13F | Chelsea Counsel Co | 95 330 | 807,90 | 3 892 | 868,16 | ||||
| 2025-08-14 | 13F | Herold Advisors, Inc. | 15 700 | 0,00 | 641 | 6,66 | ||||
| 2025-08-13 | 13F | Truvestments Capital Llc | 939 | 2,07 | 38 | 8,57 | ||||
| 2025-03-21 | NP | TWSMX - Strategic Allocation: Moderate Fund Investor Class This fund is a listed as child fund of American Century Companies Inc and if that institution has disclosed ownership in this security, then these positions will not be double counted when calculating total shares and total value | 4 866 | 9,87 | 195 | 18,29 | ||||
| 2025-08-14 | 13F/A | Rockefeller Capital Management L.P. | 61 215 | 0,20 | 2 499 | 6,79 | ||||
| 2025-08-13 | 13F | M&t Bank Corp | 42 540 | 0,00 | 1 737 | 6,57 | ||||
| 2025-08-12 | 13F | BlackRock, Inc. | 675 | 0,00 | 28 | 8,00 | ||||
| 2025-08-14 | 13F | Royal Bank Of Canada | 95 627 | 8,20 | 3 904 | 15,30 | ||||
| 2025-08-15 | 13F | Kestra Advisory Services, LLC | 78 690 | -0,06 | 3 213 | 6,50 | ||||
| 2025-07-28 | 13F | Private Wealth Asset Management, LLC | 0 | -100,00 | 0 | |||||
| 2025-08-14 | 13F | Infrastructure Capital Advisors, Llc | 0 | -100,00 | 0 | |||||
| 2025-07-07 | 13F | Walnut Private Equity Partners, Llc | 25 949 | 0,00 | 1 059 | 6,54 | ||||
| 2025-08-14 | 13F | Mercer Global Advisors Inc /adv | 7 821 | -4,62 | 319 | 1,59 | ||||
| 2025-08-13 | 13F | Jones Financial Companies Lllp | 7 152 | 104,28 | 289 | 115,67 | ||||
| 2025-08-08 | 13F | Pnc Financial Services Group, Inc. | 1 829 | 0,00 | 75 | 5,71 | ||||
| 2025-04-21 | 13F | Ronald Blue Trust, Inc. | 0 | -100,00 | 0 | |||||
| 2025-04-29 | 13F | Hm Payson & Co | 1 000 | 0,00 | 38 | 2,70 | ||||
| 2025-08-01 | 13F | Gwn Securities Inc. | 0 | -100,00 | 0 | |||||
| 2025-08-08 | 13F | Creative Planning | 14 669 | 19,50 | 599 | 27,23 | ||||
| 2025-08-15 | 13F | Prevail Innovative Wealth Advisors, Llc | 21 822 | 98,04 | 891 | 110,90 | ||||
| 2025-08-01 | 13F | Jennison Associates Llc | 0 | -100,00 | 0 | |||||
| 2025-08-13 | 13F | Epoch Investment Partners, Inc. | 25 038 | -83,32 | 1 022 | -82,23 | ||||
| 2025-08-14 | 13F | Harvest Management Llc | 0 | -100,00 | 0 | |||||
| 2025-08-13 | 13F | Northern Trust Corp | 0 | -100,00 | 0 | |||||
| 2025-08-14 | 13F | Hurley Capital, LLC | 186 | 2,20 | 8 | 16,67 | ||||
| 2025-05-14 | 13F | Basswood Capital Management, L.l.c. | 0 | -100,00 | 0 | -100,00 | ||||
| 2025-08-06 | 13F | Van Cleef Asset Management,Inc | 6 525 | -1,88 | 266 | 4,72 | ||||
| 2025-04-25 | 13F | Stonebridge Financial Group, LLC | 0 | -100,00 | 0 | -100,00 | ||||
| 2025-08-12 | 13F | PSI Advisors, LLC | 0 | -100,00 | 0 | |||||
| 2025-08-11 | 13F | BluePath Capital Management, LLC | 28 437 | 22,14 | 1 161 | 30,30 | ||||
| 2025-07-16 | 13F | PFS Partners, LLC | 190 | 0,00 | 8 | 0,00 | ||||
| 2025-04-14 | 13F | Beach Investment Counsel Inc/pa | 12 125 | 0,00 | 0 | |||||
| 2025-05-13 | 13F | Beacon Pointe Advisors, LLC | 0 | -100,00 | 0 | -100,00 | ||||
| 2025-08-06 | 13F | Prospera Financial Services Inc | 14 376 | 10,30 | 587 | 17,43 | ||||
| 2025-08-19 | 13F | Anchor Investment Management, LLC | 3 375 | 0,00 | 138 | 6,20 | ||||
| 2025-08-12 | 13F/A | Boston Partners | 37 264 | -0,95 | 1 521 | 5,55 | ||||
| 2025-04-29 | 13F | Lee Danner & Bass Inc | 0 | -100,00 | 0 | -100,00 | ||||
| 2025-07-25 | 13F | Concurrent Investment Advisors, LLC | 17 256 | 2,77 | 705 | 9,49 | ||||
| 2025-07-24 | 13F | IFP Advisors, Inc | 100 | 0,00 | 4 | 33,33 | ||||
| 2025-08-07 | 13F | Proficio Capital Partners LLC | 0 | -100,00 | 0 | |||||
| 2025-07-16 | 13F | Perigon Wealth Management, LLC | 0 | -100,00 | 0 | |||||
| 2025-07-15 | 13F | Mather Group, Llc. | 0 | -100,00 | 0 | |||||
| 2025-07-22 | 13F | Highland Capital Management, Llc | 34 915 | 112,47 | 1 426 | 126,55 | ||||
| 2025-08-13 | 13F | EverSource Wealth Advisors, LLC | 2 616 | 0,08 | 107 | 6,00 | ||||
| 2025-07-16 | 13F | FCG Investment Co | 8 873 | 362 | ||||||
| 2025-08-05 | 13F | Mission Wealth Management, Lp | 29 235 | 0,00 | 1 194 | 6,61 | ||||
| 2025-08-12 | 13F | LPL Financial LLC | 421 866 | 10,77 | 17 225 | 18,06 | ||||
| 2025-08-05 | 13F | Freestone Capital Holdings, LLC | 8 801 | 0,00 | 359 | 6,53 | ||||
| 2025-08-06 | 13F | Zevin Asset Management Llc | 6 863 | -33,42 | 0 | |||||
| 2025-08-14 | 13F | Alliancebernstein L.p. | 33 319 | 0,00 | 1 360 | 6,58 | ||||
| 2025-08-14 | 13F | Glen Eagle Advisors, LLC | 150 | -40,00 | 6 | -33,33 | ||||
| 2025-07-28 | 13F | Nadler Financial Group, Inc. | 10 840 | 0,00 | 443 | 6,51 | ||||
| 2025-07-11 | 13F/A | Umb Bank N A/mo | 1 300 | 0,00 | 53 | 8,16 | ||||
| 2025-08-06 | 13F | Moors & Cabot, Inc. | 60 134 | -2,92 | 2 455 | 3,50 | ||||
| 2025-08-25 | 13F/A | Neuberger Berman Group LLC | 363 158 | -67,94 | 14 828 | -65,84 | ||||
| 2025-08-04 | 13F | Moody Aldrich Partners Llc | 59 294 | 0,00 | 2 421 | 6,56 | ||||
| 2025-08-12 | 13F | Change Path, LLC | 5 427 | 1,04 | 222 | 7,80 | ||||
| 2025-05-09 | 13F | Blair William & Co/il | 0 | -100,00 | 0 | -100,00 | ||||
| 2025-07-23 | 13F | Sax Wealth Advisors, Llc | 6 117 | 0,00 | 250 | 6,41 | ||||
| 2025-05-15 | 13F | Barclays Plc | 0 | -100,00 | 0 | -100,00 | ||||
| 2025-07-15 | 13F | Peddock Capital Advisors, Llc | 5 780 | 0,00 | 236 | 6,33 | ||||
| 2025-07-24 | 13F | Costello Asset Management, INC | 1 900 | 0,00 | 78 | 6,94 | ||||
| 2025-08-14 | 13F | Lombard Odier Asset Management (Europe) Ltd | 0 | -100,00 | 0 | |||||
| 2025-08-29 | NP | EMAAX - Enterprise Mergers and Acquisitions Fund Class A | 0 | -100,00 | 0 | -100,00 | ||||
| 2025-08-05 | 13F | Crestwood Advisors Group LLC | 26 424 | 0,00 | 1 079 | 6,52 | ||||
| 2025-08-01 | 13F | GoalVest Advisory LLC | 783 | 0,00 | 32 | 6,90 | ||||
| 2025-08-14 | 13F | Stifel Financial Corp | 221 278 | 4,28 | 9 035 | 11,15 | ||||
| 2025-08-12 | 13F | Segall Bryant & Hamill, Llc | 14 100 | 0,00 | 576 | 6,48 | ||||
| 2025-08-12 | 13F | Jpmorgan Chase & Co | 70 819 | -85,71 | 2 892 | -84,77 | ||||
| 2025-08-12 | 13F | American Century Companies Inc | 1 171 246 | -32,48 | 47 822 | -28,04 | ||||
| 2025-05-01 | 13F | Gateway Wealth Partners, LLC | 0 | -100,00 | 0 | -100,00 | ||||
| 2025-08-12 | 13F | Argent Trust Co | 62 182 | -14,62 | 2 539 | -9,03 | ||||
| 2025-08-13 | 13F | F/M Investments LLC | 13 465 | 0,00 | 550 | 6,60 | ||||
| 2025-08-14 | 13F | Susquehanna International Group, Llp | 70 492 | -78,42 | 2 878 | -77,00 | ||||
| 2025-08-14 | 13F | Susquehanna International Group, Llp | Put | 38 100 | -79,63 | 1 556 | -78,29 | |||
| 2025-08-14 | 13F | DRW Securities, LLC | 17 467 | 713 | ||||||
| 2025-07-01 | 13F | Cacti Asset Management Llc | 44 850 | 0,00 | 1 815 | 5,47 | ||||
| 2025-07-09 | 13F | New England Research & Management, Inc. | 9 900 | -14,66 | 0 | |||||
| 2025-08-14 | 13F | Susquehanna International Group, Llp | Call | 207 300 | -12,83 | 8 464 | -7,09 | |||
| 2025-08-07 | 13F | BOK Financial Private Wealth, Inc. | 300 | 0,00 | 12 | 9,09 | ||||
| 2025-08-07 | 13F | Roberts Glore & Co Inc /il/ | 5 485 | 0,00 | 224 | 6,19 | ||||
| 2025-08-12 | 13F | Jaffetilchin Investment Partners, LLC | 15 571 | 0,74 | 636 | 7,26 | ||||
| 2025-08-13 | 13F | Jump Financial, LLC | 0 | -100,00 | 0 | |||||
| 2025-05-14 | 13F | Natixis | 0 | -100,00 | 0 | |||||
| 2025-05-19 | 13F/A | Jane Street Group, Llc | Put | 0 | -100,00 | 0 | -100,00 | |||
| 2025-07-17 | 13F | Tritonpoint Wealth, Llc | 17 466 | 0,00 | 713 | 6,58 | ||||
| 2025-08-13 | 13F | Formula Growth Ltd | 43 090 | 1 759 | ||||||
| 2025-07-25 | 13F | Cwm, Llc | 71 | 115,15 | 0 | |||||
| 2025-07-11 | 13F | Farther Finance Advisors, LLC | 11 512 | 66,53 | 470 | 77,36 | ||||
| 2025-07-10 | 13F | Capital Advisory Group Advisory Services, LLC | 0 | -100,00 | 0 | |||||
| 2025-07-24 | 13F | Thompson Investment Management, Inc. | 600 | 24 | ||||||
| 2025-08-11 | 13F | Independent Advisor Alliance | 9 136 | 9,28 | 373 | 16,56 | ||||
| 2025-08-14 | 13F | Boston Private Wealth Llc | 0 | -100,00 | 0 | |||||
| 2025-07-18 | 13F | Truist Financial Corp | 16 760 | 0,28 | 684 | 6,88 | ||||
| 2025-07-17 | 13F | Vermillion Wealth Management, Inc. | 300 | 0,00 | 12 | 9,09 | ||||
| 2025-07-11 | 13F | Mallini Complete Financial Planning LLC | 381 | 7,34 | ||||||
| 2025-08-14 | 13F | Bramshill Investments, LLC | 21 187 | -0,27 | 865 | 6,40 | ||||
| 2025-05-06 | 13F | Kovack Advisors, Inc. | 0 | -100,00 | 0 | |||||
| 2025-07-10 | 13F | Moody National Bank Trust Division | 8 406 | 0,91 | 343 | 7,52 | ||||
| 2025-07-14 | 13F | GAMMA Investing LLC | 33 | 1 | ||||||
| 2025-08-13 | 13F | Aristides Capital LLC | 40 920 | 0,00 | 1 671 | 6,57 | ||||
| 2025-08-14 | 13F | Sandia Investment Management LP | 0 | -100,00 | 0 | |||||
| 2025-04-21 | 13F | Beacon Capital Management, LLC | 0 | -100,00 | 0 | -100,00 | ||||
| 2025-05-02 | 13F | Retirement Planning Co of New England, Inc. | 0 | -100,00 | 0 | |||||
| 2025-04-21 | 13F | Luken Investment Analytics, LLC | 0 | -100,00 | 0 | -100,00 | ||||
| 2025-08-01 | 13F | Twin Lakes Capital Management, LLC | 2 529 | 2,02 | 103 | 9,57 | ||||
| 2025-08-12 | 13F | Bahl & Gaynor Inc | 0 | -100,00 | 0 | |||||
| 2025-07-28 | NP | SCAP - InfraCap Small Cap Income ETF | 3 770 | -53,31 | 151 | -50,66 | ||||
| 2025-07-21 | 13F | Vaughan Nelson Investment Management, L.p. | 2 600 | 0,00 | 106 | |||||
| 2025-05-16 | 13F | McIlrath & Eck, LLC | 0 | -100,00 | 0 | |||||
| 2025-08-14 | 13F | Mml Investors Services, Llc | 12 020 | 12,49 | 0 | |||||
| 2025-08-13 | 13F | Hudson Portfolio Management LLC | 9 450 | 0,00 | 386 | 6,35 | ||||
| 2025-07-18 | 13F | PFG Investments, LLC | 9 923 | 66,55 | 405 | 77,63 | ||||
| 2025-07-11 | 13F | Kingstone Capital Partners Texas, LLC | 5 168 578 | 194 | ||||||
| 2025-08-14 | 13F | Horizon Investments, LLC | 219 | 9 | ||||||
| 2025-08-12 | 13F | SRS Capital Advisors, Inc. | 6 405 | 55,39 | 262 | 66,24 | ||||
| 2025-08-14 | 13F | Goldman Sachs Group Inc | 66 310 | -92,77 | 2 707 | -92,29 | ||||
| 2025-07-31 | 13F | FSM Wealth Advisors, LLC | 7 720 | 320 | ||||||
| 2025-08-15 | 13F | Northeast Financial Consultants Inc | 46 409 | 0,00 | 1 895 | 6,58 | ||||
| 2025-06-26 | NP | FDMLX - Fidelity Series Intrinsic Opportunities Fund This fund is a listed as child fund of Fmr Llc and if that institution has disclosed ownership in this security, then these positions will not be double counted when calculating total shares and total value | 434 800 | 8,16 | 17 131 | 6,38 | ||||
| 2025-08-13 | 13F | Nicolet Advisory Services, Llc | 8 598 | 0,00 | 349 | 13,68 | ||||
| 2025-07-24 | 13F | Us Bancorp \de\ | 10 380 | -29,00 | 424 | -24,46 | ||||
| 2025-07-28 | NP | KBWD - Invesco KBW High Dividend Yield Financial ETF This fund is a listed as child fund of Invesco Ltd. and if that institution has disclosed ownership in this security, then these positions will not be double counted when calculating total shares and total value | 319 804 | 40,61 | 12 776 | 49,17 | ||||
| 2025-08-14 | 13F | Mariner, LLC | 39 120 | 2,25 | 1 597 | 9,01 | ||||
| 2025-07-25 | 13F | Sequoia Financial Advisors, LLC | 20 308 | 0,79 | 829 | 7,52 | ||||
| 2025-07-01 | 13F | Harbor Investment Advisory, Llc | 1 200 | -4,00 | 49 | 2,13 | ||||
| 2025-08-14 | 13F | Css Llc/il | Put | 0 | -100,00 | 0 | ||||
| 2025-08-19 | 13F | Cape Investment Advisory, Inc. | 567 | -23,38 | 23 | -17,86 | ||||
| 2025-08-13 | 13F | Gamco Investors, Inc. Et Al | 33 198 | -53,89 | 1 355 | -50,87 | ||||
| 2025-08-14 | 13F | Group One Trading, L.p. | Put | 11 400 | 58,33 | 465 | 69,09 | |||
| 2025-08-14 | 13F | Group One Trading, L.p. | Call | 1 500 | -96,16 | 61 | -95,93 | |||
| 2025-05-14 | 13F | Van Hulzen Asset Management, LLC | 0 | -100,00 | 0 | -100,00 | ||||
| 2025-08-14 | 13F | Group One Trading, L.p. | 8 391 | 343 | ||||||
| 2025-05-22 | NP | MANNING & NAPIER FUND, INC. - Callodine Equity Income Series Class I | 174 060 | -3,30 | 6 668 | -0,12 | ||||
| 2025-08-11 | 13F | One Capital Management, LLC | 8 029 | 0,00 | 328 | 6,51 | ||||
| 2025-07-22 | 13F | Kessler Investment Group, LLC | 70 | 0,00 | 3 | 0,00 | ||||
| 2025-08-06 | 13F | Wedbush Securities Inc | 8 680 | -10,79 | 0 | |||||
| 2025-08-11 | 13F | Knott David M Jr | 48 000 | 0,00 | 1 960 | 6,58 | ||||
| 2025-08-05 | 13F | Huntington National Bank | 1 | 0,00 | 0 | |||||
| 2025-08-14 | 13F | Wealth Preservation Advisors, LLC | 15 061 | 0,00 | 615 | 6,60 | ||||
| 2025-08-13 | 13F | Invesco Ltd. | 174 553 | -46,29 | 7 127 | -42,77 | ||||
| 2025-08-04 | 13F | Canton Hathaway, LLC | 27 000 | 25,73 | 1 | |||||
| 2025-08-14 | 13F | Css Llc/il | 0 | -100,00 | 0 | |||||
| 2025-08-05 | 13F | HFG Advisors, Inc. | 6 560 | -4,89 | 268 | 1,14 | ||||
| 2025-08-08 | 13F | Schwarz Dygos Wheeler Investment Advisors Llc | 6 095 | 0,00 | 249 | 6,44 | ||||
| 2025-07-10 | 13F | Wealth Enhancement Advisory Services, Llc | 183 021 | 0,16 | 7 522 | 7,46 | ||||
| 2025-04-29 | 13F | Envestnet Asset Management Inc | 0 | -100,00 | 0 | |||||
| 2025-08-14 | 13F | Peak6 Llc | Put | 0 | -100,00 | 0 | ||||
| 2025-08-12 | 13F | Integrated Advisors Network LLC | 10 449 | -2,25 | 427 | 4,16 | ||||
| 2025-08-29 | NP | GATAX - The Gabelli Asset Fund Class A | 40 000 | 0,00 | 1 633 | 6,59 | ||||
| 2025-07-15 | 13F | Shulman DeMeo Asset Management LLC | 14 115 | 0,35 | 576 | 7,06 | ||||
| 2025-07-28 | 13F | Mutual Advisors, LLC | 14 405 | 0,88 | 618 | 14,90 | ||||
| 2025-07-31 | 13F | Cambridge Investment Research Advisors, Inc. | 59 829 | 0,72 | 2 | 0,00 | ||||
| 2025-08-14 | 13F | Fmr Llc | 2 445 741 | -26,23 | 99 860 | -21,37 | ||||
| 2025-08-28 | NP | TWEIX - Equity Income Fund Investor Class This fund is a listed as child fund of American Century Companies Inc and if that institution has disclosed ownership in this security, then these positions will not be double counted when calculating total shares and total value | 982 139 | -33,00 | 40 101 | -28,59 | ||||
| 2025-07-14 | 13F | Opal Wealth Advisors, LLC | 7 111 | 0,00 | 290 | 6,62 | ||||
| 2025-08-14 | 13F | Wiley Bros.-aintree Capital, Llc | 38 236 | 3,54 | 1 561 | 10,24 | ||||
| 2025-08-20 | NP | AAIIX - Ancora Income Fund Class I | 4 200 | 0,00 | 171 | 6,88 | ||||
| 2025-07-22 | 13F | IMC-Chicago, LLC | Put | 11 300 | 461 | |||||
| 2025-08-22 | NP | VARIABLE INSURANCE PRODUCTS FUND IV - Financial Services Portfolio Initial Class | 62 800 | -48,18 | 2 564 | -44,78 | ||||
| 2025-04-28 | 13F | Redmont Wealth Advisors Llc | 11 373 | 0,00 | 436 | 3,33 | ||||
| 2025-07-10 | 13F | Kozak & Associates, Inc. | 1 125 | 1,63 | 46 | 12,20 | ||||
| 2025-08-05 | 13F | Mountain Hill Investment Partners Corp. | 0 | -100,00 | 0 | |||||
| 2025-07-24 | NP | FIDSX - Financial Services Portfolio This fund is a listed as child fund of Fmr Llc and if that institution has disclosed ownership in this security, then these positions will not be double counted when calculating total shares and total value | 215 000 | -56,09 | 8 589 | -53,42 | ||||
| 2025-08-18 | 13F | Wolverine Trading, Llc | 0 | -100,00 | 0 | |||||
| 2025-07-30 | 13F | Whittier Trust Co Of Nevada Inc | 159 | 0,00 | 6 | 0,00 | ||||
| 2025-08-12 | 13F | Manchester Capital Management LLC | 407 | 0,00 | 15 | 0,00 | ||||
| 2025-08-18 | 13F | Wolverine Trading, Llc | Call | 0 | -100,00 | 0 | ||||
| 2025-08-18 | 13F | Wolverine Trading, Llc | Put | 0 | -100,00 | 0 | ||||
| 2025-08-12 | 13F | MAI Capital Management | 12 619 | -4,61 | 515 | 1,78 | ||||
| 2025-08-19 | 13F | National Asset Management, Inc. | 76 786 | 14,98 | 3 135 | 26,58 | ||||
| 2025-07-17 | 13F | Janney Montgomery Scott LLC | 103 869 | -3,58 | 4 | 0,00 | ||||
| 2025-05-08 | 13F | HHM Wealth Advisors, LLC | 0 | -100,00 | 0 | -100,00 | ||||
| 2025-07-15 | 13F | Fifth Third Bancorp | 1 000 | 0,00 | 41 | 5,26 | ||||
| 2025-08-06 | 13F | Commonwealth Equity Services, Llc | 72 357 | 16,73 | 3 | 0,00 | ||||
| 2025-08-14 | 13F | Bnp Paribas Arbitrage, Sa | 58 353 | -31,26 | 2 383 | -26,75 | ||||
| 2025-04-25 | 13F | K.J. Harrison & Partners Inc | 0 | -100,00 | 0 | -100,00 | ||||
| 2025-08-05 | 13F | GHP Investment Advisors, Inc. | 1 154 | 2,03 | 47 | 9,30 | ||||
| 2025-08-14 | 13F | TCG Advisory Services, LLC | 208 278 | -2,01 | 8 504 | 4,45 | ||||
| 2025-04-21 | 13F | Nelson, Van Denburg & Campbell Wealth Management Group, LLC | 0 | -100,00 | 0 | |||||
| 2025-08-01 | 13F | First National Trust Co | 26 824 | 0,00 | 1 095 | 6,62 | ||||
| 2025-08-13 | 13F | Manning & Napier Advisors Llc | 0 | -100,00 | 0 | |||||
| 2025-08-14 | 13F | Ameriprise Financial Inc | 37 889 | -0,33 | 1 547 | 6,25 | ||||
| 2025-08-14 | 13F | First Foundation Advisors | 24 500 | 0,00 | 1 000 | 6,61 | ||||
| 2025-08-20 | NP | LSPAX - LoCorr Spectrum Income Fund Class A | 19 399 | 0,00 | 792 | 6,59 | ||||
| 2025-08-13 | 13F | Keystone Financial Group | 19 169 | 4,87 | 774 | 6,62 | ||||
| 2025-07-25 | 13F | Atria Wealth Solutions, Inc. | 0 | -100,00 | 0 | |||||
| 2025-08-12 | 13F | Global Retirement Partners, LLC | 17 679 | 722 | ||||||
| 2025-04-22 | 13F | Mendota Financial Group, LLC | 0 | -100,00 | 0 | |||||
| 2025-07-29 | 13F | Chicago Partners Investment Group LLC | 6 833 | 0,00 | 285 | 1,79 | ||||
| 2025-08-06 | 13F | Golden State Wealth Management, LLC | 2 575 | 0,00 | 105 | 7,14 | ||||
| 2025-08-13 | 13F | Fiduciary Group LLC | 6 565 | -5,74 | 268 | 0,75 | ||||
| 2025-07-25 | 13F | Apollon Wealth Management, LLC | 25 635 | 24,88 | 1 047 | 33,08 | ||||
| 2025-08-07 | 13F | Zions Bancorporation, National Association /ut/ | 2 000 | 0,00 | 82 | 6,58 | ||||
| 2025-09-04 | 13F/A | Advisor Group Holdings, Inc. | 159 673 | -3,86 | 6 520 | 2,47 | ||||
| 2025-08-14 | 13F | CoreCap Advisors, LLC | 388 | 0,00 | 16 | 7,14 | ||||
| 2025-07-23 | 13F | Birinyi Associates Inc | 10 261 | -8,64 | 0 | |||||
| 2025-08-07 | 13F | Future Fund LLC | 13 044 | 10,22 | 533 | 17,44 | ||||
| 2025-08-04 | 13F | Flagship Harbor Advisors, Llc | 9 185 | -1,24 | 375 | 5,34 | ||||
| 2025-07-14 | 13F | CHICAGO TRUST Co NA | 6 000 | 245 | ||||||
| 2025-08-12 | 13F | Skopos Labs, Inc. | 13 | 0,00 | 0 | |||||
| 2025-04-29 | NP | ICAP - InfraCap Equity Income Fund ETF | 40 806 | 8,12 | 1 537 | 12,28 | ||||
| 2025-07-28 | 13F | Harbour Investments, Inc. | 90 | 0,00 | 4 | 0,00 | ||||
| 2025-08-14 | 13F | Raymond James Financial Inc | 173 692 | -2,91 | 7 092 | 3,47 | ||||
| 2025-08-14 | 13F/A | Zazove Associates Llc | Call | 67 400 | 0,00 | 88 | -81,99 | |||
| 2025-08-12 | 13F | Clear Street Markets Llc | Put | 0 | -100,00 | 0 | ||||
| 2025-08-12 | 13F | Laurel Wealth Advisors LLC | 205 | 4 000,00 | 0 | |||||
| 2025-08-12 | 13F | Clear Street Markets Llc | 0 | -100,00 | 0 | |||||
| 2025-07-22 | 13F | DAVENPORT & Co LLC | 37 022 | 0,82 | 1 512 | 7,47 | ||||
| 2025-03-31 | NP | FIDAX - Financial Industries Fund Class A | 183 168 | 3,89 | 7 338 | 12,32 | ||||
| 2025-08-14 | 13F | Colony Group, LLC | 26 829 | -1,99 | 1 095 | 4,48 | ||||
| 2025-08-11 | 13F | Aptus Capital Advisors, LLC | 9 525 | 13,65 | 389 | 20,87 | ||||
| 2025-07-29 | NP | FFND - The Future Fund Active ETF | 12 672 | 18,20 | 506 | 25,56 | ||||
| 2025-08-14 | 13F | Jane Street Group, Llc | Call | 37 800 | -16,56 | 1 543 | -11,07 | |||
| 2025-07-15 | 13F | North Star Investment Management Corp. | 2 341 | 0,00 | 96 | 6,74 | ||||
| 2025-08-14 | 13F | Jane Street Group, Llc | 78 323 | -46,51 | 3 198 | -43,01 | ||||
| 2025-08-14 | 13F | UBS Group AG | 292 235 | -77,33 | 11 932 | -75,84 | ||||
| 2025-07-28 | 13F | Davidson Trust Co | 7 000 | 0,00 | 286 | 6,34 | ||||
| 2025-07-23 | 13F | Joel Isaacson & Co., LLC | 10 177 | 0,00 | 416 | 6,68 | ||||
| 2025-07-31 | 13F/A | Avion Wealth | 584 | 5,04 | 0 | |||||
| 2025-07-29 | 13F | Koshinski Asset Management, Inc. | 6 165 | 12,81 | 252 | 20,10 | ||||
| 2025-06-24 | NP | NLSAX - Neuberger Berman Long Short Fund Class A | 0 | -100,00 | 0 | -100,00 | ||||
| 2025-04-16 | 13F | Fortitude Family Office, LLC | 0 | -100,00 | 0 | |||||
| 2025-08-07 | 13F | Summit Asset Management, LLC | 5 450 | 0,00 | 223 | 6,73 | ||||
| 2025-07-15 | 13F | SJS Investment Consulting Inc. | 420 | 0,00 | 17 | 6,25 |