Statistiques de base
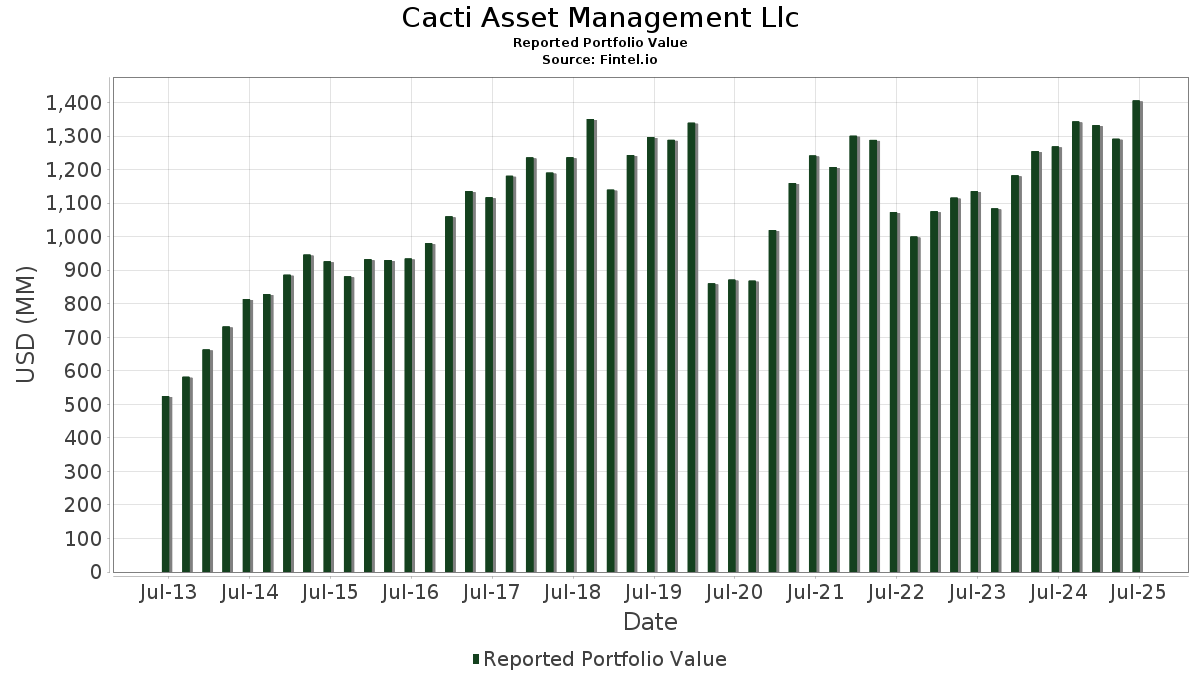
| Valeur du portefeuille | $ 1 405 639 574 |
| Positions actuelles | 76 |
Dernières positions, performances, ASG (à partir des dépôts 13F, 13D)
Cacti Asset Management Llc a déclaré un total de 76 positions dans ses derniers dépôts auprès de la SEC. La valeur la plus récente du portefeuille est calculée à 1 405 639 574 USD. Les actifs sous gestion réels (ASG) sont cette valeur plus les liquidités (qui ne sont pas divulguées). Les principales positions de Cacti Asset Management Llc sont American Express Company (US:AXP) , The Goldman Sachs Group, Inc. (US:GS) , Blackstone Inc. (US:BX) , Apple Inc. (US:AAPL) , and Seagate Technology Holdings plc (US:STX) .
Meilleures augmentations ce trimestre
Nous utilisons la variation de l'allocation du portefeuille car il s'agit de l'indicateur le plus significatif. Les changements peuvent être dus à des transactions ou à des variations de prix des actions.
| Titre | Actions (en millions) |
Valeur ($ en millions) |
% du portefeuille | ΔPortefeuille % |
|---|---|---|---|---|
| 0,56 | 78,93 | 5,6151 | 1,9460 | |
| 0,18 | 126,72 | 9,0148 | 1,2529 | |
| 0,41 | 130,94 | 9,3156 | 0,8176 | |
| 0,54 | 66,65 | 4,7418 | 0,6049 | |
| 0,21 | 46,01 | 3,2732 | 0,3956 | |
| 0,20 | 18,29 | 1,3014 | 0,2595 | |
| 0,85 | 19,91 | 1,4163 | 0,2488 | |
| 0,31 | 22,10 | 1,5726 | 0,1108 | |
| 0,78 | 40,24 | 2,8628 | 0,1055 | |
| 0,01 | 3,13 | 0,2226 | 0,0814 |
Principales baisses ce trimestre
Nous utilisons la variation de l'allocation du portefeuille car il s'agit de l'indicateur le plus significatif. Les changements peuvent être dus à des transactions ou à des variations de prix des actions.
| Titre | Actions (en millions) |
Valeur ($ en millions) |
% du portefeuille | ΔPortefeuille % |
|---|---|---|---|---|
| 0,54 | 108,44 | 7,7146 | -1,3852 | |
| 0,18 | 30,80 | 2,1913 | -0,9577 | |
| 0,64 | 50,96 | 3,6257 | -0,8463 | |
| 0,26 | 73,41 | 5,2224 | -0,6870 | |
| 0,37 | 37,23 | 2,6487 | -0,4756 | |
| 0,26 | 39,30 | 2,7960 | -0,4726 | |
| 0,60 | 18,35 | 1,3056 | -0,2608 | |
| 0,14 | 42,62 | 3,0321 | -0,2393 | |
| 0,85 | 44,65 | 3,1768 | -0,1598 | |
| 0,41 | 27,76 | 1,9751 | -0,1581 |
Déclarations 13F et dépôts de fonds
Ce formulaire a été déposé le 2025-07-01 pour la période de déclaration 2025-06-30. Cliquez sur l'icône du lien pour voir l'historique complet des transactions.
Mettre à niveau pour débloquer les données premium et exporter vers Excel ![]() .
.
| Titre | Type | Prix moyen de l'action | Actions (en millions) |
ΔActions (%) |
ΔActions (%) |
Valeur ($ en millions) |
Portefeuille (%) |
ΔPortefeuille (%) |
|
|---|---|---|---|---|---|---|---|---|---|
| AXP / American Express Company | 0,41 | -0,15 | 130,94 | 19,30 | 9,3156 | 0,8176 | |||
| GS / The Goldman Sachs Group, Inc. | 0,18 | -0,62 | 126,72 | 26,40 | 9,0148 | 1,2529 | |||
| BX / Blackstone Inc. | 0,73 | -0,16 | 109,96 | 9,24 | 7,8227 | 0,0291 | |||
| AAPL / Apple Inc. | 0,54 | -0,02 | 108,44 | -7,73 | 7,7146 | -1,3852 | |||
| STX / Seagate Technology Holdings plc | 0,56 | 0,00 | 78,93 | 66,56 | 5,6151 | 1,9460 | |||
| J / Jacobs Solutions Inc. | 0,59 | 0,00 | 76,39 | 7,28 | 5,4349 | -0,0789 | |||
| CB / Chubb Limited | 0,26 | 0,00 | 73,41 | -3,82 | 5,2224 | -0,6870 | |||
| DIS / The Walt Disney Company | 0,54 | 0,00 | 66,65 | 24,75 | 4,7418 | 0,6049 | |||
| MRK / Merck & Co., Inc. | 0,64 | -0,46 | 50,96 | -11,76 | 3,6257 | -0,8463 | |||
| BA / The Boeing Company | 0,21 | 0,00 | 46,01 | 23,79 | 3,2732 | 0,3956 | |||
| FOX / Fox Corporation | 0,85 | 0,00 | 44,65 | 3,62 | 3,1768 | -0,1598 | |||
| RTX / RTX Corporation | 0,31 | 0,00 | 44,15 | 9,83 | 3,1409 | 0,0283 | |||
| AVT / Avnet, Inc. | 0,14 | 0,00 | 42,62 | 0,87 | 3,0321 | -0,2393 | |||
| GLW / Corning Incorporated | 0,78 | 0,00 | 40,24 | 13,00 | 2,8628 | 0,1055 | |||
| JNJ / Johnson & Johnson | 0,26 | 0,00 | 39,30 | -6,90 | 2,7960 | -0,4726 | |||
| UPS / United Parcel Service, Inc. | 0,37 | 0,00 | 37,23 | -7,73 | 2,6487 | -0,4756 | |||
| BDX / Becton, Dickinson and Company | 0,18 | 0,84 | 30,80 | -24,27 | 2,1913 | -0,9577 | |||
| CVS / CVS Health Corporation | 0,41 | -1,22 | 27,76 | 0,77 | 1,9751 | -0,1581 | |||
| NKE / NIKE, Inc. | 0,31 | 2,86 | 22,10 | 17,08 | 1,5726 | 0,1108 | |||
| BK / The Bank of New York Mellon Corporation | 0,23 | 0,00 | 21,30 | 10,24 | 1,5151 | 0,0193 | |||
| AMTM / Amentum Holdings, Inc. | 0,85 | 1,74 | 19,91 | 32,03 | 1,4163 | 0,2488 | |||
| BAX / Baxter International Inc. | 0,60 | 0,74 | 18,35 | -9,29 | 1,3056 | -0,2608 | |||
| UBER / Uber Technologies, Inc. | 0,20 | 8,04 | 18,29 | 35,94 | 1,3014 | 0,2595 | |||
| EBAY / eBay Inc. | 0,24 | 0,00 | 17,93 | 9,82 | 1,2758 | 0,0115 | |||
| VOW / Volkswagen AG | 0,15 | -1,51 | 16,05 | 0,61 | 1,1418 | -0,0932 | |||
| SPY / SPDR S&P 500 ETF | 0,03 | 2,02 | 15,55 | 12,90 | 1,1066 | 0,0398 | |||
| GPC / Genuine Parts Company | 0,08 | 0,00 | 10,03 | 1,70 | 0,7134 | -0,0501 | |||
| MSFT / Microsoft Corporation | 0,01 | 0,00 | 5,52 | 30,91 | 0,3927 | 0,0663 | |||
| IVZ / Invesco Ltd. | 0,33 | 0,00 | 5,23 | 3,36 | 0,3720 | -0,0197 | |||
| KKR / KKR & Co. Inc. | 0,04 | 0,00 | 4,92 | 16,92 | 0,3500 | 0,0242 | |||
| IBM / International Business Machines Corporation | 0,01 | -1,37 | 4,17 | 17,10 | 0,2968 | 0,0210 | |||
| INTC / Intel Corporation | 0,15 | 1,70 | 3,33 | 1,62 | 0,2367 | -0,0168 | |||
| GEV / GE Vernova Inc. | 0,01 | 0,00 | 3,13 | 71,59 | 0,2226 | 0,0814 | |||
| JPM / JPMorgan Chase & Co. | 0,01 | -4,58 | 2,99 | 12,80 | 0,2126 | 0,0075 | |||
| USB / U.S. Bancorp | 0,06 | 0,00 | 2,96 | 8,27 | 0,2106 | -0,0011 | |||
| SLV / iShares Silver Trust | 0,09 | 0,00 | 2,89 | 5,24 | 0,2056 | -0,0070 | |||
| MS / Morgan Stanley | 0,02 | -6,98 | 2,81 | 13,47 | 0,2002 | 0,0082 | |||
| KO / The Coca-Cola Company | 0,04 | 0,00 | 2,57 | -0,04 | 0,1831 | -0,0163 | |||
| HSY / The Hershey Company | 0,01 | 0,00 | 2,47 | 27,32 | 0,1754 | 0,0255 | |||
| PG / The Procter & Gamble Company | 0,02 | 0,00 | 2,41 | -4,87 | 0,1711 | -0,0246 | |||
| BRO / Brown & Brown, Inc. | 0,02 | 0,00 | 2,30 | -10,85 | 0,1637 | -0,0362 | |||
| AB / AllianceBernstein Holding L.P. - Limited Partnership | 0,04 | 0,00 | 1,81 | 5,47 | 0,1291 | -0,0041 | |||
| KD / Kyndryl Holdings, Inc. | 0,04 | 0,00 | 1,77 | 32,34 | 0,1261 | 0,0224 | |||
| XOM / Exxon Mobil Corporation | 0,02 | -11,07 | 1,76 | -17,36 | 0,1250 | -0,0397 | |||
| PFE / Pfizer Inc. | 0,07 | 0,00 | 1,69 | -4,03 | 0,1202 | -0,0161 | |||
| BMY / Bristol-Myers Squibb Company | 0,04 | 0,00 | 1,69 | -22,77 | 0,1202 | -0,0492 | |||
| VWDRY / Vestas Wind Systems A/S - Depositary Receipt (Common Stock) | 0,30 | 0,00 | 1,58 | 11,77 | 0,1121 | 0,0029 | |||
| PGC / Peapack-Gladstone Financial Corporation | 0,06 | 0,00 | 1,55 | -0,77 | 0,1105 | -0,0107 | |||
| META / Meta Platforms, Inc. | 0,00 | 0,00 | 1,32 | 27,17 | 0,0939 | 0,0136 | |||
| FAST / Fastenal Company | 0,03 | 100,00 | 1,24 | 10,21 | 0,0883 | 0,0011 | |||
| EL / The Estée Lauder Companies Inc. | 0,01 | 42,86 | 0,80 | 75,05 | 0,0570 | 0,0215 | |||
| IFF / International Flavors & Fragrances Inc. | 0,01 | 0,00 | 0,74 | -2,75 | 0,0529 | -0,0063 | |||
| HPQ / HP Inc. | 0,03 | 0,00 | 0,74 | -11,23 | 0,0529 | -0,0119 | |||
| SEE / Sealed Air Corporation | 0,02 | 0,00 | 0,70 | 7,74 | 0,0496 | -0,0005 | |||
| NVO / Novo Nordisk A/S - Depositary Receipt (Common Stock) | 0,01 | 0,00 | 0,69 | -1,15 | 0,0487 | -0,0049 | |||
| LLY / Eli Lilly and Company | 0,00 | 0,00 | 0,62 | -5,78 | 0,0441 | -0,0068 | |||
| HAL / Halliburton Company | 0,03 | -25,00 | 0,62 | -38,42 | 0,0439 | -0,0337 | |||
| HPE / Hewlett Packard Enterprise Company | 0,03 | 0,00 | 0,55 | 16,70 | 0,0393 | 0,0026 | |||
| LIND / Lindblad Expeditions Holdings, Inc. | 0,04 | 0,00 | 0,48 | 21,52 | 0,0342 | 0,0036 | |||
| CSCO / Cisco Systems, Inc. | 0,01 | 0,00 | 0,41 | 12,60 | 0,0293 | 0,0010 | |||
| HD / The Home Depot, Inc. | 0,00 | 0,00 | 0,41 | 3,05 | 0,0289 | -0,0016 | |||
| IDXX / IDEXX Laboratories, Inc. | 0,00 | 0,00 | 0,27 | 28,02 | 0,0189 | 0,0028 | |||
| OGN / Organon & Co. | 0,03 | 0,25 | 0,0175 | 0,0175 | |||||
| GEHC / GE HealthCare Technologies Inc. | 0,00 | 0,00 | 0,22 | -7,30 | 0,0154 | -0,0026 | |||
| WAT / Waters Corporation | 0,00 | 0,00 | 0,18 | -2,76 | 0,0125 | -0,0015 | |||
| FMS / Fresenius Medical Care AG - Depositary Receipt (Common Stock) | 0,01 | 0,00 | 0,17 | 14,19 | 0,0120 | 0,0005 | |||
| TEVA / Teva Pharmaceutical Industries Limited - Depositary Receipt (Common Stock) | 0,01 | 0,00 | 0,17 | 11,33 | 0,0119 | 0,0002 | |||
| MA / Mastercard Incorporated | 0,00 | 0,00 | 0,17 | 1,85 | 0,0117 | -0,0008 | |||
| MOV / Movado Group, Inc. | 0,01 | 0,00 | 0,15 | -10,47 | 0,0110 | -0,0023 | |||
| CARR / Carrier Global Corporation | 0,00 | -31,03 | 0,15 | -19,67 | 0,0105 | -0,0037 | |||
| TJX / The TJX Companies, Inc. | 0,00 | 0,00 | 0,12 | 4,24 | 0,0088 | -0,0004 | |||
| F / Ford Motor Company | 0,01 | -50,00 | 0,11 | -44,33 | 0,0077 | -0,0074 | |||
| TECH PRECISION CORP / (878739101) | 0,02 | 0,08 | 0,0000 | ||||||
| GLPG / Galapagos NV - Depositary Receipt (Common Stock) | 0,00 | 0,00 | 0,03 | 8,00 | 0,0020 | 0,0000 | |||
| LAC / Lithium Americas Corp. | 0,01 | 0,00 | 0,03 | 0,00 | 0,0020 | -0,0001 | |||
| HISCOX LTD SHSISIN#BMG4593F1041 / (G4593F104) | 0,00 | 0,00 | 0,0000 | ||||||
| PGEN / Precigen, Inc. | 0,00 | -100,00 | 0,00 | 0,0000 | |||||
| OTIS / Otis Worldwide Corporation | 0,00 | -100,00 | 0,00 | 0,0000 |