Statistiques de base
| Valeur du portefeuille | $ 154 151 980 |
| Positions actuelles | 103 |
Dernières positions, performances, ASG (à partir des dépôts 13F, 13D)
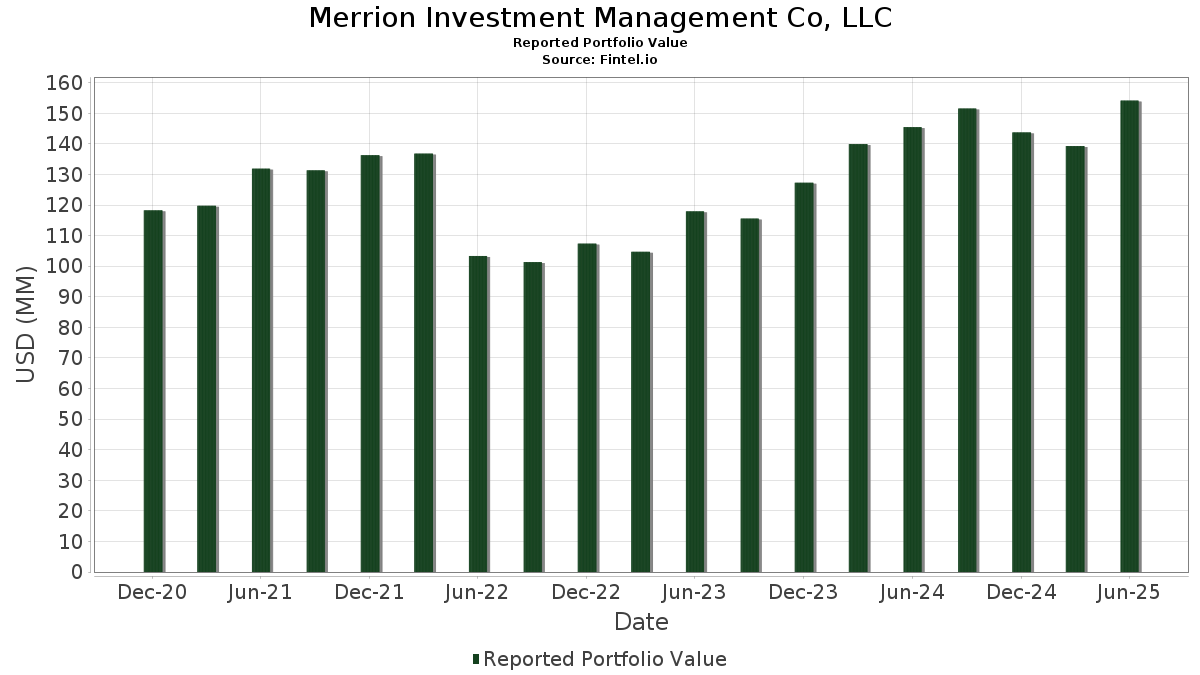
Merrion Investment Management Co, LLC a déclaré un total de 103 positions dans ses derniers dépôts auprès de la SEC. La valeur la plus récente du portefeuille est calculée à 154 151 980 USD. Les actifs sous gestion réels (ASG) sont cette valeur plus les liquidités (qui ne sont pas divulguées). Les principales positions de Merrion Investment Management Co, LLC sont Cameco Corporation (US:CCJ) , Jefferies Financial Group Inc. (US:JEF) , Direxion Shares ETF Trust - Direxion Daily NVDA Bear 1X Shares (US:NVDD) , Alphabet Inc. (US:GOOG) , and Apple Inc. (US:AAPL) . Les nouvelles positions de Merrion Investment Management Co, LLC incluent Baker Hughes Company (US:BKR) , Orla Mining Ltd. (US:ORLA) , Palantir Technologies Inc. (US:PLTR) , Blue Owl Capital Inc. (US:OWL) , and .
Meilleures augmentations ce trimestre
Nous utilisons la variation de l'allocation du portefeuille car il s'agit de l'indicateur le plus significatif. Les changements peuvent être dus à des transactions ou à des variations de prix des actions.
| Titre | Actions (en millions) |
Valeur ($ en millions) |
% du portefeuille | ΔPortefeuille % |
|---|---|---|---|---|
| 0,20 | 14,88 | 9,6548 | 3,4196 | |
| 0,07 | 10,40 | 6,7469 | 1,4168 | |
| 0,03 | 3,85 | 2,4990 | 0,9440 | |
| 0,01 | 2,96 | 1,9171 | 0,6656 | |
| 0,01 | 2,43 | 1,5756 | 0,5397 | |
| 0,02 | 0,73 | 0,4726 | 0,4726 | |
| 0,01 | 3,88 | 2,5201 | 0,3673 | |
| 0,01 | 3,41 | 2,2139 | 0,3055 | |
| 0,04 | 0,35 | 0,2301 | 0,2301 | |
| 0,00 | 1,42 | 0,9208 | 0,2111 |
Principales baisses ce trimestre
Nous utilisons la variation de l'allocation du portefeuille car il s'agit de l'indicateur le plus significatif. Les changements peuvent être dus à des transactions ou à des variations de prix des actions.
| Titre | Actions (en millions) |
Valeur ($ en millions) |
% du portefeuille | ΔPortefeuille % |
|---|---|---|---|---|
| 0,04 | 7,75 | 5,0306 | -2,5750 | |
| 0,01 | 4,92 | 3,1944 | -1,1948 | |
| 0,21 | 11,34 | 7,3551 | -0,7837 | |
| 0,12 | 2,45 | 1,5878 | -0,6653 | |
| 0,09 | 1,93 | 1,2549 | -0,4726 | |
| 0,01 | 1,48 | 0,9576 | -0,4312 | |
| 0,01 | 1,36 | 0,8795 | -0,3651 | |
| 0,15 | 0,53 | 0,3406 | -0,3298 | |
| 0,03 | 2,43 | 1,5769 | -0,3207 | |
| 0,00 | 0,62 | 0,4051 | -0,2388 |
Déclarations 13F et dépôts de fonds
Ce formulaire a été déposé le 2025-08-07 pour la période de déclaration 2025-06-30. Cliquez sur l'icône du lien pour voir l'historique complet des transactions.
Mettre à niveau pour débloquer les données premium et exporter vers Excel ![]() .
.
| Titre | Type | Prix moyen de l'action | Actions (en millions) |
ΔActions (%) |
ΔActions (%) |
Valeur ($ en millions) |
Portefeuille (%) |
ΔPortefeuille (%) |
|
|---|---|---|---|---|---|---|---|---|---|
| CCJ / Cameco Corporation | 0,20 | -4,98 | 14,88 | 71,38 | 9,6548 | 3,4196 | |||
| JEF / Jefferies Financial Group Inc. | 0,21 | -2,03 | 11,34 | 0,02 | 7,3551 | -0,7837 | |||
| NVDD / Direxion Shares ETF Trust - Direxion Daily NVDA Bear 1X Shares | 0,07 | -3,90 | 10,40 | 40,09 | 6,7469 | 1,4168 | |||
| GOOG / Alphabet Inc. | 0,06 | -0,39 | 10,01 | 13,11 | 6,4962 | 0,1396 | |||
| AAPL / Apple Inc. | 0,04 | -20,75 | 7,75 | -26,80 | 5,0306 | -2,5750 | |||
| BRK.B / Berkshire Hathaway Inc. | 0,01 | -11,69 | 4,92 | -19,45 | 3,1944 | -1,1948 | |||
| MGM / MGM Resorts International | 0,11 | -2,56 | 3,93 | 13,05 | 2,5519 | 0,0539 | |||
| GS / The Goldman Sachs Group, Inc. | 0,01 | 0,00 | 3,88 | 29,55 | 2,5201 | 0,3673 | |||
| VRT / Vertiv Holdings Co | 0,03 | 0,00 | 3,85 | 77,84 | 2,4990 | 0,9440 | |||
| MSFT / Microsoft Corporation | 0,01 | -3,11 | 3,41 | 28,37 | 2,2139 | 0,3055 | |||
| NVEC / NVE Corporation | 0,04 | -6,50 | 3,18 | 7,95 | 2,0629 | -0,0516 | |||
| GEV / GE Vernova Inc. | 0,01 | -2,19 | 2,96 | 69,54 | 1,9171 | 0,6656 | |||
| SPY / SPDR S&P 500 ETF | 0,00 | -2,95 | 2,85 | 7,19 | 1,8473 | -0,0599 | |||
| GLW / Corning Incorporated | 0,05 | 0,00 | 2,66 | 14,89 | 1,7228 | 0,0630 | |||
| MPC / Marathon Petroleum Corporation | 0,02 | -4,10 | 2,59 | 9,36 | 1,6831 | -0,0204 | |||
| CNQ / Canadian Natural Resources Limited | 0,08 | -2,48 | 2,47 | -1,90 | 1,6051 | -0,2056 | |||
| NMM / Navios Maritime Partners L.P. - Limited Partnership | 0,07 | 8,33 | 2,45 | 4,08 | 1,5888 | -0,1007 | |||
| HAL / Halliburton Company | 0,12 | -2,91 | 2,45 | -22,02 | 1,5878 | -0,6653 | |||
| AIG / American International Group, Inc. | 0,03 | -6,58 | 2,43 | -8,02 | 1,5769 | -0,3207 | |||
| CEG / Constellation Energy Corporation | 0,01 | 5,16 | 2,43 | 68,38 | 1,5756 | 0,5397 | |||
| TFPM / Triple Flag Precious Metals Corp. | 0,09 | 0,00 | 2,14 | 23,74 | 1,3865 | 0,1461 | |||
| VTS / Vitesse Energy, Inc. | 0,09 | -10,50 | 1,93 | -19,62 | 1,2549 | -0,4726 | |||
| AJG / Arthur J. Gallagher & Co. | 0,01 | 0,00 | 1,60 | -7,30 | 1,0383 | -0,2010 | |||
| JNJ / Johnson & Johnson | 0,01 | -17,15 | 1,48 | -23,68 | 0,9576 | -0,4312 | |||
| NFLX / Netflix, Inc. | 0,00 | 0,00 | 1,42 | 43,62 | 0,9208 | 0,2111 | |||
| MU / Micron Technology, Inc. | 0,01 | 0,00 | 1,39 | 41,88 | 0,9015 | 0,1981 | |||
| COST / Costco Wholesale Corporation | 0,00 | 5,66 | 1,39 | 10,53 | 0,8991 | -0,0006 | |||
| XOM / Exxon Mobil Corporation | 0,01 | -13,72 | 1,36 | -21,81 | 0,8795 | -0,3651 | |||
| AMZN / Amazon.com, Inc. | 0,01 | 0,00 | 1,32 | 15,32 | 0,8546 | 0,0344 | |||
| ABBV / AbbVie Inc. | 0,01 | 0,00 | 1,30 | -11,39 | 0,8429 | -0,2101 | |||
| JPM / JPMorgan Chase & Co. | 0,00 | -7,27 | 1,20 | 9,58 | 0,7793 | -0,0077 | |||
| QQQ / Invesco QQQ Trust, Series 1 | 0,00 | 19,60 | 1,18 | 40,74 | 0,7644 | 0,1631 | |||
| GE / General Electric Company | 0,00 | -1,18 | 1,08 | 27,18 | 0,7013 | 0,0906 | |||
| BWXT / BWX Technologies, Inc. | 0,01 | -1,87 | 1,06 | 43,34 | 0,6850 | 0,1559 | |||
| GSAT / Globalstar, Inc. | 0,04 | 0,00 | 1,03 | 12,84 | 0,6673 | 0,0131 | |||
| LLY / Eli Lilly and Company | 0,00 | -13,33 | 1,01 | -18,17 | 0,6574 | -0,2321 | |||
| APO / Apollo Global Management, Inc. | 0,01 | 12,76 | 0,97 | 16,85 | 0,6304 | 0,0331 | |||
| UTG / Reaves Utility Income Fund | 0,03 | 0,00 | 0,90 | 11,19 | 0,5868 | 0,0027 | |||
| META / Meta Platforms, Inc. | 0,00 | 2,33 | 0,81 | 31,02 | 0,5267 | 0,0819 | |||
| CB / Chubb Limited | 0,00 | 0,00 | 0,80 | -4,41 | 0,5208 | -0,0818 | |||
| WMB / The Williams Companies, Inc. | 0,01 | -2,30 | 0,80 | 2,70 | 0,5195 | -0,0404 | |||
| NE / Noble Corporation plc | 0,03 | 0,00 | 0,80 | 11,95 | 0,5167 | 0,0062 | |||
| HON / Honeywell International Inc. | 0,00 | -3,54 | 0,79 | 6,02 | 0,5142 | -0,0223 | |||
| PEG / Public Service Enterprise Group Incorporated | 0,01 | -11,17 | 0,77 | -9,09 | 0,4997 | -0,1089 | |||
| QCOM / QUALCOMM Incorporated | 0,00 | -3,66 | 0,73 | -0,14 | 0,4763 | -0,0514 | |||
| BKR / Baker Hughes Company | 0,02 | 0,73 | 0,4726 | 0,4726 | |||||
| EPD / Enterprise Products Partners L.P. - Limited Partnership | 0,02 | -5,46 | 0,70 | -14,15 | 0,4569 | -0,1319 | |||
| PG / The Procter & Gamble Company | 0,00 | -4,39 | 0,69 | -10,68 | 0,4507 | -0,1073 | |||
| AMGN / Amgen Inc. | 0,00 | 0,00 | 0,69 | -10,29 | 0,4470 | -0,1050 | |||
| HD / The Home Depot, Inc. | 0,00 | -22,36 | 0,69 | -22,37 | 0,4460 | -0,1895 | |||
| CVX / Chevron Corporation | 0,00 | -18,65 | 0,62 | -30,36 | 0,4051 | -0,2388 | |||
| LNG / Cheniere Energy, Inc. | 0,00 | 0,00 | 0,61 | 5,19 | 0,3949 | -0,0204 | |||
| TSLX / Sixth Street Specialty Lending, Inc. | 0,03 | 0,00 | 0,60 | 6,44 | 0,3861 | -0,0155 | |||
| MPLX / MPLX LP - Limited Partnership | 0,01 | 0,00 | 0,59 | -3,73 | 0,3851 | -0,0577 | |||
| ICE / Intercontinental Exchange, Inc. | 0,00 | 0,00 | 0,56 | 6,50 | 0,3615 | -0,0147 | |||
| VRTX / Vertex Pharmaceuticals Incorporated | 0,00 | 0,00 | 0,56 | -8,25 | 0,3610 | -0,0741 | |||
| MLM / Martin Marietta Materials, Inc. | 0,00 | 0,00 | 0,55 | 14,64 | 0,3561 | 0,0128 | |||
| PSX / Phillips 66 | 0,00 | -10,00 | 0,54 | -13,13 | 0,3483 | -0,0950 | |||
| TECK / Teck Resources Limited | 0,01 | -8,48 | 0,53 | 1,34 | 0,3451 | -0,0314 | |||
| MERC / Mercer International Inc. | 0,15 | 0,00 | 0,53 | -43,73 | 0,3406 | -0,3298 | |||
| SAP / SAP SE - Depositary Receipt (Common Stock) | 0,00 | 0,00 | 0,49 | 13,36 | 0,3196 | 0,0074 | |||
| WMT / Walmart Inc. | 0,01 | 0,00 | 0,49 | 11,42 | 0,3172 | 0,0020 | |||
| SPG / Simon Property Group, Inc. | 0,00 | 0,00 | 0,48 | -3,21 | 0,3129 | -0,0449 | |||
| WM / Waste Management, Inc. | 0,00 | 0,00 | 0,48 | -1,23 | 0,3117 | -0,0373 | |||
| LIN / Linde plc | 0,00 | 0,00 | 0,48 | 0,85 | 0,3095 | -0,0305 | |||
| FCNCA / First Citizens BancShares, Inc. | 0,00 | 26,88 | 0,46 | 34,01 | 0,2995 | 0,0519 | |||
| AXP / American Express Company | 0,00 | 0,00 | 0,45 | 18,68 | 0,2930 | 0,0195 | |||
| MMC / Marsh & McLennan Companies, Inc. | 0,00 | 0,00 | 0,44 | -10,30 | 0,2881 | -0,0678 | |||
| RSP / Invesco Exchange-Traded Fund Trust - Invesco S&P 500 Equal Weight ETF | 0,00 | -19,17 | 0,44 | -15,22 | 0,2859 | -0,0872 | |||
| VIVA.X / Vanguard Index Funds - Vanguard Value ETF | 0,00 | 7,69 | 0,43 | 10,46 | 0,2809 | -0,0012 | |||
| MA / Mastercard Incorporated | 0,00 | 0,00 | 0,42 | 2,43 | 0,2734 | -0,0217 | |||
| PNC / The PNC Financial Services Group, Inc. | 0,00 | -17,59 | 0,41 | -12,66 | 0,2691 | -0,0717 | |||
| PANW / Palo Alto Networks, Inc. | 0,00 | 0,00 | 0,41 | 19,94 | 0,2655 | 0,0205 | |||
| ENVX / Enovix Corporation | 0,04 | -0,08 | 0,39 | 40,65 | 0,2542 | 0,0543 | |||
| CAT / Caterpillar Inc. | 0,00 | 0,00 | 0,39 | 17,93 | 0,2518 | 0,0151 | |||
| XYL / Xylem Inc. | 0,00 | 0,00 | 0,39 | 8,38 | 0,2518 | -0,0055 | |||
| LYB / LyondellBasell Industries N.V. | 0,01 | 1,15 | 0,38 | -16,99 | 0,2477 | -0,0821 | |||
| OKE / ONEOK, Inc. | 0,00 | 12,50 | 0,37 | -7,32 | 0,2383 | -0,0466 | |||
| TSLA / Tesla, Inc. | 0,00 | 0,00 | 0,37 | 22,41 | 0,2380 | 0,0231 | |||
| SOXX / iShares Trust - iShares Semiconductor ETF | 0,00 | 0,00 | 0,36 | 26,95 | 0,2323 | 0,0296 | |||
| V / Visa Inc. | 0,00 | 0,00 | 0,36 | 1,43 | 0,2303 | -0,0213 | |||
| ORLA / Orla Mining Ltd. | 0,04 | 0,35 | 0,2301 | 0,2301 | |||||
| NEE / NextEra Energy, Inc. | 0,00 | -29,60 | 0,34 | -31,05 | 0,2222 | -0,1345 | |||
| PFF / iShares Trust - iShares Preferred and Income Securities ETF | 0,01 | 0,00 | 0,31 | -0,33 | 0,1990 | -0,0216 | |||
| PLTR / Palantir Technologies Inc. | 0,00 | 0,31 | 0,1990 | 0,1990 | |||||
| GLD / SPDR Gold Trust | 0,00 | 0,00 | 0,30 | 5,56 | 0,1977 | -0,0091 | |||
| BX / Blackstone Inc. | 0,00 | -20,00 | 0,30 | -14,33 | 0,1941 | -0,0568 | |||
| NVS / Novartis AG - Depositary Receipt (Common Stock) | 0,00 | 0,00 | 0,29 | 8,33 | 0,1860 | -0,0036 | |||
| ITA / iShares Trust - iShares U.S. Aerospace & Defense ETF | 0,00 | 0,00 | 0,28 | 23,14 | 0,1836 | 0,0187 | |||
| MS / Morgan Stanley | 0,00 | 0,00 | 0,28 | 20,60 | 0,1828 | 0,0152 | |||
| WCN / Waste Connections, Inc. | 0,00 | 0,00 | 0,28 | -4,11 | 0,1817 | -0,0285 | |||
| HLT / Hilton Worldwide Holdings Inc. | 0,00 | 0,00 | 0,27 | 17,18 | 0,1728 | 0,0094 | |||
| AB / AllianceBernstein Holding L.P. - Limited Partnership | 0,01 | 0,00 | 0,27 | 6,43 | 0,1722 | -0,0066 | |||
| TSCO / Tractor Supply Company | 0,01 | 0,00 | 0,26 | -4,36 | 0,1712 | -0,0266 | |||
| NRG / NRG Energy, Inc. | 0,00 | 0,26 | 0,1703 | 0,1703 | |||||
| UBER / Uber Technologies, Inc. | 0,00 | -1,77 | 0,26 | 25,73 | 0,1683 | 0,0202 | |||
| MSGS / Madison Square Garden Sports Corp. | 0,00 | -2,39 | 0,26 | 4,51 | 0,1660 | -0,0094 | |||
| SPLV / Invesco Exchange-Traded Fund Trust II - Invesco S&P 500 Low Volatility ETF | 0,00 | 0,00 | 0,25 | -2,68 | 0,1653 | -0,0224 | |||
| IVV / iShares Trust - iShares Core S&P 500 ETF | 0,00 | 0,00 | 0,24 | 10,75 | 0,1539 | -0,0002 | |||
| OLN / Olin Corporation | 0,01 | -0,97 | 0,23 | -17,82 | 0,1469 | -0,0512 | |||
| LHX / L3Harris Technologies, Inc. | 0,00 | 0,22 | 0,1396 | 0,1396 | |||||
| NOW / ServiceNow, Inc. | 0,00 | 0,21 | 0,1334 | 0,1334 | |||||
| OWL / Blue Owl Capital Inc. | 0,01 | 0,19 | 0,1246 | 0,1246 | |||||
| COP / ConocoPhillips | 0,00 | -100,00 | 0,00 | 0,0000 | |||||
| FCX / Freeport-McMoRan Inc. | 0,00 | -100,00 | 0,00 | 0,0000 |