Statistiques de base
| Valeur du portefeuille | $ 341 885 |
| Positions actuelles | 55 |
Dernières positions, performances, ASG (à partir des dépôts 13F, 13D)
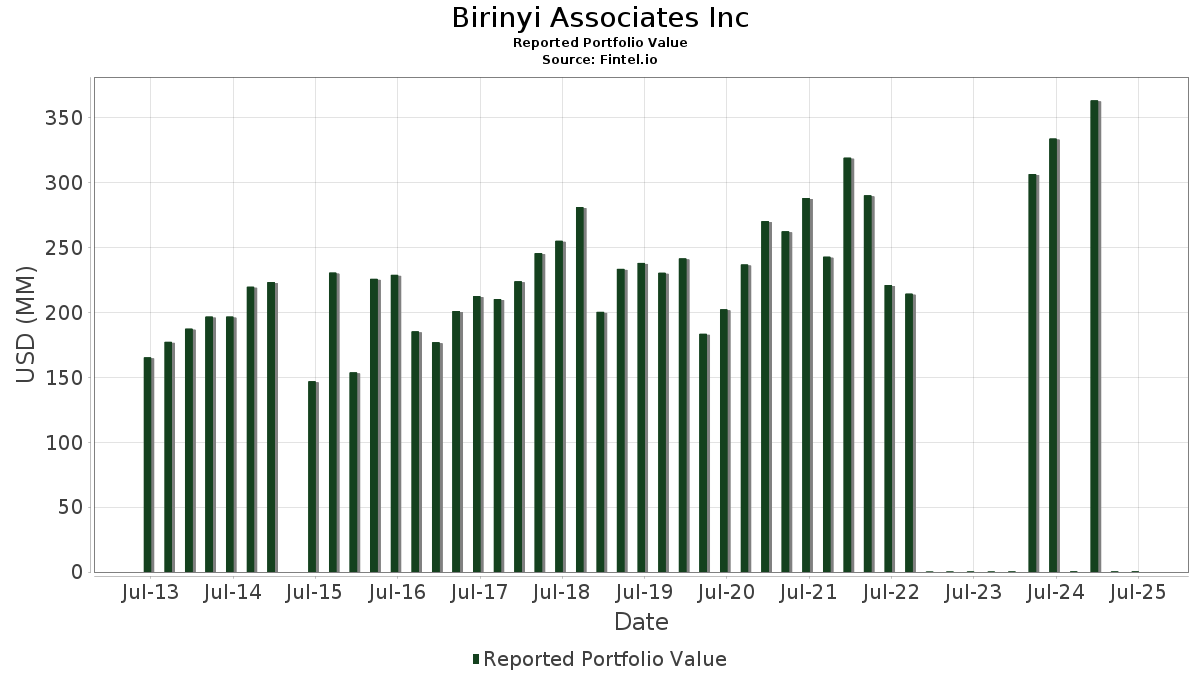
Birinyi Associates Inc a déclaré un total de 55 positions dans ses derniers dépôts auprès de la SEC. La valeur la plus récente du portefeuille est calculée à 341 885 USD. Les actifs sous gestion réels (ASG) sont cette valeur plus les liquidités (qui ne sont pas divulguées). Les principales positions de Birinyi Associates Inc sont Apple Inc. (US:AAPL) , SPDR S&P 500 ETF (US:SPY) , Amazon.com, Inc. (US:AMZN) , Mastercard Incorporated (US:MA) , and Alphabet Inc. (US:GOOG.L) . Les nouvelles positions de Birinyi Associates Inc incluent Lam Research Corporation (US:LRCX) , .
Meilleures augmentations ce trimestre
Nous utilisons la variation de l'allocation du portefeuille car il s'agit de l'indicateur le plus significatif. Les changements peuvent être dus à des transactions ou à des variations de prix des actions.
| Titre | Actions (en millions) |
Valeur ($ en millions) |
% du portefeuille | ΔPortefeuille % |
|---|---|---|---|---|
| 0,01 | 0,01 | 1,7070 | 1,4954 | |
| 0,00 | 0,00 | 1,2250 | 1,2250 | |
| 0,01 | 0,01 | 2,0261 | 1,2147 | |
| 0,11 | 0,02 | 5,0406 | 1,2078 | |
| 0,01 | 0,00 | 1,2267 | 0,6214 | |
| 0,01 | 0,00 | 0,5493 | 0,5493 | |
| 0,00 | 0,00 | 0,9208 | 0,5312 | |
| 0,14 | 0,03 | 9,2923 | 0,5038 | |
| 0,00 | 0,00 | 0,7064 | 0,4715 | |
| 0,02 | 0,00 | 1,4452 | 0,4435 |
Principales baisses ce trimestre
Nous utilisons la variation de l'allocation du portefeuille car il s'agit de l'indicateur le plus significatif. Les changements peuvent être dus à des transactions ou à des variations de prix des actions.
| Titre | Actions (en millions) |
Valeur ($ en millions) |
% du portefeuille | ΔPortefeuille % |
|---|---|---|---|---|
| 0,33 | 0,07 | 19,9786 | -4,0710 | |
| 0,05 | 0,03 | 9,5687 | -0,9160 | |
| 0,02 | 0,01 | 2,3952 | -0,5198 | |
| 0,05 | 0,03 | 7,4625 | -0,5023 | |
| 0,14 | 0,03 | 7,4361 | -0,4789 | |
| 0,01 | 0,01 | 1,5546 | -0,2712 | |
| 0,00 | 0,00 | 1,2791 | -0,2686 | |
| 0,00 | 0,00 | 0,0000 | -0,1922 | |
| 0,00 | 0,01 | 3,3614 | -0,1313 | |
| 0,01 | 0,01 | 1,9407 | -0,1164 |
Déclarations 13F et dépôts de fonds
Ce formulaire a été déposé le 2025-07-23 pour la période de déclaration 2025-06-30. Cliquez sur l'icône du lien pour voir l'historique complet des transactions.
Mettre à niveau pour débloquer les données premium et exporter vers Excel ![]() .
.
| Titre | Type | Prix moyen de l'action | Actions (en millions) |
ΔActions (%) |
ΔActions (%) |
Valeur ($ en millions) |
Portefeuille (%) |
ΔPortefeuille (%) |
|
|---|---|---|---|---|---|---|---|---|---|
| AAPL / Apple Inc. | 0,33 | -0,67 | 0,07 | -8,11 | 19,9786 | -4,0710 | |||
| SPY / SPDR S&P 500 ETF | 0,05 | -8,76 | 0,03 | 0,00 | 9,5687 | -0,9160 | |||
| AMZN / Amazon.com, Inc. | 0,14 | 1,27 | 0,03 | 14,81 | 9,2923 | 0,5038 | |||
| MA / Mastercard Incorporated | 0,05 | 0,93 | 0,03 | 4,17 | 7,4625 | -0,5023 | |||
| GOOG.L / Alphabet Inc. | 0,14 | -8,94 | 0,03 | 4,17 | 7,4361 | -0,4789 | |||
| NVDA / NVIDIA Corporation | 0,11 | -0,37 | 0,02 | 54,55 | 5,0406 | 1,2078 | |||
| MSFT / Microsoft Corporation | 0,03 | -9,10 | 0,02 | 23,08 | 4,8788 | 0,4054 | |||
| BKNG / Booking Holdings Inc. | 0,00 | -15,42 | 0,01 | 10,00 | 3,3614 | -0,1313 | |||
| C / Citigroup Inc. | 0,10 | -2,59 | 0,01 | 14,29 | 2,5684 | 0,1398 | |||
| BRK.A / Berkshire Hathaway Inc. | 0,02 | -0,50 | 0,01 | -11,11 | 2,3952 | -0,5198 | |||
| NFLX / Netflix, Inc. | 0,01 | 92,09 | 0,01 | 200,00 | 2,0261 | 1,2147 | |||
| GSCE / GS Connect S&P GSCI Enhanced Commodity Total Return ETN | 0,01 | -19,57 | 0,01 | 0,00 | 1,9407 | -0,1164 | |||
| VOO / Vanguard Index Funds - Vanguard S&P 500 ETF | 0,01 | 705,88 | 0,01 | 1,7070 | 1,4954 | ||||
| CMG / Chipotle Mexican Grill, Inc. | 0,10 | -1,71 | 0,01 | 0,00 | 1,6526 | -0,0078 | |||
| IBM / International Business Machines Corporation | 0,02 | 17,68 | 0,01 | 66,67 | 1,5666 | 0,3262 | |||
| DIA / SPDR Dow Jones Industrial Average ETF Trust | 0,01 | -10,41 | 0,01 | 0,00 | 1,5546 | -0,2712 | |||
| GOOGL / Alphabet Inc. | 0,03 | -0,05 | 0,00 | 0,00 | 1,4505 | 0,0391 | |||
| AVGO / Broadcom Inc. | 0,02 | -3,21 | 0,00 | 33,33 | 1,4452 | 0,4435 | |||
| BRK.A / Berkshire Hathaway Inc. | 0,00 | 0,00 | 0,00 | 0,00 | 1,2791 | -0,2686 | |||
| MCD / McDonald's Corporation | 0,01 | 139,25 | 0,00 | 300,00 | 1,2267 | 0,6214 | |||
| C.WSA / Citigroup, Inc. | 0,00 | 0,00 | 1,2250 | 1,2250 | |||||
| COST / Costco Wholesale Corporation | 0,00 | 149,49 | 0,00 | 200,00 | 0,9208 | 0,5312 | |||
| UBER / Uber Technologies, Inc. | 0,03 | 0,91 | 0,00 | 50,00 | 0,9088 | 0,1322 | |||
| JPM / JPMorgan Chase & Co. | 0,01 | -0,46 | 0,00 | 50,00 | 0,9085 | 0,0557 | |||
| WMT / Walmart Inc. | 0,03 | -2,01 | 0,00 | 0,00 | 0,8380 | -0,0100 | |||
| DE / Deere & Company | 0,00 | 206,45 | 0,00 | 0,7064 | 0,4715 | ||||
| AXP / American Express Company | 0,01 | 0,00 | 0,00 | 100,00 | 0,6806 | 0,0465 | |||
| PEP / PepsiCo, Inc. | 0,01 | 0,00 | 0,5493 | 0,5493 | |||||
| GJR / Strats Trust For Procter & Gambel Security - Preferred Security | 0,01 | -2,45 | 0,00 | 0,00 | 0,3662 | -0,0773 | |||
| XLV / The Select Sector SPDR Trust - The Health Care Select Sector SPDR Fund | 0,01 | 0,01 | 0,00 | 0,00 | 0,3633 | -0,0712 | |||
| TXRH / Texas Roadhouse, Inc. | 0,01 | -20,48 | 0,00 | 0,00 | 0,3630 | -0,0851 | |||
| CAT / Caterpillar Inc. | 0,00 | 0,00 | 0,00 | 0,3408 | 0,0213 | ||||
| HD / The Home Depot, Inc. | 0,00 | -14,29 | 0,00 | 0,00 | 0,3217 | -0,0927 | |||
| AMGN / Amgen Inc. | 0,00 | 0,00 | 0,00 | 0,00 | 0,3127 | -0,0724 | |||
| CRM / Salesforce, Inc. | 0,00 | 0,00 | 0,00 | 0,00 | 0,3077 | -0,0266 | |||
| META / Meta Platforms, Inc. | 0,00 | -24,39 | 0,00 | 0,2676 | -0,0376 | ||||
| LMT / Lockheed Martin Corporation | 0,00 | -5,26 | 0,00 | 0,2439 | -0,0303 | ||||
| LLY / Eli Lilly and Company | 0,00 | 0,00 | 0,00 | 0,2404 | -0,0409 | ||||
| V / Visa Inc. | 0,00 | 0,00 | 0,00 | 0,2284 | -0,0206 | ||||
| BX / Blackstone Inc. | 0,00 | 0,13 | 0,00 | 0,2071 | -0,0064 | ||||
| LRCX / Lam Research Corporation | 0,01 | 0,00 | 0,0000 | ||||||
| MSCI / MSCI Inc. | 0,00 | 0,00 | 0,00 | 0,1688 | -0,0141 | ||||
| SBUX / Starbucks Corporation | 0,01 | 0,00 | 0,00 | 0,1676 | -0,0304 | ||||
| CVX / Chevron Corporation | 0,00 | 0,00 | 0,00 | 0,1486 | -0,0433 | ||||
| MU / Micron Technology, Inc. | 0,00 | 0,00 | 0,00 | 0,1433 | 0,0319 | ||||
| AIQ / Global X Funds - Global X Artificial Intelligence & Technology ETF | 0,01 | 0,00 | 0,00 | 0,1413 | 0,0114 | ||||
| TSLA / Tesla, Inc. | 0,00 | 0,00 | 0,00 | 0,1392 | 0,0136 | ||||
| UNH / UnitedHealth Group Incorporated | 0,00 | 0,00 | 0,00 | 0,1231 | -0,1052 | ||||
| AB / AllianceBernstein Holding L.P. - Limited Partnership | 0,01 | -8,64 | 0,00 | 0,1226 | -0,0163 | ||||
| NVR / NVR, Inc. | 0,00 | 6,00 | 0,00 | 0,1147 | -0,0026 | ||||
| QCOM / QUALCOMM Incorporated | 0,00 | 0,00 | 0,00 | 0,0933 | -0,0059 | ||||
| ORCL / Oracle Corporation | 0,00 | -15,03 | 0,00 | 0,0831 | 0,0139 | ||||
| PM / Philip Morris International Inc. | 0,00 | 0,00 | 0,00 | 0,0799 | 0,0030 | ||||
| AIG / American International Group, Inc. | 0,00 | 0,00 | 0,00 | 0,0758 | -0,0095 | ||||
| CSCO / Cisco Systems, Inc. | 0,00 | 0,00 | 0,00 | 0,0676 | 0,0013 | ||||
| HLT / Hilton Worldwide Holdings Inc. | 0,00 | -100,00 | 0,00 | 0,0000 | |||||
| LRCX / Lam Research Corporation | 0,00 | -100,00 | 0,00 | 0,0000 | -0,1922 | ||||
| XLF / The Select Sector SPDR Trust - The Financial Select Sector SPDR Fund | 0,00 | -100,00 | 0,00 | 0,0000 | |||||
| ONON / On Holding AG | 0,00 | -100,00 | 0,00 | 0,0000 |