Statistiques de base
| Propriétaires institutionnels | 314 total, 309 long only, 0 short only, 5 long/short - change of 9,41% MRQ |
| Allocation moyenne du portefeuille | 0.1558 % - change of 1,12% MRQ |
| Actions institutionnelles (Long) | 21 420 601 (ex 13D/G) - change of -0,09MM shares -0,40% MRQ |
| Valeur institutionnelle (Long) | $ 1 562 018 USD ($1000) |
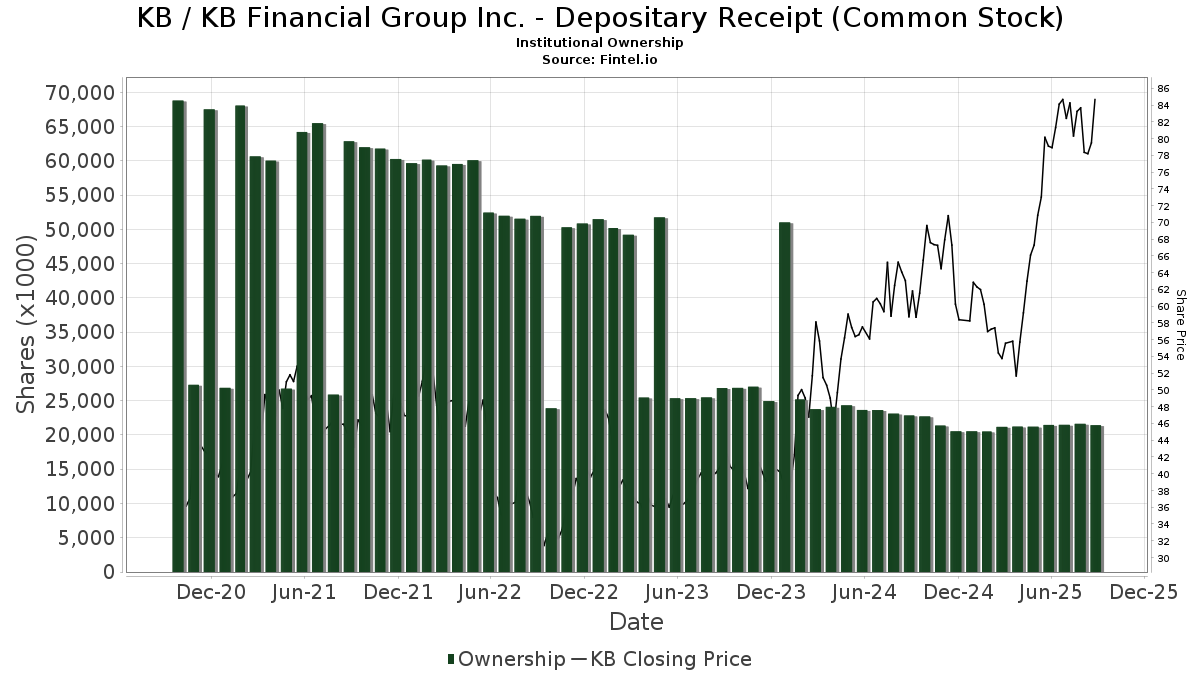
Participation institutionnels et actionnaires
KB Financial Group Inc. - Depositary Receipt (Common Stock) (US:KB) détient 314 des propriétaires institutionnels et des actionnaires qui ont déposé des formulaires 13D/G ou 13F auprès de la Securities Exchange Commission (SEC). Ces institutions détiennent un total de 21,420,601 actions. Les principaux actionnaires incluent Dimensional Fund Advisors Lp, Dimensional Emerging Markets Value Fund - Dimensional Emerging Markets Value Fund, BlackRock, Inc., Lazard Asset Management Llc, Morgan Stanley, Arrowstreet Capital, Limited Partnership, Northern Trust Corp, Bank Of America Corp /de/, American Century Companies Inc, and Connor, Clark & Lunn Investment Management Ltd. .
KB Financial Group Inc. - Depositary Receipt (Common Stock) (NYSE:KB) la structure de l'actionnariat institutionnel indique les positions actuelles des institutions et des fonds dans l'entreprise, ainsi que les derniers changements dans le volume des positions. Les principaux actionnaires peuvent être des investisseurs individuels, des fonds communs de placement, des fonds spéculatifs ou des institutions. L'annexe 13D indique que l'investisseur détient (ou a détenu) plus de 5 % de l'entreprise et qu'il a l'intention (ou a eu l'intention) de poursuivre activement un changement de stratégie commerciale. L'annexe 13G indique un investissement passif de plus de 5 %.
The share price as of September 8, 2025 is 77,72 / share. Previously, on September 9, 2024, the share price was 62,29 / share. This represents an increase of 24,77% over that period.
Indice de confiance des fonds
L'indice de confiance des fonds (anciennement score d'accumulation de participation) trouve les actions qui sont les plus achetées par les fonds. Il est le résultat d'un modèle quantitatif sophistiqué à plusieurs facteurs qui identifie les entreprises avec les niveaux les plus élevés d'accumulation institutionnelle. Le modèle de notation utilise une combinaison de l'augmentation totale des propriétaires déclarés, des variations des allocations de portefeuille chez ces propriétaires et d'autres indicateurs. Le chiffre varie de 0 à 100, les chiffres plus élevés indiquant un niveau d'accumulation plus élevé par rapport aux autres entreprises, 50 étant la moyenne.
Fréquence de mise à jour : Quotidienne
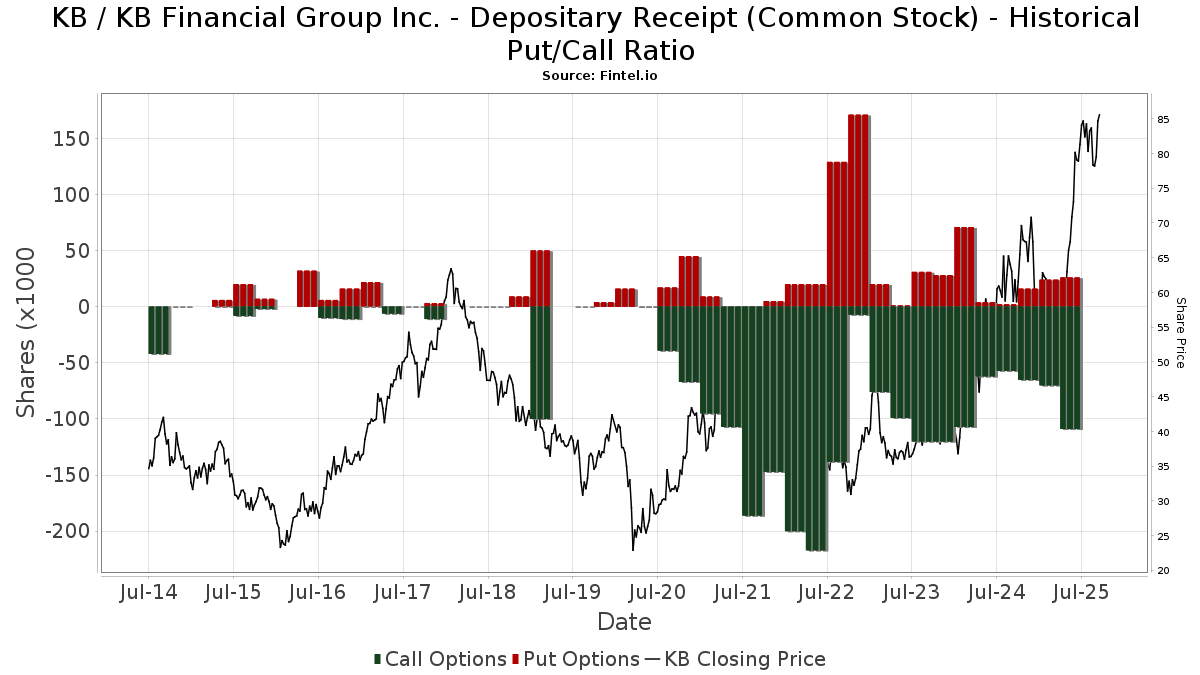
Ratio put/call institutionnel
En plus de signaler les actions et les dettes standard, les institutions ayant plus de 100 millions d'actifs sous gestion doivent également divulguer leurs positions en options de vente et d'achat. Étant donné que les options de vente indiquent généralement une confiance négative, et les options d'achat indiquent une confiance positive, nous pouvons avoir une idée de la confiance institutionnelle globale en traçant le ratio des ventes à découvert par rapport aux achats d'options. Le graphique à droite trace l'historique du ratio des ventes à découvert/achats d'options pour cet instrument.
L'utilisation du ratio put/call comme indicateur de la confiance des investisseurs permet de pallier à l'une des principales lacunes de l'utilisation de la participation institutionnelle totale, à savoir qu'une part importante des actifs sous gestion est investie passivement pour suivre les indices. Les fonds gérés passivement n'achètent généralement pas d'options, de sorte que l'indicateur du ratio put/call suit de plus près la confiance des fonds gérés activement.
Déclarations 13F et NPORT
Les détails des déclarations 13F sont gratuits. Les détails des déclarations NP nécessitent une adhésion premium. Les lignes vertes indiquent de nouvelles positions. Les lignes rouges indiquent des positions clôturées. Cliquez sur l'icône du lien pour voir l'historique complet des transactions.
Mettre à niveau
pour débloquer des données premium et les exporter vers Excel ![]() .
.
| Date de dépôt | Source | Investisseur | Type | Prix moyen (Est) |
Actions | Δ Actions (%) |
Valeur déclarée (1000 $) |
Δ Valeur (%) |
Allocation de portefeuille (%) |
|
|---|---|---|---|---|---|---|---|---|---|---|
| 2025-07-14 | 13F | GAMMA Investing LLC | 1 836 | 105,60 | 152 | 214,58 | ||||
| 2025-06-26 | NP | BLACKROCK FUNDS - BlackRock Advantage Emerging Markets Fund Investor A Shares | 226 | -86,18 | 14 | -86,27 | ||||
| 2025-08-14 | 13F | Verition Fund Management LLC | 0 | -100,00 | 0 | |||||
| 2025-08-11 | 13F | NewEdge Wealth, LLC | 67 699 | 1,33 | 5 594 | 54,72 | ||||
| 2025-07-08 | 13F | Rise Advisors, LLC | 6 | 100,00 | 0 | |||||
| 2025-08-14 | 13F | Aquatic Capital Management LLC | 7 128 | -61,70 | 589 | -41,55 | ||||
| 2025-08-08 | 13F | SG Americas Securities, LLC | 6 359 | -83,23 | 1 | -100,00 | ||||
| 2025-04-21 | 13F | CWA Asset Management Group, LLC | 0 | -100,00 | 0 | -100,00 | ||||
| 2025-08-06 | 13F | Vestmark Advisory Solutions, Inc. | 0 | -100,00 | 0 | |||||
| 2025-08-12 | 13F | Dimensional Fund Advisors Lp | 2 620 620 | 5,05 | 216 418 | 60,37 | ||||
| 2025-08-13 | 13F | Capital International Investors | 671 937 | 22,44 | 55 260 | 86,95 | ||||
| 2025-07-28 | NP | AVEM - Avantis Emerging Markets Equity ETF This fund is a listed as child fund of American Century Companies Inc and if that institution has disclosed ownership in this security, then these positions will not be double counted when calculating total shares and total value | 617 724 | 21,45 | 46 175 | 67,13 | ||||
| 2025-08-11 | 13F | B. Metzler seel. Sohn & Co. AG | 77 332 | -10,49 | 6 387 | 36,63 | ||||
| 2025-07-30 | 13F | Cullen/frost Bankers, Inc. | 418 | 0,00 | 35 | 54,55 | ||||
| 2025-08-14 | 13F | Aspen Grove Capital, LLC | 6 061 | 0,55 | 501 | 52,44 | ||||
| 2025-05-05 | 13F | Lindbrook Capital, Llc | 5 002 | 0,91 | 271 | -4,26 | ||||
| 2025-08-13 | 13F | Groupama Asset Managment | 19 478 | 1,88 | 1 588 | 55,59 | ||||
| 2025-05-15 | 13F | Talon Private Wealth, LLC | 0 | -100,00 | 0 | -100,00 | ||||
| 2025-08-01 | 13F | Envestnet Asset Management Inc | 174 924 | 0,39 | 14 447 | 53,22 | ||||
| 2025-08-05 | 13F | Westside Investment Management, Inc. | 385 | 32 | ||||||
| 2025-08-13 | 13F | Mirabella Financial Services Llp | 7 346 | -97,10 | 609 | -95,58 | ||||
| 2025-08-14 | 13F | Prelude Capital Management, Llc | 0 | -100,00 | 0 | |||||
| 2025-07-29 | NP | GIMFX - GMO Implementation Fund | 8 621 | 0,00 | 644 | 37,61 | ||||
| 2025-07-30 | 13F | Whittier Trust Co | 233 | 19 | ||||||
| 2025-08-18 | 13F/A | National Bank Of Canada /fi/ | 69 | 0,00 | 6 | 66,67 | ||||
| 2025-07-18 | 13F | BSW Wealth Partners | 3 611 | 298 | ||||||
| 2025-07-30 | 13F | Whittier Trust Co Of Nevada Inc | 107 | 15,05 | 9 | 60,00 | ||||
| 2025-08-07 | 13F | Parkside Financial Bank & Trust | 336 | 585,71 | 28 | 1 250,00 | ||||
| 2025-07-29 | 13F | Calamos Wealth Management LLC | 36 409 | 3 007 | ||||||
| 2025-07-21 | 13F | Qrg Capital Management, Inc. | 15 147 | 13,08 | 1 251 | 72,65 | ||||
| 2025-07-23 | 13F | Trinity Street Asset Management LLP | 328 551 | -0,55 | 27 135 | 51,79 | ||||
| 2025-08-12 | 13F | LPL Financial LLC | 11 519 | 163,47 | 951 | 302,97 | ||||
| 2025-07-18 | 13F | Generali Investments CEE, investicni spolecnost, a.s. | 34 888 | 0,00 | 2 881 | 52,68 | ||||
| 2025-08-14 | 13F | Aqr Capital Management Llc | 14 448 | 160,18 | 1 193 | 297,67 | ||||
| 2025-05-15 | 13F | StoneX Group Inc. | 0 | -100,00 | 0 | -100,00 | ||||
| 2025-08-13 | 13F | Todd Asset Management Llc | 528 787 | -8,15 | 43 673 | 40,19 | ||||
| 2025-08-12 | 13F | Coldstream Capital Management Inc | 7 663 | 280,30 | 633 | 479,82 | ||||
| 2025-08-14 | 13F | D. E. Shaw & Co., Inc. | 0 | -100,00 | 0 | |||||
| 2025-08-14 | 13F | Banque Transatlantique SA | 0 | -100,00 | 0 | |||||
| 2025-07-15 | 13F | Fifth Third Bancorp | 8 320 | 1,24 | 687 | 54,73 | ||||
| 2025-07-25 | 13F | Sequoia Financial Advisors, LLC | 15 984 | 12,74 | 1 320 | 72,10 | ||||
| 2025-07-21 | 13F | Ascent Group, LLC | 3 261 | 269 | ||||||
| 2025-08-05 | 13F | Bridgewater Advisors Inc. | 8 059 | 0,44 | 641 | 29,29 | ||||
| 2025-07-31 | 13F | Caitong International Asset Management Co., Ltd | 14 | 1 | ||||||
| 2025-08-05 | 13F | Bank of New York Mellon Corp | 15 004 | 1,97 | 1 239 | 55,65 | ||||
| 2025-08-11 | 13F | Annis Gardner Whiting Capital Advisors, LLC | 148 | 12 | ||||||
| 2025-08-14 | 13F | Mercer Global Advisors Inc /adv | 10 750 | -4,33 | 888 | 45,89 | ||||
| 2025-08-13 | 13F | Grantham, Mayo, Van Otterloo & Co. LLC | 53 153 | -19,48 | 4 390 | 22,87 | ||||
| 2025-08-14 | 13F | Aprio Wealth Management, LLC | 9 851 | 2,43 | 814 | 56,35 | ||||
| 2025-08-15 | 13F | Tower Research Capital LLC (TRC) | 570 | -72,33 | 47 | -57,66 | ||||
| 2025-08-14 | 13F | Raymond James Financial Inc | 150 464 | 18,47 | 12 427 | 80,82 | ||||
| 2025-07-24 | 13F | Ronald Blue Trust, Inc. | 5 665 | -7,27 | 468 | 41,52 | ||||
| 2025-08-04 | 13F | Assetmark, Inc | 225 | 122,77 | 19 | 260,00 | ||||
| 2025-08-13 | 13F | Walleye Trading LLC | Put | 13 200 | 1 090 | |||||
| 2025-08-13 | 13F | Walleye Trading LLC | Call | 16 700 | 1 379 | |||||
| 2025-08-14 | 13F | Quantinno Capital Management LP | 42 301 | 60,20 | 3 494 | 144,61 | ||||
| 2025-06-23 | NP | UUPIX - Ultraemerging Markets Profund Investor Class | 1 447 | 3,73 | 91 | 4,60 | ||||
| 2025-08-05 | 13F | NewSquare Capital LLC | 154 | 113,89 | 13 | 300,00 | ||||
| 2025-08-13 | 13F | Jones Financial Companies Lllp | 174 | 0,00 | 14 | 55,56 | ||||
| 2025-07-25 | 13F | Yousif Capital Management, Llc | 38 413 | -6,74 | 3 173 | 42,37 | ||||
| 2025-08-13 | 13F | Walleye Trading LLC | 1 072 | 89 | ||||||
| 2025-07-15 | 13F | Public Employees Retirement System Of Ohio | 115 825 | -4,98 | 9 566 | 45,01 | ||||
| 2025-08-11 | 13F | Principal Securities, Inc. | 62 | 37,78 | 5 | 150,00 | ||||
| 2025-08-13 | 13F | Capital Research Global Investors | 59 551 | 18,12 | 4 854 | 80,45 | ||||
| 2025-07-16 | 13F | Perigon Wealth Management, LLC | 0 | -100,00 | 0 | |||||
| 2025-04-18 | 13F | Insigneo Advisory Services, Llc | 0 | -100,00 | 0 | -100,00 | ||||
| 2025-07-09 | 13F | Sivia Capital Partners, LLC | 4 112 | -19,04 | 340 | 23,72 | ||||
| 2025-05-15 | 13F/A | Orion Portfolio Solutions, LLC | 10 465 | -2,12 | 566 | -6,91 | ||||
| 2025-07-17 | 13F | Park Place Capital Corp | 504 | 0,00 | 42 | 51,85 | ||||
| 2025-08-01 | 13F | Financial Counselors Inc | 0 | -100,00 | 0 | |||||
| 2025-08-20 | NP | REMG - Emerging Markets Equity Active ETF | 3 325 | 275 | ||||||
| 2025-08-13 | 13F | Invesco Ltd. | 152 939 | 508,93 | 12 631 | 829,43 | ||||
| 2025-07-25 | NP | DEMAX - Delaware Emerging Markets Fund Class A | 245 928 | 0,00 | 18 383 | 37,62 | ||||
| 2025-08-13 | 13F | Schroder Investment Management Group | 64 244 | 24,30 | 5 306 | 92,42 | ||||
| 2025-06-26 | NP | DEXC - Dimensional Emerging Markets ex China Core Equity ETF | 7 590 | 21,46 | 478 | 22,56 | ||||
| 2025-07-30 | 13F | Eqis Capital Management, Inc. | 3 567 | -12,59 | 295 | 33,64 | ||||
| 2025-08-06 | 13F | First Horizon Advisors, Inc. | 303 | 25 | ||||||
| 2025-08-13 | 13F | Cresset Asset Management, LLC | 3 320 | -13,27 | 274 | 32,37 | ||||
| 2025-06-26 | NP | SNTKX - Steward International Enhanced Index Fund Class A | 8 767 | 36 429,17 | 552 | 55 100,00 | ||||
| 2025-07-24 | NP | SHP ETF Trust - FIS Knights of Columbus Global Belief ETF | 4 512 | 0,00 | 337 | 37,55 | ||||
| 2025-08-11 | 13F | United Capital Financial Advisers, Llc | 5 806 | -0,26 | 480 | 52,55 | ||||
| 2025-07-17 | 13F | Clean Yield Group | 293 | 0,00 | 24 | 60,00 | ||||
| 2025-07-28 | NP | VCGEX - Emerging Economies Fund | 5 475 | 12,63 | 409 | 54,92 | ||||
| 2025-07-31 | 13F | Glass Jacobson Investment Advisors llc | 0 | -100,00 | 0 | |||||
| 2025-07-28 | 13F | Ritholtz Wealth Management | 49 892 | -4,22 | 4 121 | 46,20 | ||||
| 2025-08-11 | 13F | Raiffeisen Bank International AG | 7 656 | -22,42 | 623 | 18,25 | ||||
| 2025-08-14 | 13F | Glenmede Investment Management, LP | 3 237 | 267 | ||||||
| 2025-08-14 | 13F | Two Sigma Investments, Lp | 93 977 | -32,98 | 7 762 | 2,29 | ||||
| 2025-08-14 | 13F | Two Sigma Advisers, Lp | 38 900 | -24,02 | 3 213 | 15,96 | ||||
| 2025-07-16 | 13F | Signaturefd, Llc | 25 794 | -1,47 | 2 130 | 50,42 | ||||
| 2025-08-14 | 13F | Evergreen Capital Management Llc | 4 390 | 363 | ||||||
| 2025-08-14 | 13F | Group One Trading, L.p. | Put | 100 | 8 | |||||
| 2025-08-14 | 13F | Group One Trading, L.p. | Call | 11 600 | 1,75 | 958 | 55,52 | |||
| 2025-08-14 | 13F | Henry James International Management Inc. | 63 108 | 0,04 | 5 212 | 52,71 | ||||
| 2025-07-16 | 13F | Banque Pictet & Cie Sa | 6 526 | 56,80 | 539 | 139,11 | ||||
| 2025-08-07 | 13F | Connor, Clark & Lunn Investment Management Ltd. | 734 981 | -12,96 | 60 702 | 32,86 | ||||
| 2025-08-12 | 13F | Atlas Capital Advisors Llc | 8 898 | 1,95 | 735 | 55,51 | ||||
| 2025-08-11 | 13F | Bell Investment Advisors, Inc | 282 | -5,69 | 23 | 43,75 | ||||
| 2025-08-27 | 13F/A | Squarepoint Ops LLC | 0 | -100,00 | 0 | -100,00 | ||||
| 2025-07-28 | NP | AVEEX - Avantis Emerging Markets Equity Fund Institutional Class This fund is a listed as child fund of American Century Companies Inc and if that institution has disclosed ownership in this security, then these positions will not be double counted when calculating total shares and total value | 25 431 | 0,00 | 1 901 | 37,58 | ||||
| 2025-08-06 | 13F | Pekin Hardy Strauss, Inc. | 3 000 | 248 | ||||||
| 2025-07-24 | 13F | Ramirez Asset Management, Inc. | 304 298 | 24,59 | 25 132 | 90,17 | ||||
| 2025-08-12 | 13F | Dynamic Technology Lab Private Ltd | 0 | -100,00 | 0 | |||||
| 2025-08-14 | 13F | GWM Advisors LLC | 12 154 | 0,75 | 1 004 | 53,83 | ||||
| 2025-08-07 | 13F | Legacy Advisors, LLC | 0 | -100,00 | 0 | |||||
| 2025-08-13 | 13F | Capital International Inc /ca/ | 36 395 | -2,56 | 3 006 | 48,69 | ||||
| 2025-06-26 | NP | DFAE - Dimensional Emerging Core Equity Market ETF | 59 962 | 36,31 | 3 776 | 37,41 | ||||
| 2025-07-23 | 13F | Canopy Partners, LLC | 6 728 | 0,28 | 556 | 52,89 | ||||
| 2025-08-13 | 13F | West Family Investments, Inc. | 11 486 | 20,66 | 949 | 84,08 | ||||
| 2025-07-16 | NP | CGDG - Capital Group Dividend Growers ETF Share Class | 302 977 | 34,56 | 22 648 | 85,18 | ||||
| 2025-08-07 | 13F | Vise Technologies, Inc. | 36 360 | 71,44 | 3 003 | 148,92 | ||||
| 2025-08-12 | 13F | Jpmorgan Chase & Co | 43 178 | -77,14 | 3 566 | -65,10 | ||||
| 2025-05-06 | 13F | Venturi Wealth Management, LLC | 0 | -100,00 | 0 | |||||
| 2025-07-31 | 13F | Buckingham Strategic Partners | 2 899 | 239 | ||||||
| 2025-06-30 | NP | VT - Vanguard Total World Stock Index Fund ETF Shares | 39 869 | 0,00 | 2 511 | 0,80 | ||||
| 2025-08-13 | 13F | Amundi | 17 820 | -76,82 | 1 499 | -62,74 | ||||
| 2025-07-14 | 13F | Abound Wealth Management | 10 | 0,00 | 1 | |||||
| 2025-08-14 | 13F | Harris Associates L P | 3 545 | 293 | ||||||
| 2025-08-07 | 13F | Acadian Asset Management Llc | 97 490 | -21,19 | 8 | 33,33 | ||||
| 2025-08-13 | 13F | Northern Trust Corp | 956 289 | -0,08 | 78 980 | 52,50 | ||||
| 2025-07-29 | NP | BPLSX - Boston Partners Long/Short Equity Fund INSTITUTIONAL | 14 036 | 15,26 | 1 049 | 58,70 | ||||
| 2025-07-17 | 13F | Beacon Capital Management, LLC | 39 | 0,00 | 3 | 50,00 | ||||
| 2025-08-15 | 13F | Morgan Stanley | 985 573 | 4,02 | 81 399 | 58,78 | ||||
| 2025-06-26 | NP | Dimensional Emerging Markets Value Fund - Dimensional Emerging Markets Value Fund This fund is a listed as child fund of Dimensional Fund Advisors Lp and if that institution has disclosed ownership in this security, then these positions will not be double counted when calculating total shares and total value | 1 765 706 | -0,26 | 111 204 | 0,55 | ||||
| 2025-08-13 | 13F | Twin Peaks Wealth Advisors, LLC | 181 | 15 | ||||||
| 2025-07-09 | 13F | Bruce G. Allen Investments, LLC | 481 | -48,06 | 40 | -22,00 | ||||
| 2025-08-14 | 13F | Ieq Capital, Llc | 8 263 | 682 | ||||||
| 2025-08-11 | 13F | Brown Brothers Harriman & Co | 160 | 13 | ||||||
| 2025-08-13 | 13F | Capital Analysts, Inc. | 139 | -14,20 | 0 | |||||
| 2025-08-14 | 13F | Erste Asset Management GmbH | 5 000 | 408 | ||||||
| 2025-08-13 | 13F | Quadrant Capital Group Llc | 30 642 | 10,69 | 2 531 | 69,00 | ||||
| 2025-07-29 | NP | GBFFX - GMO Benchmark-Free Fund Class III | 3 654 | 0,00 | 273 | 37,88 | ||||
| 2025-08-04 | 13F | Virtus Family Office LLC | 19 619 | 18,64 | 1 620 | 79,40 | ||||
| 2025-08-14 | 13F | Strategic Global Advisors, LLC | 3 430 | 283 | ||||||
| 2025-08-12 | 13F | SRS Capital Advisors, Inc. | 322 | 27 | ||||||
| 2025-08-14 | 13F | Atomi Financial Group, Inc. | 11 310 | 27,62 | 934 | 94,99 | ||||
| 2025-07-15 | 13F | Maseco Llp | 99 | 8 | ||||||
| 2025-08-04 | 13F | Simon Quick Advisors, Llc | 3 131 | 259 | ||||||
| 2025-06-26 | NP | DFSE - Dimensional Emerging Markets Sustainability Core 1 ETF | 4 208 | 4,91 | 265 | 6,00 | ||||
| 2025-08-14 | 13F | Balyasny Asset Management Llc | 25 305 | -11,87 | 2 090 | 34,51 | ||||
| 2025-08-12 | 13F | Franklin Resources Inc | 6 102 | 0,54 | 504 | 53,35 | ||||
| 2025-07-14 | 13F | UMA Financial Services, Inc. | 57 | 128,00 | 5 | 300,00 | ||||
| 2025-07-24 | 13F | Jfs Wealth Advisors, Llc | 515 | 3,41 | 43 | 61,54 | ||||
| 2025-08-14 | 13F/A | Bank Julius Baer & Co. Ltd, Zurich | 22 958 | 10,87 | 1 896 | 49,76 | ||||
| 2025-08-14 | 13F | Macquarie Group Ltd | 251 278 | -0,04 | 20 753 | 52,58 | ||||
| 2025-08-14 | 13F | Wealth Preservation Advisors, LLC | 29 | 2 | ||||||
| 2025-05-29 | NP | JVANX - International Equity Index Trust NAV | 0 | -100,00 | 0 | -100,00 | ||||
| 2025-05-12 | 13F | Polen Capital Management Llc | 0 | -100,00 | 0 | -100,00 | ||||
| 2025-08-13 | 13F | Russell Investments Group, Ltd. | 6 804 | 4 725,53 | 562 | 7 914,29 | ||||
| 2025-08-14 | 13F | Citadel Advisors Llc | 7 464 | -59,75 | 616 | -38,58 | ||||
| 2025-08-18 | 13F | Geneos Wealth Management Inc. | 8 | 1 | ||||||
| 2025-08-13 | 13F | Advisory Research Inc | 97 765 | 5,47 | 8 074 | 61,00 | ||||
| 2025-08-14 | 13F | Citadel Advisors Llc | Put | 3 900 | 105,26 | 322 | 215,69 | |||
| 2025-07-21 | 13F | Hgk Asset Management Inc | 0 | -100,00 | 0 | |||||
| 2025-07-30 | NP | APIE - ActivePassive International Equity ETF | 26 271 | -25,65 | 1 964 | 2,29 | ||||
| 2025-07-21 | 13F | Hilltop National Bank | 0 | -100,00 | 0 | |||||
| 2025-08-04 | 13F | Hantz Financial Services, Inc. | 771 | 817,86 | 0 | |||||
| 2025-06-26 | NP | DFCEX - Emerging Markets Core Equity Portfolio - Institutional Class This fund is a listed as child fund of Dimensional Fund Advisors Lp and if that institution has disclosed ownership in this security, then these positions will not be double counted when calculating total shares and total value | 367 901 | 0,00 | 23 170 | 0,82 | ||||
| 2025-08-14 | 13F | Citadel Advisors Llc | Call | 19 700 | 129,07 | 1 627 | 249,89 | |||
| 2025-05-09 | 13F | Deutsche Bank Ag\ | 0 | -100,00 | 0 | -100,00 | ||||
| 2025-08-07 | 13F | Hennion & Walsh Asset Management, Inc. | 10 866 | 31,61 | 897 | 101,12 | ||||
| 2025-08-13 | 13F | Bare Financial Services, Inc | 148 | 190,20 | 12 | 500,00 | ||||
| 2025-08-12 | 13F | BlackRock, Inc. | 1 671 572 | 3,22 | 138 055 | 57,55 | ||||
| 2025-08-14 | 13F | Boston Private Wealth Llc | 0 | -100,00 | 0 | -100,00 | ||||
| 2025-08-13 | 13F | Walleye Capital LLC | 674 | 56 | ||||||
| 2025-08-13 | 13F | Walleye Capital LLC | Call | 2 500 | 206 | |||||
| 2025-08-14 | 13F | Orbis Allan Gray Ltd | 370 306 | 0,91 | 30 584 | 54,02 | ||||
| 2025-06-26 | NP | DFEM - Dimensional Emerging Markets Core Equity 2 ETF | 26 085 | 18,04 | 1 643 | 18,99 | ||||
| 2025-07-25 | 13F | Verdence Capital Advisors LLC | 2 626 | 217 | ||||||
| 2025-08-14 | 13F | Millennium Management Llc | 33 034 | -10,11 | 2 728 | 37,22 | ||||
| 2025-07-23 | 13F | High Note Wealth, LLC | 4 | 0 | ||||||
| 2025-08-14 | 13F | Bank Of America Corp /de/ | 845 567 | 9,15 | 69 835 | 66,60 | ||||
| 2025-08-26 | NP | Profunds - Profund Vp Emerging Markets | 6 316 | 17,01 | 522 | 78,42 | ||||
| 2025-07-25 | 13F | Pzena Investment Management Llc | 41 601 | -17,38 | 3 436 | 26,10 | ||||
| 2025-06-26 | NP | HFIGX - Hartford Schroders Diversified Growth Fund Class I | 1 713 | 28,03 | 108 | 28,92 | ||||
| 2025-07-28 | 13F | Naviter Wealth, LLC | 4 507 | 372 | ||||||
| 2025-07-08 | 13F | Parallel Advisors, LLC | 10 756 | 10,22 | 888 | 68,18 | ||||
| 2025-07-17 | 13F | HB Wealth Management, LLC | 3 059 | 253 | ||||||
| 2025-08-08 | 13F | D'Orazio & Associates, Inc. | 2 662 | 220 | ||||||
| 2025-08-08 | 13F | Ranmore Fund Management Ltd | 255 549 | 8,49 | 21 106 | 65,59 | ||||
| 2025-08-11 | 13F | TD Waterhouse Canada Inc. | 0 | -100,00 | 0 | |||||
| 2025-08-11 | 13F | Vanguard Group Inc | 368 458 | 0,00 | 30 431 | 52,63 | ||||
| 2025-08-13 | 13F | Thornburg Investment Management Inc | 5 650 | -79,42 | 467 | -96,86 | ||||
| 2025-08-08 | 13F | Candriam Luxembourg S.C.A. | 6 063 | 0,00 | 501 | 52,44 | ||||
| 2025-06-26 | NP | DFA INVESTMENT DIMENSIONS GROUP INC - Emerging Markets Social Core Equity Portfolio Shares | 10 427 | 0,00 | 657 | 0,77 | ||||
| 2025-08-14 | 13F | Royal Bank Of Canada | 340 327 | 24,62 | 28 109 | 90,20 | ||||
| 2025-06-26 | NP | Dfa Investment Trust Co - The Emerging Markets Series This fund is a listed as child fund of Dimensional Fund Advisors Lp and if that institution has disclosed ownership in this security, then these positions will not be double counted when calculating total shares and total value | 2 997 | -28,20 | 189 | -27,69 | ||||
| 2025-08-04 | 13F | Atria Investments Llc | 9 581 | 53,00 | 791 | 134,02 | ||||
| 2025-08-13 | 13F | Congress Wealth Management LLC / DE / | 5 217 | -49,40 | 431 | -22,80 | ||||
| 2025-07-28 | NP | AVES - Avantis Emerging Markets Value ETF This fund is a listed as child fund of American Century Companies Inc and if that institution has disclosed ownership in this security, then these positions will not be double counted when calculating total shares and total value | 76 629 | 11,60 | 5 728 | 53,61 | ||||
| 2025-08-14 | 13F | Voya Investment Management Llc | 34 575 | 2 856 | ||||||
| 2025-05-15 | 13F | Cullen Capital Management, LLC | 93 222 | -26,93 | 5 044 | -30,51 | ||||
| 2025-07-18 | 13F | Deltec Asset Management Llc | 17 000 | -2,86 | 1 404 | 48,41 | ||||
| 2025-07-25 | 13F | JustInvest LLC | 51 141 | 18,17 | 4 224 | 80,39 | ||||
| 2025-08-14 | 13F/A | Barclays Plc | 4 870 | -72,55 | 0 | |||||
| 2025-07-30 | 13F | DekaBank Deutsche Girozentrale | 10 687 | 0,00 | 1 | |||||
| 2025-07-30 | 13F | Drive Wealth Management, Llc | 3 366 | 278 | ||||||
| 2025-07-31 | 13F | Cambridge Investment Research Advisors, Inc. | 5 465 | 45,23 | 0 | |||||
| 2025-08-14 | 13F | Susquehanna International Group, Llp | Call | 18 800 | -9,62 | 1 553 | 37,96 | |||
| 2025-08-14 | 13F | Susquehanna International Group, Llp | Put | 9 500 | -54,55 | 785 | -30,62 | |||
| 2025-08-14 | 13F | Ameriprise Financial Inc | 9 641 | -4,17 | 796 | 46,32 | ||||
| 2025-08-13 | 13F | Shelton Capital Management | 4 409 | 364 | ||||||
| 2025-07-14 | 13F | Foster Group, Inc. | 3 545 | 293 | ||||||
| 2025-07-16 | 13F | Highline Wealth Partners Llc | 112 | 119,61 | 9 | 350,00 | ||||
| 2025-08-13 | 13F | Guggenheim Capital Llc | 22 225 | 15,70 | 1 836 | 76,61 | ||||
| 2025-05-15 | 13F | Nomura Holdings Inc | 0 | -100,00 | 0 | |||||
| 2025-08-12 | 13F | O'shaughnessy Asset Management, Llc | 122 938 | 6,30 | 10 153 | 62,27 | ||||
| 2025-08-11 | 13F | Lsv Asset Management | 20 100 | 0,00 | 2 | 0,00 | ||||
| 2025-08-13 | 13F | Quantbot Technologies LP | 4 753 | 393 | ||||||
| 2025-07-30 | 13F | Blume Capital Management, Inc. | 4 | 0 | ||||||
| 2025-08-08 | 13F | Hartland & Co., LLC | 83 | 0,00 | 7 | 50,00 | ||||
| 2025-08-14 | 13F | Warren Averett Asset Management, LLC | 5 069 | 0,00 | 419 | 52,55 | ||||
| 2025-07-28 | NP | NSI - National Security Emerging Markets Index ETF | 1 685 | 38,68 | 126 | 92,31 | ||||
| 2025-07-29 | NP | RBB FUND, INC. - Aquarius International Fund | 6 431 | 0,00 | 481 | 37,54 | ||||
| 2025-08-29 | NP | SA FUNDS INVESTMENT TRUST - SA Emerging Markets Value Fund | 17 477 | -10,78 | 1 443 | 36,26 | ||||
| 2025-08-05 | 13F | Bank Of Montreal /can/ | 62 296 | 16,46 | 5 145 | 77,78 | ||||
| 2025-08-07 | 13F | Allworth Financial LP | 1 298 | 5,70 | 107 | 48,61 | ||||
| 2025-08-05 | 13F | Simplex Trading, Llc | Put | 100 | -92,31 | 0 | ||||
| 2025-08-05 | 13F | Simplex Trading, Llc | 832 | -12,51 | 0 | |||||
| 2025-08-12 | 13F | Rhumbline Advisers | 37 811 | -16,22 | 3 123 | 27,85 | ||||
| 2025-07-25 | 13F | Johnson Investment Counsel Inc | 2 733 | 226 | ||||||
| 2025-08-05 | 13F | Simplex Trading, Llc | Call | 10 300 | 1 | |||||
| 2025-08-06 | 13F | Commonwealth Equity Services, Llc | 6 613 | -33,88 | 1 | |||||
| 2025-08-12 | 13F | Seeds Investor Llc | 6 379 | 19,70 | 527 | 82,64 | ||||
| 2025-07-08 | 13F | Arlington Trust Co LLC | 112 | 0,00 | 9 | 50,00 | ||||
| 2025-07-14 | 13F | AdvisorNet Financial, Inc | 96 | -28,36 | 8 | 0,00 | ||||
| 2025-07-28 | NP | AVXC - Avantis Emerging Markets ex-China Equity ETF | 5 924 | 37,35 | 443 | 88,89 | ||||
| 2025-08-05 | 13F | Huntington National Bank | 978 | 2,19 | 81 | 56,86 | ||||
| 2025-08-06 | 13F | Paradigm Asset Management Co Llc | 600 | 0,00 | 50 | 53,13 | ||||
| 2025-08-14 | 13F | Wellington Management Group Llp | 112 677 | -0,47 | 9 306 | 51,92 | ||||
| 2025-08-14 | 13F | Integrated Wealth Concepts LLC | 4 102 | 339 | ||||||
| 2025-08-13 | 13F | First Trust Advisors Lp | 16 481 | -14,16 | 1 361 | 31,12 | ||||
| 2025-08-14 | 13F | Ariel Investments, Llc | 52 122 | -50,06 | 4 305 | -23,78 | ||||
| 2025-08-14 | 13F/A | Rockefeller Capital Management L.P. | 15 458 | -0,92 | 1 277 | 51,18 | ||||
| 2025-08-15 | 13F | WealthCollab, LLC | 898 | -4,77 | 74 | 45,10 | ||||
| 2025-08-14 | 13F | Wetherby Asset Management Inc | 55 945 | 2,21 | 4 620 | 48,36 | ||||
| 2025-08-14 | 13F | Stifel Financial Corp | 24 603 | 22,18 | 2 032 | 86,50 | ||||
| 2025-08-06 | 13F | BNP Paribas Asset Management Holding S.A. | 109 808 | 9 | ||||||
| 2025-05-01 | 13F | Schechter Investment Advisors, LLC | 4 953 | -25,57 | 268 | -29,37 | ||||
| 2025-08-08 | 13F | Crossmark Global Holdings, Inc. | 29 535 | 76,29 | 2 439 | 169,21 | ||||
| 2025-08-11 | 13F | Hexagon Capital Partners LLC | 0 | -100,00 | 0 | |||||
| 2025-08-13 | 13F | Mount Yale Investment Advisors, LLC | 2 464 | 204 | ||||||
| 2025-05-15 | 13F | Glenmede Trust Co Na | 3 755 | -21,15 | 203 | -24,81 | ||||
| 2025-08-14 | 13F | Mml Investors Services, Llc | 4 126 | 5,26 | 0 | |||||
| 2025-08-14 | 13F | Goldman Sachs Group Inc | 190 327 | -9,51 | 15 719 | 38,12 | ||||
| 2025-06-30 | NP | VEU - Vanguard FTSE All-World ex-US Index Fund ETF Shares | 295 077 | 0,00 | 18 584 | 0,81 | ||||
| 2025-08-13 | 13F | Kilter Group LLC | 53 | 4 | ||||||
| 2025-08-14 | 13F | Mariner, LLC | 28 869 | 14,60 | 2 383 | 74,96 | ||||
| 2025-08-11 | 13F | Frank, Rimerman Advisors LLC | 8 151 | 673 | ||||||
| 2025-05-02 | 13F | Cable Hill Partners, LLC | 5 459 | -2,20 | 344 | 8,20 | ||||
| 2025-08-04 | 13F | Spire Wealth Management | 59 | 5 | ||||||
| 2025-08-14 | 13F | Axa S.a. | 19 169 | 0,00 | 1 583 | 52,65 | ||||
| 2025-07-24 | 13F | Us Bancorp \de\ | 21 300 | 4,20 | 1 759 | 59,04 | ||||
| 2025-08-08 | 13F | JBF Capital, Inc. | 6 000 | 20,00 | 496 | 83,33 | ||||
| 2025-07-09 | 13F | Triumph Capital Management | 0 | -100,00 | 0 | |||||
| 2025-08-07 | 13F | Profund Advisors Llc | 8 667 | 24,40 | 716 | 90,16 | ||||
| 2025-08-27 | NP | GBVCX - Victory Pioneer Global Value Fund Class C | 1 330 | 0,00 | 110 | 53,52 | ||||
| 2025-08-13 | 13F | Cerity Partners LLC | 42 346 | -9,17 | 3 497 | 38,66 | ||||
| 2025-08-07 | 13F | BOK Financial Private Wealth, Inc. | 0 | -100,00 | 0 | |||||
| 2025-08-26 | NP | MASTER INVESTMENT PORTFOLIO - Active Stock Master Portfolio Active Stock Portfolio | 690 | -76,92 | 57 | -65,22 | ||||
| 2025-08-14 | 13F | Lazard Asset Management Llc | 1 554 154 | 1,73 | 128 | 56,10 | ||||
| 2025-08-01 | 13F | Bessemer Group Inc | 2 515 | 0,00 | 0 | |||||
| 2025-08-13 | 13F | Marshall Wace, Llp | 168 857 | -40,13 | 13 946 | -8,61 | ||||
| 2025-08-19 | 13F | Asset Dedication, LLC | 20 | 0,00 | 2 | 0,00 | ||||
| 2025-08-07 | 13F | Teachers Retirement System Of The State Of Kentucky | 320 500 | -14,58 | 26 | 30,00 | ||||
| 2025-08-13 | 13F | M&t Bank Corp | 4 418 | 2,74 | 365 | 56,90 | ||||
| 2025-08-12 | 13F | MAI Capital Management | 2 828 | 234 | ||||||
| 2025-08-12 | 13F | Global Retirement Partners, LLC | 8 245 | 23 457,14 | 681 | 67 900,00 | ||||
| 2025-08-13 | 13F | Townsquare Capital Llc | 0 | -100,00 | 0 | |||||
| 2025-05-15 | 13F | Ancora Advisors, LLC | 0 | -100,00 | 0 | -100,00 | ||||
| 2025-08-13 | 13F | Capital World Investors | 26 060 | -9,56 | 2 124 | 38,19 | ||||
| 2025-08-14 | 13F | Principal Street Partners, LLC | 2 598 | 215 | ||||||
| 2025-08-12 | 13F | Pathstone Holdings, LLC | 26 373 | 9,22 | 2 178 | 66,77 | ||||
| 2025-07-22 | 13F | LGT Group Foundation | 14 657 | 165,77 | 1 211 | 306,04 | ||||
| 2025-08-13 | 13F | Capital Group Private Client Services, Inc. | 81 721 | -0,74 | 6 749 | 51,49 | ||||
| 2025-07-22 | 13F | Knights of Columbus Asset Advisors LLC | 8 071 | 0,00 | 667 | 52,75 | ||||
| 2025-07-17 | 13F | V-Square Quantitative Management LLC | 0 | -100,00 | 0 | |||||
| 2025-08-14 | 13F | Vident Advisory, LLC | 50 090 | -20,71 | 4 137 | 21,01 | ||||
| 2025-08-08 | 13F | Creative Planning | 104 163 | 34,74 | 8 603 | 105,64 | ||||
| 2025-08-14 | 13F | Wiley Bros.-aintree Capital, Llc | 6 640 | 5,87 | 548 | 64,07 | ||||
| 2025-08-11 | 13F | HighTower Advisors, LLC | 4 576 | -7,96 | 378 | 40,15 | ||||
| 2025-07-09 | 13F | Gilman Hill Asset Management, LLC | 69 313 | 0,02 | 5 725 | 52,68 | ||||
| 2025-07-30 | 13F | Ethic Inc. | 57 016 | -6,33 | 4 647 | 39,76 | ||||
| 2025-08-12 | 13F | Gitterman Wealth Management, LLC | 3 200 | 264 | ||||||
| 2025-08-13 | 13F | Natixis Advisors, L.p. | 34 461 | -4,51 | 3 | 100,00 | ||||
| 2025-08-14 | 13F | Royal London Asset Management Ltd | 12 488 | 0,87 | 1 031 | 54,11 | ||||
| 2025-08-14 | 13F | Qube Research & Technologies Ltd | 0 | -100,00 | 0 | |||||
| 2025-06-25 | NP | WRAAX - Wilmington Global Alpha Equities Fund Class A Shares | 2 787 | 9,68 | 176 | 10,76 | ||||
| 2025-07-17 | 13F | Greenleaf Trust | 14 613 | 0,29 | 1 207 | 53,05 | ||||
| 2025-08-14 | 13F | Promethos Capital, LLC | 115 335 | 0,96 | 9 525 | 54,10 | ||||
| 2025-08-14 | 13F | Ubs Asset Management Americas Inc | 15 980 | -83,47 | 1 320 | -74,78 | ||||
| 2025-08-14 | 13F | Altrinsic Global Advisors Llc | 54 811 | -0,24 | 4 527 | 52,24 | ||||
| 2025-07-28 | NP | AVSE - Avantis Responsible Emerging Markets Equity ETF | 7 004 | 13,24 | 524 | 56,12 | ||||
| 2025-05-15 | 13F | CAPROCK Group, Inc. | 17 894 | 0,23 | 978 | -3,65 | ||||
| 2025-08-27 | NP | RYWTX - Emerging Markets 2x Strategy Fund Class A | 1 969 | 161,14 | 163 | 305,00 | ||||
| 2025-07-28 | 13F | Harbour Investments, Inc. | 241 | 0,00 | 20 | 46,15 | ||||
| 2025-07-28 | 13F | BRYN MAWR TRUST Co | 50 | -91,13 | 4 | -86,67 | ||||
| 2025-08-14 | 13F | Sei Investments Co | 14 268 | 3,62 | 1 178 | 58,12 | ||||
| 2025-07-30 | 13F | Bleakley Financial Group, LLC | 10 340 | -7,26 | 854 | 41,46 | ||||
| 2025-08-06 | 13F | Savant Capital, LLC | 4 150 | 343 | ||||||
| 2025-08-13 | 13F | Victory Capital Management Inc | 68 740 | 340,08 | 5 755 | 581,07 | ||||
| 2025-08-12 | 13F | Wayfinding Financial, LLC | 0 | -100,00 | 0 | |||||
| 2025-09-04 | 13F/A | Advisor Group Holdings, Inc. | 6 889 | 19,13 | 569 | 82,05 | ||||
| 2025-08-14 | 13F | Voloridge Investment Management, Llc | 23 860 | -66,47 | 1 971 | -48,83 | ||||
| 2025-08-14 | 13F | Colony Group, LLC | 8 991 | 743 | ||||||
| 2025-06-26 | NP | DFAX - Dimensional World ex U.S. Core Equity 2 ETF | 10 567 | 0,00 | 666 | 0,76 | ||||
| 2025-08-29 | NP | MPLAX - Praxis International Index Fund Class A | 19 354 | 113,24 | 1 598 | 225,46 | ||||
| 2025-08-11 | 13F | Pinnacle Wealth Planning Services, Inc. | 3 477 | -16,50 | 287 | 27,56 | ||||
| 2025-07-15 | 13F | Mather Group, Llc. | 0 | -100,00 | 0 | |||||
| 2025-08-01 | 13F | Oversea-Chinese Banking CORP Ltd | 3 547 | -8,91 | 293 | 39,05 | ||||
| 2025-07-09 | 13F | Aaron Wealth Advisors LLC | 5 676 | 9,98 | 469 | 67,74 | ||||
| 2025-08-14 | 13F | Silvercrest Asset Management Group Llc | 161 146 | 0,00 | 13 309 | 52,64 | ||||
| 2025-08-08 | 13F | Wealth Alliance | 2 599 | 215 | ||||||
| 2025-08-13 | 13F | EverSource Wealth Advisors, LLC | 6 692 | 11,38 | 553 | 69,85 | ||||
| 2025-08-13 | 13F | Arrowstreet Capital, Limited Partnership | 963 244 | -0,47 | 79 554 | 51,91 | ||||
| 2025-06-26 | NP | EMQAX - Ashmore Emerging Markets Active Equity Fund CLASS A | 0 | -100,00 | 0 | -100,00 | ||||
| 2025-05-05 | 13F | Transce3nd, LLC | 0 | -100,00 | 0 | |||||
| 2025-08-08 | 13F | Itau Unibanco Holding S.A. | 15 158 | -1,33 | 1 252 | |||||
| 2025-05-05 | 13F | Eagle Bay Advisors LLC | 0 | -100,00 | 0 | -100,00 | ||||
| 2025-07-25 | 13F | Cwm, Llc | 2 267 | -7,88 | 0 | |||||
| 2025-08-14 | 13F | Jane Street Group, Llc | 0 | -100,00 | 0 | |||||
| 2025-07-23 | 13F | Vontobel Holding Ltd. | 2 560 | 211 | ||||||
| 2025-06-26 | NP | DFEV - Dimensional Emerging Markets Value ETF | 3 434 | -39,76 | 216 | -39,33 | ||||
| 2025-07-25 | NP | DWGAX - AMERICAN FUNDS DEVELOPING WORLD GROWTH & INCOME FUND Class A This fund is a listed as child fund of Capital World Investors and if that institution has disclosed ownership in this security, then these positions will not be double counted when calculating total shares and total value | 81 239 | 0,00 | 6 073 | 37,62 | ||||
| 2025-08-14 | 13F | Systematic Alpha Investments, LLC | 3 600 | 297 | ||||||
| 2025-07-24 | 13F | PDS Planning, Inc | 8 373 | 4,35 | 692 | 59,22 | ||||
| 2025-08-12 | 13F | American Century Companies Inc | 751 168 | 18,32 | 62 039 | 80,59 | ||||
| 2025-08-14 | 13F/A | Skopos Labs, Inc. | 2 108 | 573,48 | 174 | 987,50 | ||||
| 2025-04-21 | 13F | Nelson, Van Denburg & Campbell Wealth Management Group, LLC | 0 | -100,00 | 0 | |||||
| 2025-06-26 | NP | BLACKROCK FUNDS - BlackRock Advantage ESG Emerging Markets Equity Fund Institutional This fund is a listed as child fund of BlackRock, Inc. and if that institution has disclosed ownership in this security, then these positions will not be double counted when calculating total shares and total value | 265 | -59,23 | 17 | -60,00 | ||||
| 2025-07-21 | 13F | Credential Qtrade Securities Inc. | 0 | -100,00 | 0 | -100,00 | ||||
| 2025-08-14 | 13F | Wells Fargo & Company/mn | 105 244 | 15,99 | 8 692 | 77,06 | ||||
| 2025-08-14 | 13F | Barometer Capital Management Inc. | 3 043 | 0,00 | 251 | 53,05 | ||||
| 2025-08-27 | 13F/A | Brinker Capital Investments, LLC | 17 686 | 69,00 | 1 461 | 157,95 | ||||
| 2025-07-07 | 13F | Northwest & Ethical Investments L.P. | 0 | -100,00 | 0 | -100,00 | ||||
| 2025-08-08 | 13F | Cetera Investment Advisers | 8 584 | 66,39 | 709 | 153,76 | ||||
| 2025-07-29 | 13F | Private Trust Co Na | 19 | 2 | ||||||
| 2025-04-17 | 13F | Optas, LLC | 0 | -100,00 | 0 | |||||
| 2025-04-17 | 13F | Vista Wealth Management Group, LLC | 4 656 | -15,94 | 252 | -20,32 | ||||
| 2025-08-01 | 13F | Solstein Capital, LLC | 14 987 | 0,00 | 1 238 | 52,72 | ||||
| 2025-08-14 | 13F | UBS Group AG | 87 082 | -33,55 | 7 192 | 1,42 | ||||
| 2025-08-14 | 13F | Smartleaf Asset Management LLC | 146 | -18,44 | 12 | 22,22 | ||||
| 2025-08-11 | 13F | Citigroup Inc | 66 180 | 6,81 | 5 466 | 63,04 | ||||
| 2025-08-08 | 13F | SBI Securities Co., Ltd. | 6 | 500,00 | 0 | |||||
| 2025-08-08 | 13F | Pnc Financial Services Group, Inc. | 13 515 | 15,51 | 1 116 | 76,30 | ||||
| 2025-08-28 | NP | QEMM - SPDR MSCI Emerging Markets StrategicFactors ETF | 1 270 | -3,93 | 105 | 46,48 | ||||
| 2025-07-24 | 13F | IFP Advisors, Inc | 86 | 62,26 | 7 | 250,00 | ||||
| 2025-08-13 | 13F | Hsbc Holdings Plc | 442 300 | 141,53 | 21 338 | 79,21 | ||||
| 2025-08-12 | 13F | Proequities, Inc. | Put | 0 | 0 | |||||
| 2025-08-13 | 13F | Hsbc Holdings Plc | Call | 30 000 | 0,00 | 2 478 | 52,62 | |||
| 2025-08-13 | 13F | Northwestern Mutual Wealth Management Co | 878 | 10 875,00 | 73 | |||||
| 2025-08-14 | 13F | Fmr Llc | 23 089 | 40,32 | 1 907 | 114,16 | ||||
| 2025-08-12 | 13F | Proequities, Inc. | Call | 0 | 0 | |||||
| 2025-08-25 | 13F/A | Neuberger Berman Group LLC | 2 929 | 242 | ||||||
| 2025-08-12 | 13F | Proequities, Inc. | 0 | 0 | ||||||
| 2025-08-28 | NP | JINTX - Johnson International Fund | 2 400 | 0,00 | 198 | 53,49 | ||||
| 2025-07-11 | 13F | Farther Finance Advisors, LLC | 2 134 | 215,21 | 176 | 388,89 | ||||
| 2025-08-07 | 13F | Midwest Trust Co | 3 549 | 293 | ||||||
| 2025-07-01 | 13F | Confluence Investment Management Llc | 4 732 | -6,45 | 391 | 42,86 | ||||
| 2025-07-10 | 13F | Wealth Enhancement Advisory Services, Llc | 26 053 | -1,12 | 2 233 | 56,63 | ||||
| 2025-08-07 | 13F | Sierra Ocean, Llc | 425 | -1,62 | 35 | 52,17 | ||||
| 2025-08-15 | 13F | CI Private Wealth, LLC | 15 808 | 3,22 | 1 306 | 57,61 | ||||
| 2025-08-12 | 13F | Advisors Asset Management, Inc. | 14 796 | 5,16 | 1 222 | 60,58 | ||||
| 2025-08-12 | 13F/A | Boston Partners | 86 769 | -28,88 | 7 163 | 8,19 | ||||
| 2025-07-15 | 13F | Ballentine Partners, LLC | 24 447 | 16,02 | 2 019 | 77,11 | ||||
| 2025-05-15 | 13F | Jain Global LLC | 0 | -100,00 | 0 | |||||
| 2025-08-12 | 13F | CIBC Private Wealth Group, LLC | 199 | 105,15 | 16 | 300,00 | ||||
| 2025-07-25 | 13F | Allspring Global Investments Holdings, LLC | 3 645 | 302 | ||||||
| 2025-05-15 | 13F | Integrated Quantitative Investments LLC | 0 | -100,00 | 0 | |||||
| 2025-08-14 | 13F | Bnp Paribas Arbitrage, Sa | 5 547 | -94,85 | 458 | -92,15 |