Statistiques de base
| Gestionnaire | Richard Pzena |
| Profil de l'initié | PZENA INVESTMENT MANAGEMENT LLC |
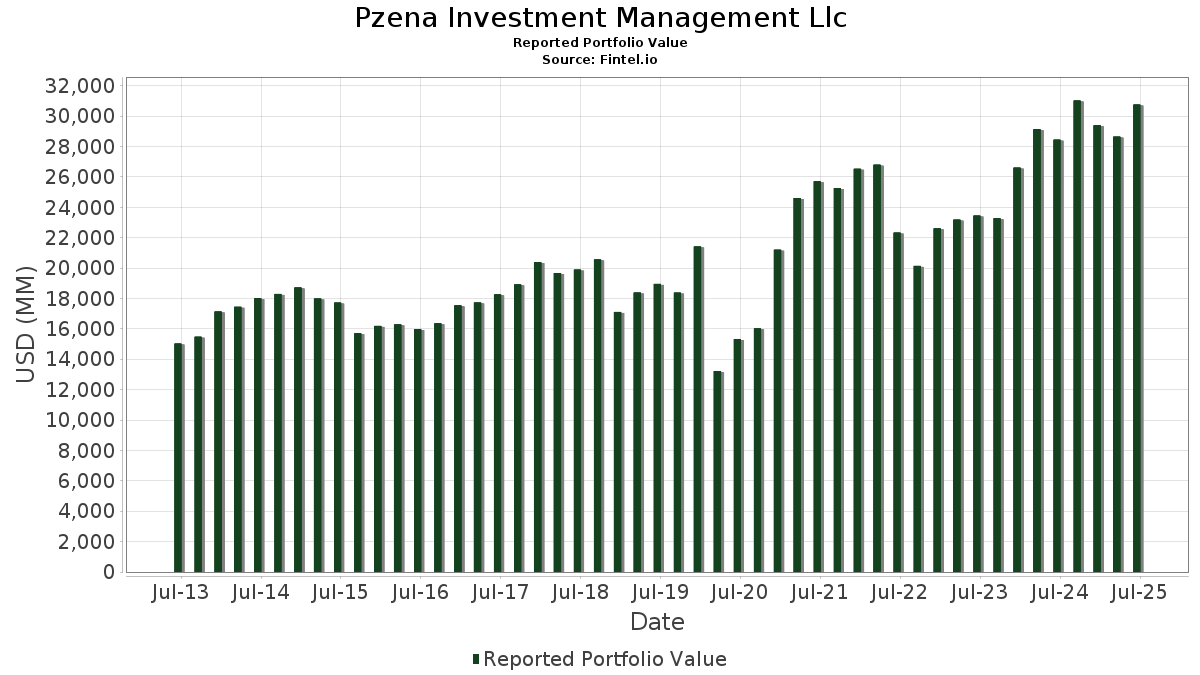
| Valeur du portefeuille | $ 30 752 340 879 |
| Positions actuelles | 152 |
Dernières positions, performances, ASG (à partir des dépôts 13F, 13D)
Pzena Investment Management Llc a déclaré un total de 152 positions dans ses derniers dépôts auprès de la SEC. Le(s) gestionnaire(s) de portefeuille sont répertoriés comme Richard Pzena. La valeur la plus récente du portefeuille est calculée à 30 752 340 879 USD. Les actifs sous gestion réels (ASG) sont cette valeur plus les liquidités (qui ne sont pas divulguées). Les principales positions de Pzena Investment Management Llc sont Magna International Inc. (US:MGA) , Cognizant Technology Solutions Corporation (US:CTSH) , Dollar General Corporation (US:DG) , Baxter International Inc. (US:BAX) , and Citigroup Inc. (US:C) . Les nouvelles positions de Pzena Investment Management Llc incluent WNS (Holdings) Limited (US:WNS) , Oshkosh Corporation (US:OSK) , Arcos Dorados Holdings Inc. (US:ARCO) , Teleflex Incorporated (US:TFX) , and GSK plc - Depositary Receipt (Common Stock) (US:GSK) . Les principales industries de Pzena Investment Management Llc sont "Health Services" (sic 80) , "Stone, Clay, Glass, And Concrete Products" (sic 32) , and "Communications" (sic 48) .
Meilleures augmentations ce trimestre
Nous utilisons la variation de l'allocation du portefeuille car il s'agit de l'indicateur le plus significatif. Les changements peuvent être dus à des transactions ou à des variations de prix des actions.
| Titre | Actions (en millions) |
Valeur ($ en millions) |
% du portefeuille | ΔPortefeuille % |
|---|---|---|---|---|
| 18,72 | 664,69 | 2,1326 | 1,2453 | |
| 12,21 | 909,71 | 2,9188 | 1,1671 | |
| 13,57 | 1 155,48 | 3,7574 | 0,4530 | |
| 11,85 | 1 355,28 | 4,3484 | 0,4279 | |
| 1,66 | 105,13 | 0,3419 | 0,3419 | |
| 10,37 | 830,99 | 2,7022 | 0,2385 | |
| 5,42 | 1 153,49 | 3,7009 | 0,2165 | |
| 0,53 | 59,71 | 0,1942 | 0,1942 | |
| 29,50 | 1 553,03 | 5,0501 | 0,1918 | |
| 2,79 | 103,08 | 0,3352 | 0,1858 |
Principales baisses ce trimestre
Nous utilisons la variation de l'allocation du portefeuille car il s'agit de l'indicateur le plus significatif. Les changements peuvent être dus à des transactions ou à des variations de prix des actions.
| Titre | Actions (en millions) |
Valeur ($ en millions) |
% du portefeuille | ΔPortefeuille % |
|---|---|---|---|---|
| 27,09 | 717,38 | 2,3328 | -0,7100 | |
| 14,84 | 687,10 | 2,2045 | -0,6614 | |
| 39,34 | 1 191,11 | 3,8732 | -0,5214 | |
| 13,71 | 766,86 | 2,4605 | -0,4946 | |
| 42,71 | 530,87 | 1,7263 | -0,4824 | |
| 16,75 | 1 155,20 | 3,7565 | -0,4261 | |
| 4,08 | 996,66 | 3,1978 | -0,3395 | |
| 68,66 | 355,67 | 1,1566 | -0,3239 | |
| 4,24 | 237,93 | 0,7634 | -0,3100 | |
| 10,46 | 866,14 | 2,7790 | -0,2609 |
Déclarations 13D/G
Il s'agit d'une liste des déclarations 13D et 13G déposées au cours de la dernière année (le cas échéant). Cliquez sur l'icône du lien pour voir l'historique complet des transactions. Les lignes vertes indiquent de nouvelles positions. Les lignes rouges indiquent des positions fermées.
| Date de dépôt | Formulaire | Titre | Actions précédentes |
Actions actuelles |
ΔActions % | % de participation |
% ΔParticipation | |
|---|---|---|---|---|---|---|---|---|
| 2025-09-02 | BAX / Baxter International Inc. | 39 708 226 | 55 458 217 | 39,66 | 10,80 | 40,26 | ||
| 2025-07-15 | ARCO / Arcos Dorados Holdings Inc. | 6 533 482 | 5,00 | |||||
| 2025-07-14 | AMWD / American Woodmark Corporation | 840 674 | 1 148 331 | 36,60 | 7,90 | 38,60 | ||
| 2025-07-14 | SWKS / Skyworks Solutions, Inc. | 7 851 443 | 12 321 597 | 56,93 | 8,20 | 60,78 | ||
| 2025-07-11 | PVH / PVH Corp. | 6 219 748 | 6 465 818 | 3,96 | 13,40 | 19,64 | ||
| 2025-07-11 | OEC / Orion S.A. | 3 647 985 | 4 577 197 | 25,47 | 8,10 | 28,57 | ||
| 2025-07-03 | VREX / Varex Imaging Corporation | 3 890 879 | 4 244 977 | 9,10 | 10,20 | 7,37 | ||
| 2025-07-03 | HVT / Haverty Furniture Companies, Inc. | 962 102 | 1 560 557 | 62,20 | 10,50 | 64,06 | ||
| 2025-07-03 | SHYF / The Shyft Group, Inc. | 3 099 622 | 3 579 364 | 15,48 | 10,20 | 13,33 | ||
| 2025-05-01 | JELD / JELD-WEN Holding, Inc. | 10 311 305 | 0 | -100,00 | 0,00 | -100,00 | ||
| 2025-05-01 | PLOW / Douglas Dynamics, Inc. | 2 273 003 | 2 325 476 | 2,31 | 10,10 | 3,06 | ||
| 2025-05-01 | GCO / Genesco Inc. | 1 047 673 | 1 399 224 | 33,56 | 12,70 | 36,56 | ||
| 2025-04-28 | KOP / Koppers Holdings Inc. | 1 221 328 | 6,10 | |||||
| 2025-04-28 | AAP / Advance Auto Parts, Inc. | 3 270 897 | 4 312 508 | 31,84 | 7,20 | 30,91 | ||
| 2025-04-28 | PAHC / Phibro Animal Health Corporation | 1 460 800 | 723 830 | -50,45 | 3,60 | -50,00 | ||
| 2025-04-28 | SPB / Spectrum Brands Holdings, Inc. | 1 334 033 | 5,10 | |||||
| 2025-02-04 | MGA / Magna International Inc. | 28 289 811 | 10,00 | |||||
| 2025-01-30 | DG / Dollar General Corporation | 11 861 633 | 5,40 | |||||
| 2025-01-30 | EQH / Equitable Holdings, Inc. | 8 234 705 | 2,60 | |||||
| 2025-01-30 | SSNC / SS&C Technologies Holdings, Inc. | 14 619 455 | 11 667 485 | -20,19 | 4,70 | -20,34 | ||
| 2025-01-23 | AVT / Avnet, Inc. | 8 751 446 | 7 364 024 | -15,85 | 8,50 | -12,37 | ||
| 2025-01-23 | NWL / Newell Brands Inc. | 54 518 863 | 49 432 520 | -9,33 | 11,90 | -9,85 | ||
| 2024-11-08 | TILE / Interface, Inc. | 3 490 324 | 317 299 | -90,91 | 0,50 | -91,67 | ||
| 2024-11-08 | SCSC / ScanSource, Inc. | 1 893 151 | 514 503 | -72,82 | 2,10 | -72,00 | ||
| 2024-10-22 | GIL / Gildan Activewear Inc. | 9 602 146 | 636 743 | -93,37 | 0,40 | -92,86 | ||
| 2024-10-22 | CNO / CNO Financial Group, Inc. | 6 982 684 | 4 577 890 | -34,44 | 4,30 | -30,65 | ||
| 2024-10-21 | MRC / MRC Global Inc. | 7 001 859 | 5 770 791 | -17,58 | 6,80 | -18,07 | ||
| 2024-10-21 | SCS / Steelcase Inc. | 7 843 245 | 5 239 449 | -33,20 | 5,60 | -33,33 | ||
| 2024-10-21 | USNA / USANA Health Sciences, Inc. | 1 049 610 | 5,50 | |||||
| 2024-10-21 | DOX / Amdocs Limited | 6 482 552 | 5,70 | |||||
| 2024-10-15 | MBUU / Malibu Boats, Inc. | 1 555 331 | 7,80 | |||||
| 2024-10-10 | HOFT / Hooker Furnishings Corporation | 1 426 039 | 1 286 381 | -9,79 | 12,00 | -10,45 | ||
| 2024-10-07 | LEA / Lear Corporation | 6 304 116 | 7 764 912 | 23,17 | 13,80 | 27,78 | ||
| 2024-10-04 | NOV / NOV Inc. | 31 371 893 | 43 348 680 | 38,18 | 11,00 | 37,50 |
Déclarations 13F et dépôts de fonds
Ce formulaire a été déposé le 2025-07-25 pour la période de déclaration 2025-06-30. Cliquez sur l'icône du lien pour voir l'historique complet des transactions.
Mettre à niveau pour débloquer les données premium et exporter vers Excel ![]() .
.
| Titre | Type | Prix moyen de l'action | Actions (en millions) |
ΔActions (%) |
ΔActions (%) |
Valeur ($ en millions) |
Portefeuille (%) |
ΔPortefeuille (%) |
|
|---|---|---|---|---|---|---|---|---|---|
| MGA / Magna International Inc. | 29,50 | 3,70 | 1 553,03 | 11,61 | 5,0501 | 0,1918 | |||
| CTSH / Cognizant Technology Solutions Corporation | 17,45 | 2,20 | 1 361,68 | 4,24 | 4,4279 | -0,1327 | |||
| DG / Dollar General Corporation | 11,85 | -7,22 | 1 355,28 | 20,69 | 4,3484 | 0,4279 | |||
| BAX / Baxter International Inc. | 39,34 | 6,97 | 1 191,11 | -5,37 | 3,8732 | -0,5214 | |||
| C / Citigroup Inc. | 13,57 | 1,82 | 1 155,48 | 22,09 | 3,7574 | 0,4530 | |||
| CVS / CVS Health Corporation | 16,75 | -5,29 | 1 155,20 | -3,57 | 3,7565 | -0,4261 | |||
| COF / Capital One Financial Corporation | 5,42 | -2,60 | 1 153,49 | 15,58 | 3,7009 | 0,2165 | |||
| CHTR / Charter Communications, Inc. | 2,65 | -4,79 | 1 083,36 | 5,61 | 3,5229 | -0,0586 | |||
| HUM / Humana Inc. | 4,08 | 6,47 | 996,66 | -1,63 | 3,1978 | -0,3395 | |||
| SWKS / Skyworks Solutions, Inc. | 12,21 | 57,26 | 909,71 | 81,32 | 2,9188 | 1,1671 | |||
| GPN / Global Payments Inc. | 11,05 | 32,59 | 884,46 | 8,38 | 2,8761 | 0,0269 | |||
| SSNC / SS&C Technologies Holdings, Inc. | 10,46 | 0,36 | 866,14 | -0,52 | 2,7790 | -0,2609 | |||
| WFC / Wells Fargo & Company | 10,37 | 5,52 | 830,99 | 17,76 | 2,7022 | 0,2385 | |||
| UBS / UBS Group AG | 30,90 | 5,29 | 829,73 | 5,21 | 2,6622 | -0,0913 | |||
| MDT / Medtronic plc | 8,86 | 5,59 | 771,92 | 2,43 | 2,4767 | -0,1544 | |||
| TSN / Tyson Foods, Inc. | 13,71 | 3,35 | 766,86 | -9,39 | 2,4605 | -0,4946 | |||
| MET / MetLife, Inc. | 9,14 | 6,84 | 735,41 | 7,02 | 2,3595 | -0,0397 | |||
| LEA / Lear Corporation | 7,60 | -0,81 | 722,13 | 6,79 | 2,3169 | -0,0439 | |||
| DOW / Dow Inc. | 27,09 | 8,55 | 717,38 | -17,68 | 2,3328 | -0,7100 | |||
| BMY / Bristol-Myers Squibb Company | 14,84 | 10,29 | 687,10 | -16,29 | 2,2045 | -0,6614 | |||
| CRBG / Corebridge Financial, Inc. | 18,72 | 132,58 | 664,69 | 161,53 | 2,1326 | 1,2453 | |||
| DOX / Amdocs Limited | 6,55 | 2,06 | 597,72 | 1,77 | 1,9178 | -0,1327 | |||
| NOV / NOV Inc. | 42,71 | 2,75 | 530,87 | -16,08 | 1,7263 | -0,4824 | |||
| PVH / PVH Corp. | 6,41 | 3,99 | 439,56 | 10,36 | 1,4294 | 0,0388 | |||
| FMS / Fresenius Medical Care AG - Depositary Receipt (Common Stock) | 14,66 | -4,64 | 418,92 | 9,41 | 1,3441 | 0,0073 | |||
| TEL / TE Connectivity plc | 2,42 | -2,03 | 407,94 | 16,93 | 1,3089 | 0,0909 | |||
| AVT / Avnet, Inc. | 7,34 | 2,93 | 389,68 | 13,61 | 1,2671 | 0,0696 | |||
| NOK / Nokia Oyj - Depositary Receipt (Common Stock) | 68,66 | -14,66 | 355,67 | -16,12 | 1,1566 | -0,3239 | |||
| BAC / Bank of America Corporation | 6,58 | 3,52 | 311,21 | 17,39 | 1,0120 | 0,0864 | |||
| NWL / Newell Brands Inc. | 48,37 | -0,75 | 261,22 | -13,55 | 0,8494 | -0,2056 | |||
| VOYA / Voya Financial, Inc. | 3,66 | 1,73 | 259,95 | 6,59 | 0,8340 | -0,0174 | |||
| SHEL / Shell plc - Depositary Receipt (Common Stock) | 3,67 | 2,03 | 258,06 | -1,97 | 0,8280 | -0,0911 | |||
| EQH / Equitable Holdings, Inc. | 4,24 | -28,14 | 237,93 | -22,61 | 0,7634 | -0,3100 | |||
| BAP / Credicorp Ltd. | 1,03 | -1,69 | 229,72 | 18,04 | 0,7370 | 0,0576 | |||
| DAL / Delta Air Lines, Inc. | 4,31 | 1,91 | 212,08 | 14,95 | 0,6897 | 0,0455 | |||
| AAP / Advance Auto Parts, Inc. | 4,39 | 1,91 | 204,32 | 20,83 | 0,6644 | 0,0740 | |||
| CI / The Cigna Group | 0,52 | 9,66 | 173,09 | 10,19 | 0,5554 | 0,0069 | |||
| PFE / Pfizer Inc. | 6,56 | -7,08 | 158,99 | -11,12 | 0,5170 | -0,1075 | |||
| KSPI / Joint Stock Company Kaspi.kz - Depositary Receipt (Common Stock) | 1,68 | 17,28 | 142,67 | 7,23 | 0,4578 | -0,0068 | |||
| ZTO / ZTO Express (Cayman) Inc. - Depositary Receipt (Common Stock) | 7,62 | -1,36 | 135,31 | -11,75 | 0,4341 | -0,1012 | |||
| MHK / Mohawk Industries, Inc. | 1,18 | 5,36 | 123,27 | -3,26 | 0,4008 | -0,0440 | |||
| CNXC / Concentrix Corporation | 2,28 | -0,44 | 120,34 | -5,42 | 0,3861 | -0,0581 | |||
| GL / Globe Life Inc. | 0,95 | 0,54 | 117,58 | -5,13 | 0,3772 | -0,0555 | |||
| PPG / PPG Industries, Inc. | 1,01 | 5,25 | 115,34 | 9,49 | 0,3701 | 0,0023 | |||
| MS / Morgan Stanley | 0,79 | 3,67 | 111,44 | 25,16 | 0,3576 | 0,0467 | |||
| CSCO / Cisco Systems, Inc. | 1,60 | -12,54 | 111,00 | -1,67 | 0,3610 | -0,0332 | |||
| WNS / WNS (Holdings) Limited | 1,66 | 105,13 | 0,3419 | 0,3419 | |||||
| LKQ / LKQ Corporation | 2,79 | 176,89 | 103,08 | 140,90 | 0,3352 | 0,1858 | |||
| JPM / JPMorgan Chase & Co. | 0,34 | 9,63 | 99,24 | 29,57 | 0,3227 | 0,0553 | |||
| CNO / CNO Financial Group, Inc. | 2,55 | -0,49 | 98,47 | -7,82 | 0,3159 | -0,0570 | |||
| RHI / Robert Half Inc. | 2,38 | 80,27 | 97,59 | 35,66 | 0,3131 | 0,0620 | |||
| GSCE / GS Connect S&P GSCI Enhanced Commodity Total Return ETN | 0,13 | -7,57 | 89,40 | 19,75 | 0,2868 | 0,0262 | |||
| WBS / Webster Financial Corporation | 1,61 | 1,49 | 88,06 | 7,49 | 0,2863 | 0,0003 | |||
| GD / General Dynamics Corporation | 0,29 | 4,67 | 85,03 | 12,00 | 0,2728 | 0,0077 | |||
| ELV / Elevance Health, Inc. | 0,22 | 8,11 | 84,51 | -3,33 | 0,2748 | -0,0304 | |||
| ADNT / Adient plc | 4,17 | 7,00 | 81,24 | 61,91 | 0,2606 | 0,0855 | |||
| SPB / Spectrum Brands Holdings, Inc. | 1,47 | 10,53 | 78,15 | -18,13 | 0,2507 | -0,0825 | |||
| OLN / Olin Corporation | 3,83 | 4,55 | 76,93 | -13,35 | 0,2468 | -0,0632 | |||
| HAL / Halliburton Company | 3,73 | 134,68 | 76,10 | 88,52 | 0,2442 | 0,1032 | |||
| WAB / Westinghouse Air Brake Technologies Corporation | 0,36 | 4,81 | 75,51 | 20,99 | 0,2455 | 0,0277 | |||
| GPC / Genuine Parts Company | 0,60 | 98,03 | 72,31 | 101,64 | 0,2320 | 0,1068 | |||
| MRC / MRC Global Inc. | 5,22 | -2,37 | 71,61 | 16,59 | 0,2298 | 0,0153 | |||
| UHS / Universal Health Services, Inc. | 0,39 | -0,02 | 70,96 | -3,62 | 0,2277 | -0,0294 | |||
| XOM / Exxon Mobil Corporation | 0,65 | 6,28 | 70,51 | -3,66 | 0,2262 | -0,0293 | |||
| DRH / DiamondRock Hospitality Company | 8,79 | 2,11 | 67,30 | 1,32 | 0,2159 | -0,0160 | |||
| PLOW / Douglas Dynamics, Inc. | 2,28 | 0,38 | 67,24 | 27,34 | 0,2157 | 0,0314 | |||
| HSIC / Henry Schein, Inc. | 0,92 | -4,71 | 67,22 | 1,63 | 0,2157 | -0,0152 | |||
| TRS / TriMas Corporation | 2,18 | 1,98 | 62,31 | 24,52 | 0,1999 | 0,0252 | |||
| AMWD / American Woodmark Corporation | 1,15 | 36,60 | 61,29 | 23,92 | 0,1966 | 0,0240 | |||
| SCS / Steelcase Inc. | 5,75 | 7,27 | 60,02 | 2,08 | 0,1926 | -0,0127 | |||
| KFY / Korn Ferry | 0,82 | 6,56 | 60,01 | 15,20 | 0,1951 | 0,0133 | |||
| OSK / Oshkosh Corporation | 0,53 | 59,71 | 0,1942 | 0,1942 | |||||
| REZI / Resideo Technologies, Inc. | 2,69 | 1,58 | 59,28 | 26,60 | 0,1902 | 0,0267 | |||
| ONB / Old National Bancorp | 2,70 | -6,24 | 57,53 | -5,58 | 0,1846 | -0,0281 | |||
| HUN / Huntsman Corporation | 5,31 | 9,30 | 55,34 | -27,87 | 0,1776 | -0,0903 | |||
| MBUU / Malibu Boats, Inc. | 1,67 | 8,87 | 52,37 | 11,21 | 0,1680 | 0,0036 | |||
| ARCO / Arcos Dorados Holdings Inc. | 6,53 | 51,55 | 0,1676 | 0,1676 | |||||
| NVST / Envista Holdings Corporation | 2,46 | 7,18 | 48,05 | 21,34 | 0,1542 | 0,0159 | |||
| OEC / Orion S.A. | 4,58 | 37,50 | 48,01 | 11,55 | 0,1541 | 0,0038 | |||
| SHG / Shinhan Financial Group Co., Ltd. - Depositary Receipt (Common Stock) | 1,03 | -4,73 | 46,43 | 34,17 | 0,1490 | 0,0281 | |||
| BFH / Bread Financial Holdings, Inc. | 0,80 | 9,88 | 45,70 | 25,33 | 0,1486 | 0,0213 | |||
| ABM / ABM Industries Incorporated | 0,96 | 13,48 | 45,51 | 13,12 | 0,1460 | 0,0056 | |||
| MBC / MasterBrand, Inc. | 4,15 | 45,30 | 45,41 | 21,60 | 0,1457 | 0,0153 | |||
| ASB / Associated Banc-Corp | 1,86 | 4,01 | 45,35 | 12,60 | 0,1455 | 0,0049 | |||
| SHYF / The Shyft Group, Inc. | 3,58 | 16,05 | 44,89 | 79,88 | 0,1440 | 0,0569 | |||
| HDB / HDFC Bank Limited - Depositary Receipt (Common Stock) | 0,58 | 13,76 | 44,74 | 31,28 | 0,1455 | 0,0265 | |||
| RF / Regions Financial Corporation | 1,90 | 0,00 | 44,67 | 8,24 | 0,1433 | -0,0008 | |||
| WSFS / WSFS Financial Corporation | 0,81 | 2,97 | 44,61 | 9,18 | 0,1431 | 0,0005 | |||
| WCC / WESCO International, Inc. | 0,23 | 0,00 | 42,38 | 19,25 | 0,1360 | 0,0119 | |||
| TFX / Teleflex Incorporated | 0,36 | 42,15 | 0,1371 | 0,1371 | |||||
| CBRE / CBRE Group, Inc. | 0,30 | -26,86 | 41,37 | -21,63 | 0,1327 | -0,0516 | |||
| SCSC / ScanSource, Inc. | 0,98 | 3,56 | 40,79 | 27,31 | 0,1326 | 0,0208 | |||
| KOP / Koppers Holdings Inc. | 1,25 | 2,19 | 40,12 | 17,33 | 0,1287 | 0,0093 | |||
| MSM / MSC Industrial Direct Co., Inc. | 0,46 | 0,00 | 39,27 | 9,46 | 0,1260 | 0,0007 | |||
| FITB / Fifth Third Bancorp | 0,95 | 0,06 | 39,13 | 4,99 | 0,1256 | -0,0046 | |||
| LDOS / Leidos Holdings, Inc. | 0,24 | 5,44 | 38,54 | 23,27 | 0,1237 | 0,0145 | |||
| HCA / HCA Healthcare, Inc. | 0,10 | -12,41 | 38,30 | -2,89 | 0,1229 | -0,0148 | |||
| JNJ / Johnson & Johnson | 0,25 | 4,46 | 37,62 | -3,78 | 0,1207 | -0,0158 | |||
| VREX / Varex Imaging Corporation | 4,24 | 11,64 | 36,80 | -16,56 | 0,1181 | -0,0359 | |||
| AIG / American International Group, Inc. | 0,43 | -12,03 | 36,75 | -13,40 | 0,1179 | -0,0302 | |||
| USNA / USANA Health Sciences, Inc. | 1,20 | 9,41 | 36,58 | 23,85 | 0,1174 | 0,0142 | |||
| TGT / Target Corporation | 0,37 | 6,28 | 36,19 | 0,47 | 0,1161 | -0,0096 | |||
| COLB / Columbia Banking System, Inc. | 1,54 | 8,57 | 36,04 | 1,78 | 0,1156 | -0,0080 | |||
| HR / Healthcare Realty Trust Incorporated | 2,23 | 0,00 | 35,30 | -6,15 | 0,1133 | -0,0181 | |||
| SNV / Synovus Financial Corp. | 0,68 | 1,72 | 35,21 | 12,63 | 0,1130 | 0,0038 | |||
| G / Genpact Limited | 0,73 | 0,00 | 32,22 | -12,64 | 0,1034 | -0,0254 | |||
| HVT / Haverty Furniture Companies, Inc. | 1,56 | 61,53 | 31,76 | 66,69 | 0,1033 | 0,0368 | |||
| UVV / Universal Corporation | 0,50 | -45,50 | 28,94 | -43,37 | 0,0929 | -0,0856 | |||
| KEY / KeyCorp | 1,65 | 0,22 | 28,72 | 9,18 | 0,0921 | 0,0003 | |||
| GCO / Genesco Inc. | 1,43 | 44,42 | 28,22 | 33,95 | 0,0905 | 0,0170 | |||
| ARW / Arrow Electronics, Inc. | 0,22 | 0,00 | 28,19 | 22,73 | 0,0905 | 0,0103 | |||
| HELE / Helen of Troy Limited | 0,99 | 30,30 | 27,96 | -30,87 | 0,0897 | -0,0515 | |||
| UVSP / Univest Financial Corporation | 0,89 | -22,30 | 26,68 | -17,70 | 0,0856 | -0,0276 | |||
| CMA / Comerica Incorporated | 0,42 | 0,00 | 25,21 | 1,00 | 0,0809 | -0,0063 | |||
| ABEV / Ambev S.A. - Depositary Receipt (Common Stock) | 10,32 | -25,47 | 24,86 | -22,91 | 0,0798 | -0,0328 | |||
| CHRW / C.H. Robinson Worldwide, Inc. | 0,25 | -6,33 | 24,10 | -12,23 | 0,0784 | -0,0175 | |||
| BIDU / Baidu, Inc. - Depositary Receipt (Common Stock) | 0,28 | -0,06 | 23,71 | -6,87 | 0,0771 | -0,0118 | |||
| FMC / FMC Corporation | 0,56 | 0,08 | 23,44 | -0,96 | 0,0752 | -0,0074 | |||
| TBI / TrueBlue, Inc. | 2,92 | 2,97 | 18,92 | 25,65 | 0,0607 | 0,0081 | |||
| MMI / Marcus & Millichap, Inc. | 0,61 | 6,62 | 18,87 | -4,95 | 0,0605 | -0,0088 | |||
| HOFT / Hooker Furnishings Corporation | 1,36 | 2,23 | 14,38 | 7,73 | 0,0461 | -0,0005 | |||
| MAN / ManpowerGroup Inc. | 0,35 | 0,00 | 14,19 | -30,20 | 0,0455 | -0,0254 | |||
| FNF / Fidelity National Financial, Inc. | 0,22 | -4,78 | 12,52 | -17,98 | 0,0402 | -0,0131 | |||
| TSM / Taiwan Semiconductor Manufacturing Company Limited - Depositary Receipt (Common Stock) | 0,04 | 2,48 | 9,64 | 39,83 | 0,0313 | 0,0073 | |||
| BABA / Alibaba Group Holding Limited - Depositary Receipt (Common Stock) | 0,05 | 0,50 | 6,05 | -13,80 | 0,0194 | -0,0051 | |||
| KB / KB Financial Group Inc. - Depositary Receipt (Common Stock) | 0,04 | -17,38 | 3,44 | 26,10 | 0,0110 | 0,0015 | |||
| CIG / Companhia Energética de Minas Gerais - CEMIG - Depositary Receipt (Common Stock) | 1,59 | 0,30 | 3,11 | 11,70 | 0,0100 | 0,0003 | |||
| ITUB / Itaú Unibanco Holding S.A. - Depositary Receipt (Common Stock) | 0,41 | 0,00 | 2,78 | 23,49 | 0,0089 | 0,0011 | |||
| VALE / Vale S.A. - Depositary Receipt (Common Stock) | 0,29 | 0,00 | 2,78 | -2,73 | 0,0089 | -0,0011 | |||
| DAN / Dana Incorporated | 0,16 | -89,53 | 2,70 | -86,53 | 0,0087 | -0,0613 | |||
| PBR.A / Petróleo Brasileiro S.A. - Petrobras - Depositary Receipt (Common Stock) | 0,23 | 19,55 | 2,66 | 5,81 | 0,0085 | -0,0002 | |||
| ING / ING Groep N.V. - Depositary Receipt (Common Stock) | 0,06 | 11,47 | 1,23 | 24,49 | 0,0039 | 0,0005 | |||
| BCS / Barclays PLC - Depositary Receipt (Common Stock) | 0,06 | 8,95 | 1,20 | 31,87 | 0,0039 | 0,0007 | |||
| MT / ArcelorMittal S.A. - Depositary Receipt (Common Stock) | 0,04 | 10,48 | 1,18 | 20,92 | 0,0038 | 0,0004 | |||
| HSBC / HSBC Holdings plc - Depositary Receipt (Common Stock) | 0,02 | 6,04 | 1,15 | 12,25 | 0,0037 | 0,0002 | |||
| PHG / Koninklijke Philips N.V. - Depositary Receipt (Common Stock) | 0,02 | 33,52 | 0,50 | 26,07 | 0,0016 | 0,0002 | |||
| SMFG / Sumitomo Mitsui Financial Group, Inc. - Depositary Receipt (Common Stock) | 0,02 | 8,67 | 0,36 | 6,14 | 0,0012 | -0,0000 | |||
| NWG / NatWest Group plc - Depositary Receipt (Common Stock) | 0,02 | -45,10 | 0,34 | -34,86 | 0,0011 | -0,0007 | |||
| EQNR / Equinor ASA - Depositary Receipt (Common Stock) | 0,01 | 44,32 | 0,34 | 37,55 | 0,0011 | 0,0002 | |||
| IBN / ICICI Bank Limited - Depositary Receipt (Common Stock) | 0,01 | -48,94 | 0,34 | -45,53 | 0,0011 | -0,0011 | |||
| DIS / The Walt Disney Company | 0,00 | 0,00 | 0,32 | 25,50 | 0,0010 | 0,0001 | |||
| GSK / GSK plc - Depositary Receipt (Common Stock) | 0,01 | 0,29 | 0,0009 | 0,0009 | |||||
| CALM / Cal-Maine Foods, Inc. | 0,00 | 0,28 | 0,0009 | 0,0009 | |||||
| INTC / Intel Corporation | 0,01 | 0,00 | 0,28 | -1,08 | 0,0009 | -0,0001 | |||
| SNY / Sanofi - Depositary Receipt (Common Stock) | 0,01 | 3,62 | 0,27 | -9,73 | 0,0009 | -0,0002 | |||
| MRK / Merck & Co., Inc. | 0,00 | 0,26 | 0,0008 | 0,0008 | |||||
| ULTA / Ulta Beauty, Inc. | 0,00 | 0,25 | 0,0008 | 0,0008 | |||||
| CRUS / Cirrus Logic, Inc. | 0,00 | 0,00 | 0,24 | 4,76 | 0,0008 | -0,0000 | |||
| ADBE / Adobe Inc. | 0,00 | 0,23 | 0,0007 | 0,0007 | |||||
| HIG / The Hartford Insurance Group, Inc. | 0,00 | 0,22 | 0,0007 | 0,0007 | |||||
| ALKS / Alkermes plc | 0,01 | 0,21 | 0,0007 | 0,0007 | |||||
| DELL / Dell Technologies Inc. | 0,00 | 0,21 | 0,0007 | 0,0007 | |||||
| GILD / Gilead Sciences, Inc. | 0,00 | -100,00 | 0,00 | 0,0000 | |||||
| DFS / Discover Financial Services | 0,00 | -100,00 | 0,00 | 0,0000 | |||||
| EBAY / eBay Inc. | 0,00 | -100,00 | 0,00 | 0,0000 | |||||
| JELD / JELD-WEN Holding, Inc. | 0,00 | -100,00 | 0,00 | -100,00 | -0,2149 | ||||
| PAHC / Phibro Animal Health Corporation | 0,00 | -100,00 | 0,00 | 0,0000 | |||||
| COR / Cencora, Inc. | 0,00 | -100,00 | 0,00 | 0,0000 |