Statistiques de base
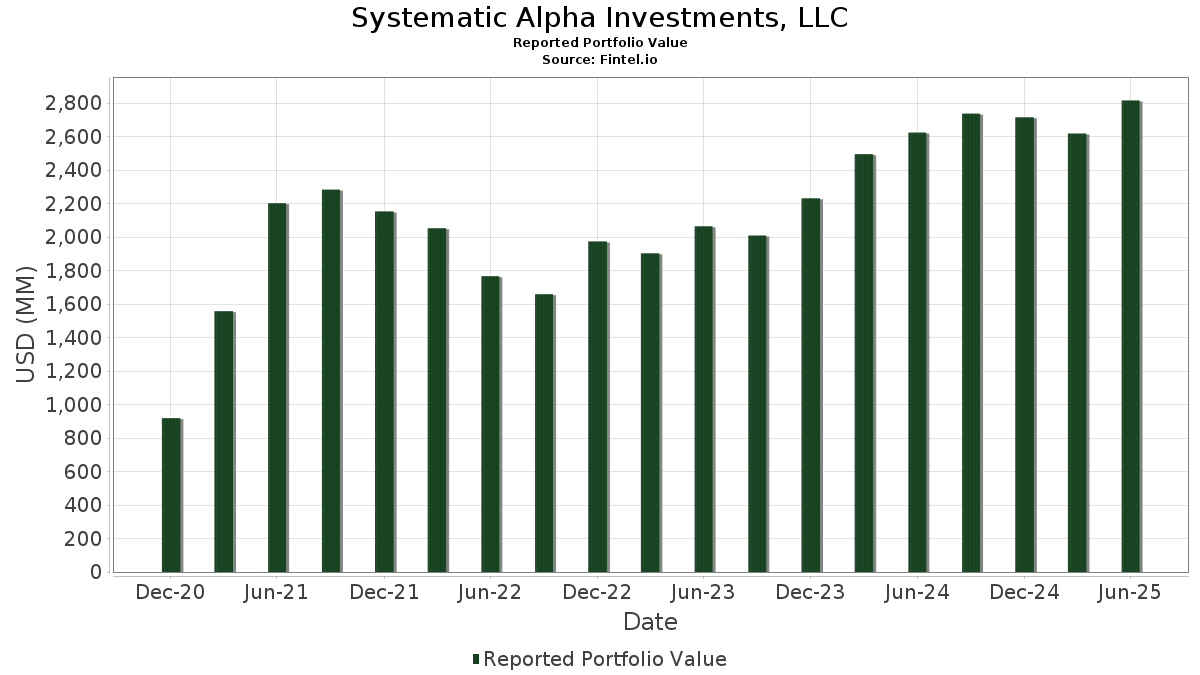
| Valeur du portefeuille | $ 2 815 262 445 |
| Positions actuelles | 230 |
Dernières positions, performances, ASG (à partir des dépôts 13F, 13D)
Systematic Alpha Investments, LLC a déclaré un total de 230 positions dans ses derniers dépôts auprès de la SEC. La valeur la plus récente du portefeuille est calculée à 2 815 262 445 USD. Les actifs sous gestion réels (ASG) sont cette valeur plus les liquidités (qui ne sont pas divulguées). Les principales positions de Systematic Alpha Investments, LLC sont Vanguard Index Funds - Vanguard S&P 500 ETF (US:VOO) , Eli Lilly and Company (US:LLY) , Vanguard Index Funds - Vanguard Value ETF (US:VTV) , NVIDIA Corporation (US:NVDA) , and Microsoft Corporation (US:MSFT) .
Meilleures augmentations ce trimestre
Nous utilisons la variation de l'allocation du portefeuille car il s'agit de l'indicateur le plus significatif. Les changements peuvent être dus à des transactions ou à des variations de prix des actions.
| Titre | Actions (en millions) |
Valeur ($ en millions) |
% du portefeuille | ΔPortefeuille % |
|---|---|---|---|---|
| 0,90 | 141,44 | 5,0239 | 1,3175 | |
| 0,25 | 125,05 | 4,4419 | 0,8367 | |
| 1,13 | 643,32 | 22,8511 | 0,6173 | |
| 0,07 | 54,23 | 1,9262 | 0,3086 | |
| 0,32 | 58,14 | 2,0653 | 0,3046 | |
| 0,07 | 19,33 | 0,6867 | 0,2381 | |
| 0,08 | 54,59 | 1,9390 | 0,2338 | |
| 0,02 | 22,45 | 0,7973 | 0,2002 | |
| 0,13 | 57,29 | 2,0349 | 0,1838 | |
| 0,23 | 49,47 | 1,7573 | 0,1183 |
Principales baisses ce trimestre
Nous utilisons la variation de l'allocation du portefeuille car il s'agit de l'indicateur le plus significatif. Les changements peuvent être dus à des transactions ou à des variations de prix des actions.
| Titre | Actions (en millions) |
Valeur ($ en millions) |
% du portefeuille | ΔPortefeuille % |
|---|---|---|---|---|
| 0,28 | 217,73 | 7,7337 | -1,0784 | |
| 0,58 | 118,21 | 4,1988 | -0,6901 | |
| 0,06 | 17,88 | 0,6352 | -0,5117 | |
| 0,89 | 158,16 | 5,6179 | -0,2871 | |
| 0,41 | 32,51 | 1,1548 | -0,2534 | |
| 0,30 | 13,72 | 0,4872 | -0,2031 | |
| 0,19 | 25,54 | 0,9072 | -0,2007 | |
| 0,10 | 28,05 | 0,9963 | -0,1493 | |
| 0,10 | 18,24 | 0,6480 | -0,1386 | |
| 0,08 | 18,29 | 0,6496 | -0,1324 |
Déclarations 13F et dépôts de fonds
Ce formulaire a été déposé le 2025-08-14 pour la période de déclaration 2025-06-30. Cliquez sur l'icône du lien pour voir l'historique complet des transactions.
Mettre à niveau pour débloquer les données premium et exporter vers Excel ![]() .
.
| Titre | Type | Prix moyen de l'action | Actions (en millions) |
ΔActions (%) |
ΔActions (%) |
Valeur ($ en millions) |
Portefeuille (%) |
ΔPortefeuille (%) |
|
|---|---|---|---|---|---|---|---|---|---|
| VOO / Vanguard Index Funds - Vanguard S&P 500 ETF | 1,13 | 0,00 | 643,32 | 10,53 | 22,8511 | 0,6173 | |||
| LLY / Eli Lilly and Company | 0,28 | 0,00 | 217,73 | -5,62 | 7,7337 | -1,0784 | |||
| VTV / Vanguard Index Funds - Vanguard Value ETF | 0,89 | 0,00 | 158,16 | 2,32 | 5,6179 | -0,2871 | |||
| NVDA / NVIDIA Corporation | 0,90 | 0,00 | 141,44 | 45,77 | 5,0239 | 1,3175 | |||
| MSFT / Microsoft Corporation | 0,25 | 0,00 | 125,05 | 32,51 | 4,4419 | 0,8367 | |||
| AAPL / Apple Inc. | 0,58 | 0,00 | 118,21 | -7,63 | 4,1988 | -0,6901 | |||
| VIG / Vanguard Specialized Funds - Vanguard Dividend Appreciation ETF | 0,35 | 0,00 | 72,25 | 5,51 | 2,5663 | -0,0496 | |||
| AMAT / Applied Materials, Inc. | 0,32 | 0,00 | 58,14 | 26,15 | 2,0653 | 0,3046 | |||
| TRV / The Travelers Companies, Inc. | 0,22 | 0,00 | 57,58 | 1,16 | 2,0452 | -0,1290 | |||
| VUG / Vanguard Index Funds - Vanguard Growth ETF | 0,13 | 0,00 | 57,29 | 18,23 | 2,0349 | 0,1838 | |||
| VGT / Vanguard World Fund - Vanguard Information Technology ETF | 0,08 | 0,00 | 54,59 | 22,29 | 1,9390 | 0,2338 | |||
| GOOGL / Alphabet Inc. | 0,31 | 0,00 | 54,38 | 13,96 | 1,9318 | 0,1088 | |||
| META / Meta Platforms, Inc. | 0,07 | 0,00 | 54,23 | 28,06 | 1,9262 | 0,3086 | |||
| AMZN / Amazon.com, Inc. | 0,23 | 0,00 | 49,47 | 15,31 | 1,7573 | 0,1183 | |||
| SPY / SPDR S&P 500 ETF | 0,08 | 0,00 | 46,44 | 10,45 | 1,6497 | 0,0434 | |||
| WM / Waste Management, Inc. | 0,15 | 0,00 | 34,14 | -1,16 | 1,2128 | -0,1068 | |||
| MA / Mastercard Incorporated | 0,06 | 0,00 | 33,65 | 2,52 | 1,1952 | -0,0586 | |||
| MRK / Merck & Co., Inc. | 0,41 | 0,00 | 32,51 | -11,81 | 1,1548 | -0,2534 | |||
| RZV / Invesco Exchange-Traded Fund Trust - Invesco S&P SmallCap 600 Pure Value ETF | 0,31 | 0,00 | 32,11 | 5,98 | 1,1406 | -0,0168 | |||
| GOOG / Alphabet Inc. | 0,16 | 0,00 | 28,16 | 13,54 | 1,0003 | 0,0529 | |||
| MCD / McDonald's Corporation | 0,10 | 0,00 | 28,05 | -6,47 | 0,9963 | -0,1493 | |||
| HD / The Home Depot, Inc. | 0,08 | 0,00 | 27,62 | 0,04 | 0,9809 | -0,0736 | |||
| ALL / The Allstate Corporation | 0,13 | 0,00 | 25,55 | -2,78 | 0,9077 | -0,0964 | |||
| PEP / PepsiCo, Inc. | 0,19 | 0,00 | 25,54 | -11,94 | 0,9072 | -0,2007 | |||
| MET / MetLife, Inc. | 0,28 | 0,00 | 22,56 | 0,16 | 0,8012 | -0,0591 | |||
| AEP / American Electric Power Company, Inc. | 0,22 | 0,00 | 22,52 | -5,04 | 0,7998 | -0,1060 | |||
| NFLX / Netflix, Inc. | 0,02 | 0,00 | 22,45 | 43,60 | 0,7973 | 0,2002 | |||
| CSCO / Cisco Systems, Inc. | 0,31 | 0,00 | 21,82 | 12,43 | 0,7752 | 0,0337 | |||
| UNP / Union Pacific Corporation | 0,09 | 0,00 | 21,48 | -2,61 | 0,7629 | -0,0795 | |||
| RTX / RTX Corporation | 0,13 | 0,00 | 19,59 | 10,24 | 0,6960 | 0,0170 | |||
| AVGO / Broadcom Inc. | 0,07 | 0,00 | 19,33 | 64,63 | 0,6867 | 0,2381 | |||
| TMUS / T-Mobile US, Inc. | 0,08 | 0,00 | 18,29 | -10,67 | 0,6496 | -0,1324 | |||
| ABBV / AbbVie Inc. | 0,10 | 0,00 | 18,24 | -11,41 | 0,6480 | -0,1386 | |||
| UNH / UnitedHealth Group Incorporated | 0,06 | 0,00 | 17,88 | -40,43 | 0,6352 | -0,5117 | |||
| KMB / Kimberly-Clark Corporation | 0,13 | 0,00 | 17,00 | -9,35 | 0,6038 | -0,1126 | |||
| SLF / Sun Life Financial Inc. | 0,25 | 0,00 | 16,67 | 16,05 | 0,5920 | 0,0434 | |||
| YUM / Yum! Brands, Inc. | 0,10 | 0,00 | 14,70 | -5,83 | 0,5223 | -0,0742 | |||
| ES / Eversource Energy | 0,23 | 0,00 | 14,39 | 2,43 | 0,5111 | -0,0255 | |||
| BMY / Bristol-Myers Squibb Company | 0,30 | 0,00 | 13,72 | -24,10 | 0,4872 | -0,2031 | |||
| VZ / Verizon Communications Inc. | 0,31 | 0,00 | 13,37 | -4,61 | 0,4748 | -0,0605 | |||
| AAMI / Acadian Asset Management Inc. | 0,37 | 0,00 | 13,04 | 36,28 | 0,4633 | 0,0977 | |||
| XLF / The Select Sector SPDR Trust - The Financial Select Sector SPDR Fund | 0,25 | 0,00 | 13,01 | 5,14 | 0,4621 | -0,0106 | |||
| MO / Altria Group, Inc. | 0,21 | 0,00 | 12,47 | -2,32 | 0,4428 | -0,0447 | |||
| AVY / Avery Dennison Corporation | 0,07 | 0,00 | 12,40 | -1,41 | 0,4403 | -0,0400 | |||
| KO / The Coca-Cola Company | 0,17 | 0,00 | 12,19 | -1,22 | 0,4330 | -0,0384 | |||
| TGT / Target Corporation | 0,11 | 0,00 | 11,32 | -5,48 | 0,4022 | -0,0554 | |||
| JPM / JPMorgan Chase & Co. | 0,04 | 0,00 | 10,67 | 18,18 | 0,3790 | 0,0341 | |||
| PFE / Pfizer Inc. | 0,42 | 0,00 | 10,29 | -4,34 | 0,3655 | -0,0454 | |||
| LRCX / Lam Research Corporation | 0,10 | 0,00 | 10,16 | 33,90 | 0,3609 | 0,0710 | |||
| TFC / Truist Financial Corporation | 0,23 | 0,00 | 10,06 | 4,47 | 0,3572 | -0,0105 | |||
| SLM / SLM Corporation | 0,28 | 0,00 | 9,11 | 11,64 | 0,3237 | 0,0119 | |||
| UL / Unilever PLC - Depositary Receipt (Common Stock) | 0,15 | 0,00 | 9,05 | 2,71 | 0,3213 | -0,0151 | |||
| TSLA / Tesla, Inc. | 0,03 | 0,00 | 8,65 | 22,58 | 0,3072 | 0,0377 | |||
| IWM / iShares Trust - iShares Russell 2000 ETF | 0,04 | 0,00 | 8,63 | 8,17 | 0,3066 | 0,0018 | |||
| AMD / Advanced Micro Devices, Inc. | 0,05 | 0,00 | 7,75 | 38,13 | 0,2753 | 0,0609 | |||
| AGG / iShares Trust - iShares Core U.S. Aggregate Bond ETF | 0,07 | 0,00 | 7,14 | 0,28 | 0,2537 | -0,0184 | |||
| EIX / Edison International | 0,13 | 0,00 | 6,72 | -12,43 | 0,2386 | -0,0544 | |||
| SPYG / SPDR Series Trust - SPDR Portfolio S&P 500 Growth ETF | 0,07 | 0,00 | 6,67 | 18,61 | 0,2370 | 0,0221 | |||
| SPYD / SPDR Series Trust - SPDR Portfolio S&P 500 High Dividend ETF | 0,15 | 0,00 | 6,26 | -4,10 | 0,2225 | -0,0271 | |||
| MCHP / Microchip Technology Incorporated | 0,08 | 0,00 | 5,56 | 45,37 | 0,1975 | 0,0514 | |||
| INTC / Intel Corporation | 0,22 | 0,00 | 4,82 | -1,37 | 0,1714 | -0,0155 | |||
| WMT / Walmart Inc. | 0,04 | 0,00 | 4,31 | 11,39 | 0,1532 | 0,0053 | |||
| CRM / Salesforce, Inc. | 0,02 | 0,00 | 4,26 | 1,62 | 0,1513 | -0,0088 | |||
| RCL / Royal Caribbean Cruises Ltd. | 0,01 | 0,00 | 4,14 | 52,43 | 0,1470 | 0,0433 | |||
| QCOM / QUALCOMM Incorporated | 0,02 | 0,00 | 3,56 | 3,70 | 0,1264 | -0,0047 | |||
| LDOS / Leidos Holdings, Inc. | 0,02 | 0,00 | 3,44 | 16,91 | 0,1221 | 0,0098 | |||
| BAC / Bank of America Corporation | 0,07 | 0,00 | 3,19 | 13,38 | 0,1135 | 0,0059 | |||
| ADBE / Adobe Inc. | 0,01 | 0,00 | 3,14 | 0,87 | 0,1116 | -0,0074 | |||
| V / Visa Inc. | 0,01 | 0,00 | 3,08 | 1,32 | 0,1094 | -0,0067 | |||
| BEN / Franklin Resources, Inc. | 0,13 | 0,00 | 3,01 | 23,88 | 0,1069 | 0,0141 | |||
| PBI / Pitney Bowes Inc. | 0,28 | 0,00 | 3,00 | 20,58 | 0,1066 | 0,0115 | |||
| SO / The Southern Company | 0,03 | 0,00 | 2,75 | -0,15 | 0,0979 | -0,0075 | |||
| PSA / Public Storage | 0,01 | 0,00 | 2,65 | -1,96 | 0,0941 | -0,0091 | |||
| MDT / Medtronic plc | 0,03 | 0,00 | 2,59 | -2,96 | 0,0920 | -0,0100 | |||
| MS / Morgan Stanley | 0,02 | 0,00 | 2,44 | 20,73 | 0,0867 | 0,0095 | |||
| ORLY / O'Reilly Automotive, Inc. | 0,03 | 1 400,00 | 2,43 | -5,62 | 0,0864 | -0,0121 | |||
| ANET / Arista Networks Inc | 0,02 | 0,00 | 2,38 | 32,10 | 0,0847 | 0,0157 | |||
| BSX / Boston Scientific Corporation | 0,02 | 0,00 | 2,34 | 6,47 | 0,0830 | -0,0008 | |||
| FCX / Freeport-McMoRan Inc. | 0,05 | 0,00 | 2,30 | 14,51 | 0,0819 | 0,0050 | |||
| GS / The Goldman Sachs Group, Inc. | 0,00 | 0,00 | 2,26 | 29,59 | 0,0803 | 0,0136 | |||
| CVX / Chevron Corporation | 0,01 | 0,00 | 2,13 | -14,41 | 0,0756 | -0,0194 | |||
| BA / The Boeing Company | 0,01 | 0,00 | 2,10 | 22,91 | 0,0747 | 0,0093 | |||
| IVZ / Invesco Ltd. | 0,13 | 0,00 | 1,99 | 3,97 | 0,0707 | -0,0024 | |||
| CARR / Carrier Global Corporation | 0,03 | 0,00 | 1,89 | 15,41 | 0,0670 | 0,0046 | |||
| CBRE / CBRE Group, Inc. | 0,01 | 0,00 | 1,85 | 7,11 | 0,0658 | -0,0002 | |||
| QQQ / Invesco QQQ Trust, Series 1 | 0,00 | 0,00 | 1,73 | 17,66 | 0,0613 | 0,0053 | |||
| MAR / Marriott International, Inc. | 0,01 | 0,00 | 1,68 | 14,70 | 0,0596 | 0,0037 | |||
| FANG / Diamondback Energy, Inc. | 0,01 | 0,00 | 1,65 | -14,06 | 0,0586 | -0,0147 | |||
| OTIS / Otis Worldwide Corporation | 0,01 | 0,00 | 1,45 | -4,05 | 0,0514 | -0,0062 | |||
| HSBC / HSBC Holdings plc - Depositary Receipt (Common Stock) | 0,02 | 0,00 | 1,40 | 5,91 | 0,0497 | -0,0008 | |||
| PHM / PulteGroup, Inc. | 0,01 | 0,00 | 1,38 | 2,60 | 0,0490 | -0,0024 | |||
| BRC / Brady Corporation | 0,02 | 0,00 | 1,37 | -3,79 | 0,0488 | -0,0057 | |||
| VFC / V.F. Corporation | 0,12 | 0,00 | 1,37 | -24,28 | 0,0487 | -0,0205 | |||
| KR / The Kroger Co. | 0,02 | 0,00 | 1,35 | 5,97 | 0,0480 | -0,0007 | |||
| HPQ / HP Inc. | 0,05 | 0,00 | 1,30 | -11,66 | 0,0460 | -0,0100 | |||
| NOW / ServiceNow, Inc. | 0,00 | 0,00 | 1,28 | 29,23 | 0,0455 | 0,0076 | |||
| URI / United Rentals, Inc. | 0,00 | 0,00 | 1,26 | 20,21 | 0,0448 | 0,0047 | |||
| CMG / Chipotle Mexican Grill, Inc. | 0,02 | 0,00 | 1,21 | 11,81 | 0,0431 | 0,0017 | |||
| LEN / Lennar Corporation | 0,01 | 0,00 | 1,19 | -3,66 | 0,0422 | -0,0049 | |||
| FTNT / Fortinet, Inc. | 0,01 | 0,01 | 1,10 | 9,83 | 0,0389 | 0,0008 | |||
| GE / General Electric Company | 0,00 | 0,00 | 1,09 | 28,62 | 0,0388 | 0,0064 | |||
| SNPS / Synopsys, Inc. | 0,00 | 0,00 | 1,05 | 19,55 | 0,0374 | 0,0038 | |||
| MPC / Marathon Petroleum Corporation | 0,01 | 0,00 | 1,05 | 13,91 | 0,0373 | 0,0021 | |||
| WDC / Western Digital Corporation | 0,02 | 0,00 | 1,02 | 58,36 | 0,0364 | 0,0117 | |||
| MGM / MGM Resorts International | 0,03 | 0,00 | 1,01 | 16,03 | 0,0358 | 0,0026 | |||
| ALGN / Align Technology, Inc. | 0,01 | 0,00 | 1,00 | 19,26 | 0,0354 | 0,0035 | |||
| TSM / Taiwan Semiconductor Manufacturing Company Limited - Depositary Receipt (Common Stock) | 0,00 | 0,00 | 1,00 | 36,44 | 0,0354 | 0,0075 | |||
| KLAC / KLA Corporation | 0,00 | 0,00 | 0,95 | 31,76 | 0,0338 | 0,0062 | |||
| PWR / Quanta Services, Inc. | 0,00 | 0,00 | 0,94 | 48,82 | 0,0335 | 0,0093 | |||
| CPRT / Copart, Inc. | 0,02 | 0,00 | 0,93 | -13,33 | 0,0331 | -0,0079 | |||
| SFM / Sprouts Farmers Market, Inc. | 0,01 | 0,00 | 0,92 | 7,88 | 0,0326 | 0,0001 | |||
| BKR / Baker Hughes Company | 0,02 | 0,00 | 0,92 | -12,76 | 0,0326 | -0,0076 | |||
| BC94 / Samsung Electronics Co., Ltd. - Depositary Receipt (Common Stock) | 0,00 | 0,00 | 0,89 | 12,87 | 0,0315 | 0,0015 | |||
| APA / APA Corporation | 0,05 | 0,00 | 0,88 | -13,08 | 0,0312 | -0,0074 | |||
| RJF / Raymond James Financial, Inc. | 0,01 | 0,00 | 0,87 | 10,49 | 0,0311 | 0,0008 | |||
| F / Ford Motor Company | 0,08 | 0,00 | 0,87 | 8,24 | 0,0308 | 0,0002 | |||
| NOC / Northrop Grumman Corporation | 0,00 | 0,00 | 0,85 | -2,41 | 0,0302 | -0,0031 | |||
| BABA / Alibaba Group Holding Limited - Depositary Receipt (Common Stock) | 0,01 | 0,00 | 0,81 | -14,18 | 0,0286 | -0,0073 | |||
| PH / Parker-Hannifin Corporation | 0,00 | 0,00 | 0,78 | 15,00 | 0,0278 | 0,0018 | |||
| CDNS / Cadence Design Systems, Inc. | 0,00 | 0,00 | 0,77 | 21,10 | 0,0273 | 0,0031 | |||
| TER / Teradyne, Inc. | 0,01 | 0,00 | 0,76 | 8,83 | 0,0271 | 0,0003 | |||
| FCFS / FirstCash Holdings, Inc. | 0,01 | 0,00 | 0,74 | 12,41 | 0,0264 | 0,0011 | |||
| SLB / Schlumberger Limited | 0,02 | 0,00 | 0,72 | -19,11 | 0,0257 | -0,0085 | |||
| LNC / Lincoln National Corporation | 0,02 | 0,00 | 0,72 | -3,63 | 0,0255 | -0,0030 | |||
| NWSA / News Corporation | 0,02 | 0,00 | 0,71 | 9,13 | 0,0251 | 0,0004 | |||
| RF / Regions Financial Corporation | 0,03 | 0,00 | 0,70 | 8,24 | 0,0247 | 0,0002 | |||
| HES / Hess Corporation | 0,00 | 0,00 | 0,69 | -13,33 | 0,0245 | -0,0059 | |||
| PYPL / PayPal Holdings, Inc. | 0,01 | 0,00 | 0,68 | 13,88 | 0,0242 | 0,0014 | |||
| TGLS / Tecnoglass Inc. | 0,01 | 0,00 | 0,68 | 8,11 | 0,0242 | 0,0001 | |||
| TOL / Toll Brothers, Inc. | 0,01 | 0,00 | 0,67 | 8,20 | 0,0239 | 0,0001 | |||
| MCK / McKesson Corporation | 0,00 | 0,00 | 0,66 | 8,93 | 0,0234 | 0,0003 | |||
| BRK.B / Berkshire Hathaway Inc. | 0,00 | 0,00 | 0,65 | -8,80 | 0,0232 | -0,0042 | |||
| SDY / SPDR Series Trust - SPDR S&P Dividend ETF | 0,00 | 0,00 | 0,65 | 0,00 | 0,0231 | -0,0017 | |||
| XOM / Exxon Mobil Corporation | 0,01 | 0,00 | 0,65 | -9,33 | 0,0231 | -0,0043 | |||
| HLT / Hilton Worldwide Holdings Inc. | 0,00 | 0,00 | 0,65 | 17,15 | 0,0231 | 0,0019 | |||
| ALSN / Allison Transmission Holdings, Inc. | 0,01 | 0,00 | 0,63 | -0,79 | 0,0223 | -0,0019 | |||
| IBM / International Business Machines Corporation | 0,00 | 0,00 | 0,60 | 18,54 | 0,0214 | 0,0020 | |||
| ABCB / Ameris Bancorp | 0,01 | 0,00 | 0,59 | 12,43 | 0,0209 | 0,0009 | |||
| DIS / The Walt Disney Company | 0,00 | 0,00 | 0,59 | 25,75 | 0,0208 | 0,0030 | |||
| ACIW / ACI Worldwide, Inc. | 0,01 | 0,00 | 0,58 | -16,11 | 0,0205 | -0,0058 | |||
| MGY / Magnolia Oil & Gas Corporation | 0,03 | 0,00 | 0,57 | -11,08 | 0,0203 | -0,0042 | |||
| EBAY / eBay Inc. | 0,01 | 0,00 | 0,56 | 9,94 | 0,0200 | 0,0004 | |||
| ISRG / Intuitive Surgical, Inc. | 0,00 | 0,00 | 0,56 | 9,82 | 0,0199 | 0,0004 | |||
| IX / ORIX Corporation - Depositary Receipt (Common Stock) | 0,02 | 0,00 | 0,56 | 7,72 | 0,0198 | 0,0000 | |||
| CE / Celanese Corporation | 0,01 | 0,00 | 0,55 | -2,47 | 0,0197 | -0,0020 | |||
| CTVA / Corteva, Inc. | 0,01 | 0,00 | 0,55 | 18,49 | 0,0196 | 0,0018 | |||
| CHE / Chemed Corporation | 0,00 | 0,00 | 0,54 | -20,86 | 0,0190 | -0,0068 | |||
| CI / The Cigna Group | 0,00 | 0,00 | 0,52 | 0,38 | 0,0186 | -0,0013 | |||
| GEN / Gen Digital Inc. | 0,02 | 0,00 | 0,52 | 10,83 | 0,0186 | 0,0005 | |||
| NEM / Newmont Corporation | 0,01 | 0,00 | 0,52 | 20,61 | 0,0183 | 0,0020 | |||
| VWO / Vanguard International Equity Index Funds - Vanguard FTSE Emerging Markets ETF | 0,01 | 0,00 | 0,50 | 9,41 | 0,0178 | 0,0003 | |||
| CRS / Carpenter Technology Corporation | 0,00 | 0,00 | 0,50 | 52,45 | 0,0177 | 0,0052 | |||
| EEM / iShares, Inc. - iShares MSCI Emerging Markets ETF | 0,01 | 0,00 | 0,48 | 10,53 | 0,0172 | 0,0004 | |||
| VTRS / Viatris Inc. | 0,05 | 0,00 | 0,47 | 2,40 | 0,0167 | -0,0008 | |||
| SKM / SK Telecom Co., Ltd. - Depositary Receipt (Common Stock) | 0,02 | 0,00 | 0,46 | 9,69 | 0,0165 | 0,0003 | |||
| COF / Capital One Financial Corporation | 0,00 | 0,00 | 0,46 | 18,67 | 0,0165 | 0,0015 | |||
| NUE / Nucor Corporation | 0,00 | 0,00 | 0,43 | 7,77 | 0,0153 | 0,0000 | |||
| DOX / Amdocs Limited | 0,00 | 0,00 | 0,43 | -0,47 | 0,0152 | -0,0012 | |||
| LRN / Stride, Inc. | 0,00 | 0,00 | 0,43 | 14,75 | 0,0152 | 0,0010 | |||
| WBS / Webster Financial Corporation | 0,01 | 0,00 | 0,43 | 5,99 | 0,0151 | -0,0002 | |||
| MOS / The Mosaic Company | 0,01 | 0,00 | 0,42 | 35,03 | 0,0151 | 0,0031 | |||
| WBA / Walgreens Boots Alliance, Inc. | 0,04 | 0,00 | 0,42 | 2,71 | 0,0148 | -0,0007 | |||
| COP / ConocoPhillips | 0,00 | 0,00 | 0,41 | -14,67 | 0,0147 | -0,0038 | |||
| JCI / Johnson Controls International plc | 0,00 | 0,00 | 0,41 | 31,63 | 0,0147 | 0,0027 | |||
| NSIT / Insight Enterprises, Inc. | 0,00 | 0,00 | 0,41 | -7,92 | 0,0145 | -0,0024 | |||
| STT / State Street Corporation | 0,00 | 0,00 | 0,40 | 18,53 | 0,0143 | 0,0014 | |||
| UAL / United Airlines Holdings, Inc. | 0,01 | 0,00 | 0,40 | 15,23 | 0,0143 | 0,0010 | |||
| OGN / Organon & Co. | 0,04 | 0,00 | 0,40 | -35,02 | 0,0141 | -0,0092 | |||
| NWS / News Corporation | 0,01 | 0,00 | 0,39 | 12,89 | 0,0140 | 0,0007 | |||
| AMT / American Tower Corporation | 0,00 | 0,00 | 0,39 | 1,57 | 0,0138 | -0,0008 | |||
| KKR / KKR & Co. Inc. | 0,00 | 0,00 | 0,38 | 15,15 | 0,0135 | 0,0009 | |||
| IBN / ICICI Bank Limited - Depositary Receipt (Common Stock) | 0,01 | 0,00 | 0,38 | 6,74 | 0,0135 | -0,0001 | |||
| ETSY / Etsy, Inc. | 0,01 | 0,00 | 0,38 | 6,20 | 0,0134 | -0,0002 | |||
| ADI / Analog Devices, Inc. | 0,00 | 0,00 | 0,37 | 17,72 | 0,0132 | 0,0012 | |||
| ELV / Elevance Health, Inc. | 0,00 | 0,00 | 0,37 | -10,46 | 0,0131 | -0,0027 | |||
| C / Citigroup Inc. | 0,00 | 0,00 | 0,36 | 20,00 | 0,0128 | 0,0013 | |||
| SWK / Stanley Black & Decker, Inc. | 0,01 | 0,00 | 0,36 | -12,07 | 0,0127 | -0,0028 | |||
| IVV / iShares Trust - iShares Core S&P 500 ETF | 0,00 | 0,00 | 0,34 | 10,49 | 0,0120 | 0,0003 | |||
| PGR / The Progressive Corporation | 0,00 | 0,00 | 0,34 | -5,63 | 0,0119 | -0,0017 | |||
| CNC / Centene Corporation | 0,01 | 0,00 | 0,33 | -10,75 | 0,0118 | -0,0024 | |||
| EA / Electronic Arts Inc. | 0,00 | 0,00 | 0,32 | 10,65 | 0,0115 | 0,0003 | |||
| UFPI / UFP Industries, Inc. | 0,00 | 0,00 | 0,32 | -7,31 | 0,0113 | -0,0018 | |||
| DVN / Devon Energy Corporation | 0,01 | 0,00 | 0,32 | -14,86 | 0,0112 | -0,0030 | |||
| BBWI / Bath & Body Works, Inc. | 0,01 | 0,00 | 0,31 | -1,27 | 0,0110 | -0,0010 | |||
| EXPE / Expedia Group, Inc. | 0,00 | 0,00 | 0,31 | 0,32 | 0,0110 | -0,0008 | |||
| PLMR / Palomar Holdings, Inc. | 0,00 | 0,00 | 0,31 | 12,41 | 0,0110 | 0,0005 | |||
| MU / Micron Technology, Inc. | 0,00 | 0,00 | 0,30 | 42,25 | 0,0108 | 0,0026 | |||
| HMY / Harmony Gold Mining Company Limited - Depositary Receipt (Common Stock) | 0,02 | 0,00 | 0,30 | -5,64 | 0,0107 | -0,0015 | |||
| DRI / Darden Restaurants, Inc. | 0,00 | 0,00 | 0,30 | 4,90 | 0,0107 | -0,0003 | |||
| KB / KB Financial Group Inc. - Depositary Receipt (Common Stock) | 0,00 | 0,30 | 0,0106 | 0,0106 | |||||
| IR / Ingersoll Rand Inc. | 0,00 | 0,00 | 0,30 | 3,86 | 0,0105 | -0,0004 | |||
| CPB / The Campbell's Company | 0,01 | 0,00 | 0,29 | -23,22 | 0,0103 | -0,0041 | |||
| GM / General Motors Company | 0,01 | 0,00 | 0,29 | 4,38 | 0,0102 | -0,0003 | |||
| LPLA / LPL Financial Holdings Inc. | 0,00 | 0,00 | 0,28 | 14,52 | 0,0101 | 0,0006 | |||
| HCA / HCA Healthcare, Inc. | 0,00 | 0,00 | 0,28 | 10,59 | 0,0100 | 0,0003 | |||
| TMO / Thermo Fisher Scientific Inc. | 0,00 | 0,00 | 0,28 | -18,50 | 0,0100 | -0,0032 | |||
| HAL / Halliburton Company | 0,01 | 0,00 | 0,28 | -19,71 | 0,0100 | -0,0034 | |||
| LYV / Live Nation Entertainment, Inc. | 0,00 | 0,00 | 0,28 | 15,77 | 0,0099 | 0,0007 | |||
| NWL / Newell Brands Inc. | 0,05 | 0,00 | 0,27 | -12,90 | 0,0096 | -0,0023 | |||
| MHO / M/I Homes, Inc. | 0,00 | 0,00 | 0,27 | -1,82 | 0,0096 | -0,0009 | |||
| LIN / Linde plc | 0,00 | 0,00 | 0,26 | 0,76 | 0,0094 | -0,0006 | |||
| PAYC / Paycom Software, Inc. | 0,00 | 0,00 | 0,26 | 6,05 | 0,0093 | -0,0001 | |||
| NCLH / Norwegian Cruise Line Holdings Ltd. | 0,01 | 0,00 | 0,26 | 7,08 | 0,0092 | -0,0000 | |||
| KEY / KeyCorp | 0,01 | 0,00 | 0,25 | 9,01 | 0,0090 | 0,0001 | |||
| FTI / TechnipFMC plc | 0,01 | 0,00 | 0,25 | 8,85 | 0,0088 | 0,0001 | |||
| BKZHY / Santander Bank Polska S.A. - Depositary Receipt (Common Stock) | 0,01 | 0,00 | 0,25 | -4,67 | 0,0087 | -0,0011 | |||
| BLK / BlackRock, Inc. | 0,00 | 0,00 | 0,24 | 11,06 | 0,0086 | 0,0003 | |||
| SPGI / S&P Global Inc. | 0,00 | 0,00 | 0,24 | 3,93 | 0,0085 | -0,0003 | |||
| DXC / DXC Technology Company | 0,02 | 0,00 | 0,24 | -10,19 | 0,0085 | -0,0017 | |||
| DHR / Danaher Corporation | 0,00 | 0,00 | 0,24 | -3,64 | 0,0085 | -0,0010 | |||
| HLIT / Harmonic Inc. | 0,03 | 0,00 | 0,24 | -1,25 | 0,0084 | -0,0008 | |||
| LTH / Life Time Group Holdings, Inc. | 0,01 | 0,00 | 0,23 | 0,44 | 0,0081 | -0,0006 | |||
| MOD / Modine Manufacturing Company | 0,00 | 0,23 | 0,0080 | 0,0080 | |||||
| FLR / Fluor Corporation | 0,00 | 0,23 | 0,0080 | 0,0080 | |||||
| SYF / Synchrony Financial | 0,00 | 0,22 | 0,0077 | 0,0077 | |||||
| PVH / PVH Corp. | 0,00 | 0,00 | 0,22 | 6,37 | 0,0077 | -0,0001 | |||
| TBBK / The Bancorp, Inc. | 0,00 | 0,00 | 0,22 | 8,00 | 0,0077 | 0,0000 | |||
| GSHD / Goosehead Insurance, Inc | 0,00 | 0,00 | 0,21 | -10,59 | 0,0075 | -0,0015 | |||
| EW / Edwards Lifesciences Corporation | 0,00 | 0,21 | 0,0074 | 0,0074 | |||||
| MCO / Moody's Corporation | 0,00 | 0,21 | 0,0074 | 0,0074 | |||||
| PM / Philip Morris International Inc. | 0,00 | 0,21 | 0,0073 | 0,0073 | |||||
| WAB / Westinghouse Air Brake Technologies Corporation | 0,00 | 0,20 | 0,0072 | 0,0072 | |||||
| KD / Kyndryl Holdings, Inc. | 0,00 | 0,20 | 0,0072 | 0,0072 | |||||
| LOW / Lowe's Companies, Inc. | 0,00 | 0,00 | 0,20 | -4,76 | 0,0071 | -0,0009 | |||
| NMRK / Newmark Group, Inc. | 0,02 | 0,00 | 0,20 | -0,51 | 0,0070 | -0,0005 | |||
| IMMR / Immersion Corporation | 0,02 | 0,00 | 0,19 | 4,35 | 0,0068 | -0,0002 | |||
| PARA / Paramount Global | 0,01 | 0,13 | 0,0048 | 0,0048 | |||||
| LC / LendingClub Corporation | 0,01 | 0,12 | 0,0043 | 0,0043 | |||||
| CIG.C / Companhia Energética de Minas Gerais - CEMIG - Depositary Receipt (Common Stock) | 0,02 | 0,00 | 0,05 | 8,70 | 0,0018 | 0,0000 | |||
| BIGGQ / Big Lots, Inc. | 0,05 | 0,00 | 0,00 | -100,00 | 0,0000 | -0,0000 | |||
| OKE / ONEOK, Inc. | 0,00 | -100,00 | 0,00 | 0,0000 | |||||
| CCS / Century Communities, Inc. | 0,00 | -100,00 | 0,00 | 0,0000 | |||||
| DFS / Discover Financial Services | 0,00 | -100,00 | 0,00 | 0,0000 |