Statistiques de base
| Actions institutionnelles (Long) | 587 582 579 - 65,54% (ex 13D/G) - change of 53,50MM shares 10,02% MRQ |
| Valeur institutionnelle (Long) | $ 953 283 USD ($1000) |
Participation institutionnels et actionnaires
Denison Mines Corp. (US:DNN) détient 263 des propriétaires institutionnels et des actionnaires qui ont déposé des formulaires 13D/G ou 13F auprès de la Securities Exchange Commission (SEC). Ces institutions détiennent un total de 587,582,579 actions. Les principaux actionnaires incluent Alps Advisors Inc, Van Eck Associates Corp, MIRAE ASSET GLOBAL ETFS HOLDINGS Ltd., URA - Global X Uranium ETF, NLR - VanEck Vectors Uranium+Nuclear Energy ETF, Sprott Funds Trust - Sprott Uranium Miners Etf, Segra Capital Management, LLC, Hood River Capital Management LLC, SPROTT FUNDS TRUST - Sprott Junior Uranium Miners ETF, and HRSMX - Hood River Small-Cap Growth Fund Institutional Shares .
Denison Mines Corp. (NYSEAM:DNN) la structure de l'actionnariat institutionnel indique les positions actuelles des institutions et des fonds dans l'entreprise, ainsi que les derniers changements dans le volume des positions. Les principaux actionnaires peuvent être des investisseurs individuels, des fonds communs de placement, des fonds spéculatifs ou des institutions. L'annexe 13D indique que l'investisseur détient (ou a détenu) plus de 5 % de l'entreprise et qu'il a l'intention (ou a eu l'intention) de poursuivre activement un changement de stratégie commerciale. L'annexe 13G indique un investissement passif de plus de 5 %.
The share price as of September 8, 2025 is 2,38 / share. Previously, on September 9, 2024, the share price was 1,44 / share. This represents an increase of 65,28% over that period.

Indice de confiance des fonds
L'indice de confiance des fonds (anciennement score d'accumulation de participation) trouve les actions qui sont les plus achetées par les fonds. Il est le résultat d'un modèle quantitatif sophistiqué à plusieurs facteurs qui identifie les entreprises avec les niveaux les plus élevés d'accumulation institutionnelle. Le modèle de notation utilise une combinaison de l'augmentation totale des propriétaires déclarés, des variations des allocations de portefeuille chez ces propriétaires et d'autres indicateurs. Le chiffre varie de 0 à 100, les chiffres plus élevés indiquant un niveau d'accumulation plus élevé par rapport aux autres entreprises, 50 étant la moyenne.
Fréquence de mise à jour : Quotidienne
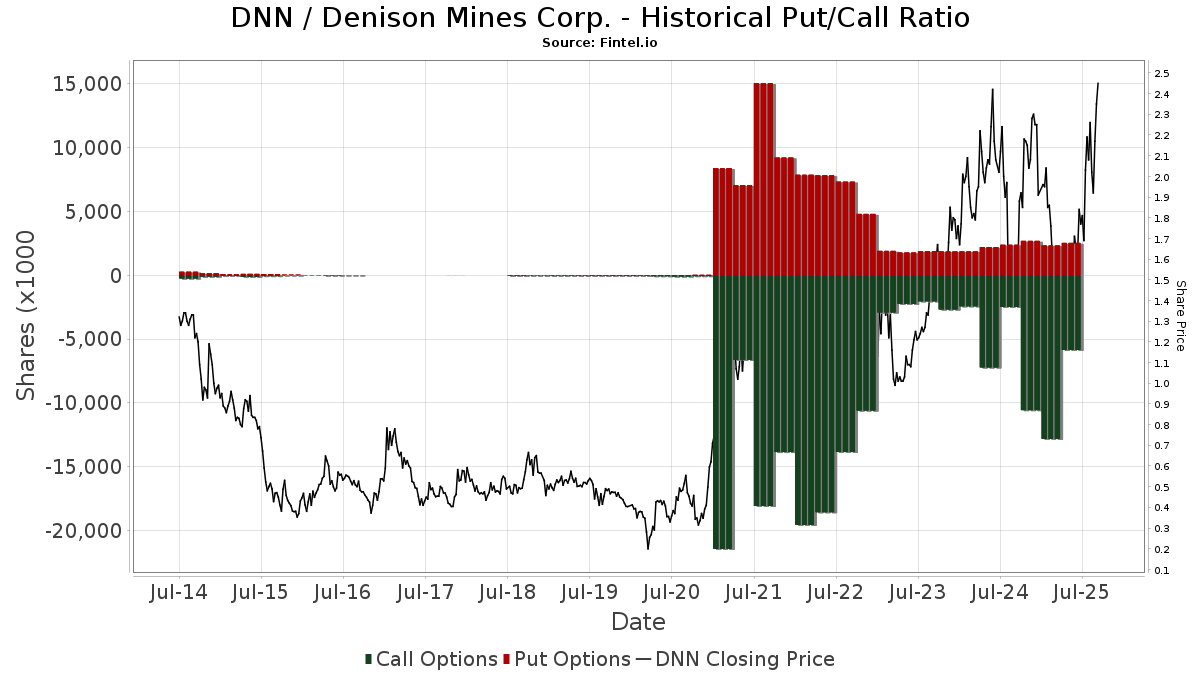
Ratio put/call institutionnel
En plus de signaler les actions et les dettes standard, les institutions ayant plus de 100 millions d'actifs sous gestion doivent également divulguer leurs positions en options de vente et d'achat. Étant donné que les options de vente indiquent généralement une confiance négative, et les options d'achat indiquent une confiance positive, nous pouvons avoir une idée de la confiance institutionnelle globale en traçant le ratio des ventes à découvert par rapport aux achats d'options. Le graphique à droite trace l'historique du ratio des ventes à découvert/achats d'options pour cet instrument.
L'utilisation du ratio put/call comme indicateur de la confiance des investisseurs permet de pallier à l'une des principales lacunes de l'utilisation de la participation institutionnelle totale, à savoir qu'une part importante des actifs sous gestion est investie passivement pour suivre les indices. Les fonds gérés passivement n'achètent généralement pas d'options, de sorte que l'indicateur du ratio put/call suit de plus près la confiance des fonds gérés activement.
Déclarations 13D/G
Nous présentons les dépôts 13D/G séparément des dépôts 13F en raison de leur traitement différent par la SEC. Les déclarations 13D/G peuvent être déposées par des groupes d'investisseurs (avec un leader), ce qui n'est pas le cas des déclarations 13F. Il en résulte des situations dans lesquelles un investisseur peut déposer une déclaration 13D/G indiquant une valeur pour le total des actions (représentant toutes les actions détenues par le groupe d'investisseurs), mais déposer ensuite une déclaration 13F indiquant une valeur différente pour le total des actions (représentant strictement ses propres actions). Cela signifie que l'actionnariat des déclarations 13D/G et des déclarations 13F n'est souvent pas directement comparable, c'est pourquoi nous les présentons séparément.
Note : À compter du 16 mai 2021, nous n'affichons plus les propriétaires qui n'ont pas déposé de déclaration 13D/G au cours de l'année écoulée. Auparavant, nous montrions l'historique complet des déclarations 13D/G. En général, les entités qui sont tenues de déposer des déclarations 13D/G doivent le faire au moins une fois par an avant de soumettre une déclaration de clôture. Cependant, il arrive que des fonds sortent de positions sans soumettre de déclaration de clôture (c'est-à-dire qu'ils procèdent à une liquidation), de sorte que l'affichage de l'historique complet pouvait prêter à confusion quant à l'actionnariat actuel. Pour éviter toute confusion, nous n'affichons désormais que les propriétaires "actuels", c'est-à-dire les propriétaires qui ont déposé des documents au cours de l'année écoulée.
Upgrade to unlock premium data.
| Date de dépôt | Formulaire | Investisseur | Actions précédentes |
Actions actuelles |
&Delta ; Actions (Pourcentage) |
Participation (Pourcentage) |
&Delta ; Participation (Pourcentage) |
|
|---|---|---|---|---|---|---|---|---|
| 2025-08-14 | VAN ECK ASSOCIATES CORP | 53,746,220 | 5.99 | |||||
| 2025-08-14 | Global X Management CO LLC | 62,240,343 | 50,280,944 | -19.21 | 5.61 | -19.51 |
Déclarations 13F et NPORT
Les détails des déclarations 13F sont gratuits. Les détails des déclarations NP nécessitent une adhésion premium. Les lignes vertes indiquent de nouvelles positions. Les lignes rouges indiquent des positions clôturées. Cliquez sur l'icône du lien pour voir l'historique complet des transactions.
Mettre à niveau
pour débloquer des données premium et les exporter vers Excel ![]() .
.
| Date de dépôt | Source | Investisseur | Type | Prix moyen (Est) |
Actions | Δ Actions (%) |
Valeur déclarée (1000 $) |
Δ Valeur (%) |
Allocation de portefeuille (%) |
|
|---|---|---|---|---|---|---|---|---|---|---|
| 2025-07-15 | 13F | Public Employees Retirement System Of Ohio | 206 652 | -6,85 | 377 | 30,45 | ||||
| 2025-08-05 | 13F | GPS Wealth Strategies Group, LLC | 9 666 | 0,00 | 18 | 41,67 | ||||
| 2025-05-30 | NP | WASIX - Seven Canyons Strategic Income Fund Investor Class | 336 000 | 437 | ||||||
| 2025-03-26 | NP | DFA INVESTMENT DIMENSIONS GROUP INC - International Social Core Equity Portfolio Institutional Class This fund is a listed as child fund of Dimensional Fund Advisors Lp and if that institution has disclosed ownership in this security, then these positions will not be double counted when calculating total shares and total value | 97 775 | 0,00 | 179 | -13,17 | ||||
| 2025-07-22 | 13F | IMC-Chicago, LLC | 257 990 | 2,08 | 470 | 42,99 | ||||
| 2025-07-09 | 13F | Shore Point Advisors, LLC | 10 000 | 0,00 | 18 | 38,46 | ||||
| 2025-07-22 | 13F | IMC-Chicago, LLC | Put | 215 100 | 6,59 | 391 | 49,24 | |||
| 2025-07-28 | 13F | Harbour Investments, Inc. | 1 108 | -59,08 | 2 | -33,33 | ||||
| 2025-08-15 | 13F | CI Private Wealth, LLC | 20 000 | 0,00 | 36 | 38,46 | ||||
| 2025-06-26 | NP | IDEV - iShares Core MSCI International Developed Markets ETF | 1 080 776 | 9,79 | 1 552 | -13,83 | ||||
| 2025-08-28 | NP | SPDW - SPDR(R) Portfolio Developed World ex-US ETF | 410 589 | 2,76 | 749 | 43,76 | ||||
| 2025-07-28 | 13F | Mutual Advisors, LLC | 16 531 | 0,00 | 37 | 63,64 | ||||
| 2025-08-12 | 13F | SRS Capital Advisors, Inc. | 2 000 | 0,00 | 4 | 50,00 | ||||
| 2025-08-19 | 13F | Advisory Services Network, LLC | 17 200 | -20,00 | 36 | 29,63 | ||||
| 2025-06-24 | NP | TLTD - FlexShares Morningstar Developed Markets ex-US Factor Tilt Index Fund | 19 424 | 0,00 | 28 | -22,86 | ||||
| 2025-08-08 | 13F | Old West Investment Management, LLC | 694 614 | 70,12 | 1 264 | 138,49 | ||||
| 2025-08-14 | 13F | Farringdon Capital, Ltd. | 0 | -100,00 | 0 | -100,00 | ||||
| 2025-08-07 | 13F | Rathbone Brothers plc | 75 300 | 0,00 | 137 | 39,80 | ||||
| 2025-08-13 | 13F | Renaissance Technologies Llc | 5 152 401 | -57,34 | 9 377 | -40,27 | ||||
| 2025-08-29 | 13F | Centaurus Financial, Inc. | 14 175 | 0,00 | 0 | |||||
| 2025-08-12 | 13F | Kimelman & Baird, LLC | 517 | 0,00 | 1 | |||||
| 2025-08-13 | 13F | Amundi | 0 | -100,00 | 0 | |||||
| 2025-08-14 | 13F | Hood River Capital Management LLC | 26 596 628 | -1,12 | 48 406 | 38,43 | ||||
| 2025-08-13 | 13F | Flow Traders U.s. Llc | 82 445 | 0 | ||||||
| 2025-08-15 | 13F | Great West Life Assurance Co /can/ | 744 631 | 137,95 | 1 | |||||
| 2025-08-11 | 13F | TD Waterhouse Canada Inc. | 322 108 | 3 076,29 | 563 | 4 223,08 | ||||
| 2025-08-12 | 13F | Legal & General Group Plc | 1 070 969 | 20,74 | 1 954 | 68,74 | ||||
| 2025-08-13 | 13F | De Lisle Partners LLP | 2 037 909 | 7,95 | 3 709 | 51,10 | ||||
| 2025-08-14 | 13F | Colony Group, LLC | 14 800 | 27 | ||||||
| 2025-08-14 | 13F | Headlands Technologies LLC | 231 658 | 7 014,80 | 422 | 10 425,00 | ||||
| 2025-07-16 | 13F | ORG Partners LLC | 5 750 | 0,00 | 10 | 42,86 | ||||
| 2025-08-13 | 13F | Russell Investments Group, Ltd. | 970 034 | 0,00 | 1 770 | 39,70 | ||||
| 2025-08-04 | 13F | Pensionmark Financial Group, Llc | 10 000 | 18 | ||||||
| 2025-08-14 | 13F | Bank Of America Corp /de/ | 1 352 928 | -40,30 | 2 462 | -16,40 | ||||
| 2025-05-15 | 13F | Two Sigma Advisers, Lp | 0 | -100,00 | 0 | |||||
| 2025-06-26 | NP | DFAX - Dimensional World ex U.S. Core Equity 2 ETF | 146 292 | 0,00 | 210 | -22,01 | ||||
| 2025-05-21 | 13F/A | Geneos Wealth Management Inc. | 500 | 0,00 | 1 | |||||
| 2025-08-14 | 13F | Two Sigma Investments, Lp | 947 878 | 1 725 | ||||||
| 2025-05-12 | 13F | Fmr Llc | 0 | -100,00 | 0 | |||||
| 2025-05-15 | 13F | Oxford Asset Management Llp | 0 | -100,00 | 0 | -100,00 | ||||
| 2025-08-28 | NP | SSGVX - State Street Global Equity ex-U.S. Index Portfolio State Street Global All Cap Equity ex-U.S. Index Portfolio This fund is a listed as child fund of State Street Corp and if that institution has disclosed ownership in this security, then these positions will not be double counted when calculating total shares and total value | 235 400 | 0,00 | 430 | 39,74 | ||||
| 2025-08-12 | 13F | Jpmorgan Chase & Co | 0 | -100,00 | 0 | -100,00 | ||||
| 2025-08-14 | 13F | CIBC Asset Management Inc | 803 334 | -22,83 | 1 468 | 7,94 | ||||
| 2025-04-08 | 13F | Rothschild Investment Llc | 0 | -100,00 | 0 | |||||
| 2025-08-13 | 13F | Bridgewater Associates, LP | 4 617 008 | -41,19 | 8 403 | -17,68 | ||||
| 2025-08-14 | 13F | Ardsley Advisory Partners Lp | 2 000 000 | 100,00 | 3 640 | 180,00 | ||||
| 2025-08-12 | 13F | Winnow Wealth Llc | 340 913 | 620 | ||||||
| 2025-08-14 | 13F | Citadel Advisors Llc | Put | 710 700 | -2,17 | 1 293 | 36,97 | |||
| 2025-08-14 | 13F | Hrt Financial Lp | 69 971 | -95,42 | 0 | -100,00 | ||||
| 2025-08-11 | 13F | Banque Cantonale Vaudoise | 288 364 | 1 | ||||||
| 2025-08-14 | 13F | GeoSphere Capital Management | 1 300 000 | 2 366 | ||||||
| 2025-08-11 | 13F | Sprott Inc. | 798 498 | 3,42 | 1 453 | 44,87 | ||||
| 2025-08-27 | NP | TIFF INVESTMENT PROGRAM - TIFF Multi-Asset Fund | 997 790 | 19,93 | 1 816 | 67,90 | ||||
| 2025-08-08 | 13F | Avantax Advisory Services, Inc. | 27 400 | 5,79 | 50 | 48,48 | ||||
| 2025-07-16 | 13F | Eagle Global Advisors Llc | 205 400 | 0,00 | 374 | 39,70 | ||||
| 2025-08-12 | 13F | NFP Retirement, Inc. | 83 000 | 0,00 | 151 | 41,12 | ||||
| 2025-08-14 | 13F | Optiver Holding B.V. | 0 | -100,00 | 0 | |||||
| 2025-08-14 | 13F | Group One Trading, L.p. | 373 222 | 107,54 | 679 | 191,42 | ||||
| 2025-08-04 | 13F | Assetmark, Inc | 1 000 | 0,00 | 2 | 0,00 | ||||
| 2025-08-13 | 13F | Bank Of Nova Scotia | 13 828 | -51,72 | 25 | -32,43 | ||||
| 2025-08-14 | 13F | ArrowMark Colorado Holdings LLC | 2 499 000 | 26,53 | 4 548 | 77,17 | ||||
| 2025-08-29 | 13F | Total Investment Management Inc | 1 221 | 2 | ||||||
| 2025-08-14 | 13F | Group One Trading, L.p. | Put | 302 600 | 7,19 | 551 | 50,27 | |||
| 2025-08-14 | 13F | Vident Advisory, LLC | 9 755 610 | 41,92 | 17 755 | 98,69 | ||||
| 2025-08-14 | 13F | Group One Trading, L.p. | Call | 2 579 600 | -57,98 | 4 695 | -41,19 | |||
| 2025-06-26 | NP | DFIS - Dimensional International Small Cap ETF | 0 | -100,00 | 0 | -100,00 | ||||
| 2025-08-12 | 13F | Fulcrum Asset Management LLP | Put | 0 | -100,00 | 0 | -100,00 | |||
| 2025-08-13 | 13F | Marshall Wace, Llp | 0 | -100,00 | 0 | |||||
| 2025-07-14 | 13F | Legacy Capital Group California, Inc. | 122 887 | 69,88 | 224 | 137,23 | ||||
| 2025-08-25 | NP | AMERICAN FUNDS INSURANCE SERIES - Global Small Capitalization Fund Class 1 This fund is a listed as child fund of Capital World Investors and if that institution has disclosed ownership in this security, then these positions will not be double counted when calculating total shares and total value | 1 375 744 | 41,22 | 2 516 | 97,72 | ||||
| 2025-07-29 | 13F | Mb, Levis & Associates, Llc | 152 | 0,00 | 0 | |||||
| 2025-08-14 | 13F | Goldman Sachs Group Inc | 4 482 265 | 165,56 | 8 158 | 271,79 | ||||
| 2025-04-28 | NP | CRIT - Optica Rare Earths & Critical Materials ETF | 18 795 | -1,70 | 28 | -39,13 | ||||
| 2025-07-23 | 13F | Shell Asset Management Co | 45 871 | 3,15 | 0 | |||||
| 2025-08-11 | 13F | HighTower Advisors, LLC | 87 330 | -14,53 | 159 | 19,70 | ||||
| 2025-07-23 | 13F | Vontobel Holding Ltd. | 182 274 | -1,35 | 334 | 38,17 | ||||
| 2025-08-12 | 13F | Nuveen, LLC | 674 581 | -14,22 | 1 231 | 19,86 | ||||
| 2025-08-13 | 13F | Mirabella Financial Services Llp | 0 | -100,00 | 0 | |||||
| 2025-08-11 | 13F | Citigroup Inc | 218 317 | 94,17 | 398 | 172,60 | ||||
| 2025-07-25 | 13F | Welch Group, LLC | 11 428 | 0,00 | 21 | 33,33 | ||||
| 2025-07-14 | 13F | UMA Financial Services, Inc. | 140 | 0,00 | 0 | |||||
| 2025-08-13 | 13F | Jones Financial Companies Lllp | 6 952 | 117,25 | 12 | 200,00 | ||||
| 2025-08-07 | 13F | Zurcher Kantonalbank (Zurich Cantonalbank) | 252 645 | -1,10 | 461 | 38,44 | ||||
| 2025-08-12 | 13F | LPL Financial LLC | 132 938 | -14,32 | 242 | 19,90 | ||||
| 2025-03-21 | NP | PASIX - PACE Alternative Strategies Investments Class A | 0 | -100,00 | 0 | -100,00 | ||||
| 2025-07-16 | 13F | Arlington Capital Management, Inc. | 0 | -100,00 | 0 | |||||
| 2025-05-12 | 13F | Fiduciary Family Office, Llc | 0 | -100,00 | 0 | -100,00 | ||||
| 2025-07-29 | 13F | JTC Employer Solutions Trusteee Ltd | 11 356 | 0,00 | 0 | |||||
| 2025-08-25 | NP | SMCWX - SMALLCAP WORLD FUND INC Class A | 10 080 191 | 28,33 | 18 432 | 79,62 | ||||
| 2025-05-16 | 13F | McIlrath & Eck, LLC | 0 | -100,00 | 0 | |||||
| 2025-08-14 | 13F | Arosa Capital Management LP | 1 285 200 | -12,01 | 2 339 | 23,23 | ||||
| 2025-08-04 | 13F | Center for Financial Planning, Inc. | 490 | 0,00 | 1 | |||||
| 2025-08-14 | 13F | Caption Management, LLC | Call | 120 200 | 219 | |||||
| 2025-07-21 | 13F | Mirae Asset Global Investments Co., Ltd. | 0 | -100,00 | 0 | -100,00 | ||||
| 2025-08-14 | 13F | Caption Management, LLC | 700 000 | 833,33 | 1 274 | 1 213,40 | ||||
| 2025-08-25 | NP | SPROTT FUNDS TRUST - Sprott Junior Uranium Miners ETF | 19 402 291 | 21,33 | 35 312 | 69,86 | ||||
| 2025-05-07 | 13F | David R. Rahn & Associates Inc. | 0 | -100,00 | 0 | |||||
| 2025-08-13 | 13F | Pictet Asset Management Holding SA | 129 090 | -18,61 | 236 | 13,53 | ||||
| 2025-08-05 | 13F | Bank Of Montreal /can/ | Put | 11 400 | 0,00 | 21 | 42,86 | |||
| 2025-07-31 | 13F | Caitong International Asset Management Co., Ltd | 58 512 | 7 904,38 | 106 | |||||
| 2025-08-14 | 13F | Federation des caisses Desjardins du Quebec | 1 782 708 | -0,05 | 3 246 | 39,99 | ||||
| 2025-08-11 | 13F | Aptus Capital Advisors, LLC | 37 000 | 0,00 | 67 | 39,58 | ||||
| 2025-06-26 | NP | DFIEX - International Core Equity Portfolio - Institutional Class This fund is a listed as child fund of Dimensional Fund Advisors Lp and if that institution has disclosed ownership in this security, then these positions will not be double counted when calculating total shares and total value | 1 668 715 | 0,00 | 2 397 | -21,55 | ||||
| 2025-08-07 | 13F | Hennion & Walsh Asset Management, Inc. | 223 412 | 63,62 | 407 | 129,38 | ||||
| 2025-08-14 | 13F | Southport Management, L.l.c. | 91 000 | 37,88 | 166 | 94,12 | ||||
| 2025-07-23 | 13F | Triasima Portfolio Management inc. | 0 | -100,00 | 0 | |||||
| 2025-08-13 | 13F/A | StoneX Group Inc. | 0 | -100,00 | 0 | -100,00 | ||||
| 2025-08-04 | 13F | Deuterium Capital Management, LLC | 120 243 | 0,00 | 219 | 39,74 | ||||
| 2025-08-12 | 13F | Fulcrum Asset Management LLP | 17 057 | 31 | ||||||
| 2025-08-13 | 13F | Falcon Edge Capital, LP | 1 843 479 | 56,22 | 3 355 | 118,71 | ||||
| 2025-07-31 | 13F | R Squared Ltd | 21 660 | 39 | ||||||
| 2025-08-06 | 13F | Commonwealth Equity Services, Llc | 20 264 | 4,11 | 0 | |||||
| 2025-07-22 | 13F | DAVENPORT & Co LLC | 150 000 | 0,00 | 273 | 40,00 | ||||
| 2025-07-22 | NP | GRHIX - Goehring & Rozencwajg Resources Fund Institutional Class Shares | 2 026 200 | 0,00 | 3 222 | 6,69 | ||||
| 2025-08-05 | 13F | Bank Of Montreal /can/ | 3 974 353 | 60,38 | 7 272 | 124,55 | ||||
| 2025-08-13 | 13F | Beutel, Goodman & Co Ltd. | 5 856 260 | -3,31 | 11 | 42,86 | ||||
| 2025-08-14 | 13F | Van Eck Associates Corp | 53 454 626 | 57,99 | 97 | 125,58 | ||||
| 2025-06-26 | NP | DFA INVESTMENT DIMENSIONS GROUP INC - World ex U.S. Core Equity Portfolio Institutional Class Shares | 90 674 | 0,00 | 130 | -21,21 | ||||
| 2025-08-04 | 13F | Bay Colony Advisory Group, Inc d/b/a Bay Colony Advisors | 12 502 | 19,04 | 23 | 69,23 | ||||
| 2025-08-13 | 13F | New Harbor Financial Group, LLC | 25 000 | -10,71 | 46 | 25,00 | ||||
| 2025-08-14 | 13F | Toronto Dominion Bank | Call | 0 | -100,00 | 0 | -100,00 | |||
| 2025-08-07 | 13F | CENTRAL TRUST Co | 0 | -100,00 | 0 | |||||
| 2025-08-14 | 13F | Toronto Dominion Bank | 28 603 | 1,53 | 52 | 44,44 | ||||
| 2025-08-13 | 13F | Continuum Advisory, LLC | 34 141 | 2,20 | 62 | 44,19 | ||||
| 2025-08-14 | 13F | Peak6 Llc | 20 075 | 37 | ||||||
| 2025-08-14 | 13F | Peak6 Llc | Put | 50 000 | 0,00 | 91 | 40,00 | |||
| 2025-08-14 | 13F | Mariner, LLC | 37 718 | -13,04 | 69 | 21,43 | ||||
| 2025-08-11 | 13F | Vanguard Group Inc | 737 947 | 0,00 | 1 349 | 39,94 | ||||
| 2025-08-14 | 13F | Peak6 Llc | Call | 46 500 | -94,81 | 85 | -92,79 | |||
| 2025-08-13 | 13F | ExodusPoint Capital Management, LP | 706 100 | 1 | ||||||
| 2025-08-27 | NP | ALLIANZ VARIABLE INSURANCE PRODUCTS TRUST - AZL DFA International Core Equity Fund | 5 000 | 0,00 | 9 | 50,00 | ||||
| 2025-05-14 | 13F | Oarsman Capital, Inc. | 0 | -100,00 | 0 | |||||
| 2025-08-13 | 13F | Tejara Capital Ltd | 338 286 | -56,36 | 616 | -38,93 | ||||
| 2025-08-25 | NP | MVALX - MERIDIAN CONTRARIAN FUND Legacy Class | 2 499 000 | 26,53 | 4 548 | 77,17 | ||||
| 2025-05-14 | 13F | PineBridge Investments, L.P. | 0 | -100,00 | 0 | |||||
| 2025-08-14 | 13F | Toroso Investments, LLC | 31 769 | -23,29 | 58 | 7,55 | ||||
| 2025-08-12 | 13F | XTX Topco Ltd | 757 158 | 503,98 | 1 378 | 750,62 | ||||
| 2025-08-06 | 13F | MMCAP International Inc. SPC | 13 412 284 | -43,87 | 24 410 | -21,42 | ||||
| 2025-08-12 | 13F | Goehring & Rozencwajg Associates, LLC | 3 756 986 | -0,95 | 6 838 | 17,82 | ||||
| 2025-08-19 | 13F/A | L1 Capital Pty Ltd | 301 620 | 552 | ||||||
| 2025-08-15 | NP | MBEQX - M International Equity Fund | 7 600 | 0,00 | 14 | 44,44 | ||||
| 2025-08-13 | 13F | Scotia Capital Inc. | 240 107 | 2,48 | 437 | 43,75 | ||||
| 2025-08-14 | 13F | Wells Fargo & Company/mn | 1 408 602 | -11,35 | 2 564 | 24,12 | ||||
| 2025-05-15 | 13F | Tower Research Capital LLC (TRC) | 0 | -100,00 | 0 | |||||
| 2025-08-12 | 13F | Pathstone Holdings, LLC | 19 300 | 0,00 | 35 | 40,00 | ||||
| 2025-07-28 | 13F | Triton Wealth Management, PLLC | 10 000 | 0,00 | 23 | 10,00 | ||||
| 2025-08-14 | 13F | Segra Capital Management, LLC | 33 901 398 | 12,63 | 61 701 | 57,69 | ||||
| 2025-08-14 | 13F | Mangrove Partners | 465 275 | 0,00 | 847 | 40,07 | ||||
| 2025-06-26 | NP | DFA INVESTMENT DIMENSIONS GROUP INC - International Vector Equity Portfolio Shares | 174 739 | 0,00 | 251 | -21,63 | ||||
| 2025-08-13 | 13F | Northwest & Ethical Investments L.P. | 67 819 | -18,57 | 124 | 13,89 | ||||
| 2025-08-12 | 13F | Global Retirement Partners, LLC | 0 | -100,00 | 0 | |||||
| 2025-08-14 | 13F | Scientech Research LLC | 39 326 | 72 | ||||||
| 2025-08-14 | 13F | Integrity Wealth Advisors, Inc. | 59 700 | 0,00 | 109 | 40,26 | ||||
| 2025-04-02 | 13F | Marcum Wealth, LLC | 50 000 | 0,00 | 65 | -27,78 | ||||
| 2025-08-13 | 13F | Invesco Ltd. | 26 631 | 0,33 | 48 | 41,18 | ||||
| 2025-08-14 | 13F | Susquehanna International Group, Llp | 5 310 393 | 101,57 | 9 665 | 182,24 | ||||
| 2025-08-19 | 13F | National Asset Management, Inc. | 21 000 | -16,00 | 38 | -15,56 | ||||
| 2025-07-24 | 13F | U S Global Investors Inc | 0 | -100,00 | 0 | |||||
| 2025-08-14 | 13F | Susquehanna International Group, Llp | Call | 816 900 | -75,77 | 1 487 | -66,10 | |||
| 2025-08-01 | 13F | Vision Financial Markets Llc | 157 | 0,00 | 0 | |||||
| 2025-08-14 | 13F | Susquehanna International Group, Llp | Put | 888 300 | 29,66 | 1 617 | 81,57 | |||
| 2025-06-26 | NP | DFIC - Dimensional International Core Equity 2 ETF | 167 002 | 0,00 | 235 | -22,44 | ||||
| 2025-08-14 | 13F | Alliancebernstein L.p. | 322 181 | 7,12 | 586 | 49,87 | ||||
| 2025-08-12 | 13F | BlackRock, Inc. | 418 217 | -0,58 | 761 | 39,38 | ||||
| 2025-08-05 | 13F | Simplex Trading, Llc | 0 | -100,00 | 0 | |||||
| 2025-08-06 | 13F | Rialto Wealth Management, LLC | 6 000 | 0,00 | 11 | 42,86 | ||||
| 2025-08-14 | 13F | Integrated Investment Consultants, LLC | 15 000 | 0,00 | 27 | 42,11 | ||||
| 2025-08-12 | 13F | Swiss National Bank | 1 723 400 | -0,97 | 3 139 | 37,98 | ||||
| 2025-03-26 | NP | DFA INVESTMENT DIMENSIONS GROUP INC - International Small Cap Growth Portfolio Institutional Class This fund is a listed as child fund of Dimensional Fund Advisors Lp and if that institution has disclosed ownership in this security, then these positions will not be double counted when calculating total shares and total value | 54 363 | 162,90 | 99 | 130,23 | ||||
| 2025-08-12 | 13F | Deutsche Bank Ag\ | 63 468 | 0,00 | 116 | 40,24 | ||||
| 2025-08-15 | 13F | Morgan Stanley | 4 030 730 | -49,74 | 7 336 | -29,65 | ||||
| 2025-08-14 | 13F | Raymond James Financial Inc | 63 084 | 39,63 | 115 | 96,55 | ||||
| 2025-08-18 | 13F | Wolverine Trading, Llc | Put | 74 800 | -4,47 | 134 | 27,88 | |||
| 2025-05-15 | 13F | Cinctive Capital Management LP | 0 | -100,00 | 0 | |||||
| 2025-07-17 | 13F | Refined Wealth Management | 10 850 | 0,00 | 20 | 35,71 | ||||
| 2025-07-23 | 13F | Sachetta, LLC | 5 000 | 0,00 | 9 | 50,00 | ||||
| 2025-08-14 | 13F | Two Sigma Securities, Llc | 503 270 | 1 016,02 | 916 | 1 477,59 | ||||
| 2025-08-18 | 13F | Wolverine Trading, Llc | 45 782 | -24,24 | 82 | 1,25 | ||||
| 2025-08-18 | 13F | Wolverine Trading, Llc | Call | 280 800 | -14,34 | 503 | 15,40 | |||
| 2025-08-14 | 13F | Investment Management Corp of Ontario | 50 569 | -5,07 | 92 | 33,33 | ||||
| 2025-05-27 | NP | PSPFX - Global Resources Fund | 50 000 | -56,52 | 65 | -68,60 | ||||
| 2025-07-10 | 13F | Wealth Enhancement Advisory Services, Llc | 64 521 | 504,75 | 117 | 800,00 | ||||
| 2025-08-14 | 13F | Integrated Wealth Concepts LLC | 18 551 | 1,07 | 34 | 43,48 | ||||
| 2025-08-14 | 13F/A | Barclays Plc | 185 975 | -0,61 | 0 | |||||
| 2025-08-12 | 13F | Steward Partners Investment Advisory, Llc | 6 000 | 0,00 | 11 | 42,86 | ||||
| 2025-08-06 | 13F | Titan Global Capital Management Usa Llc | 1 961 719 | 15,56 | 3 570 | 61,83 | ||||
| 2025-07-21 | 13F | Azarias Capital Management, L.P. | 3 064 876 | 0,00 | 5 578 | 40,01 | ||||
| 2025-08-13 | 13F | Capital Research Global Investors | 11 455 935 | 29,75 | 20 948 | 81,61 | ||||
| 2025-08-06 | NP | LINCOLN VARIABLE INSURANCE PRODUCTS TRUST - LVIP Dimensional International Core Equity Fund Standard Class | 25 260 | 0,00 | 46 | 39,39 | ||||
| 2025-07-22 | 13F | Cedar Mountain Advisors, LLC | 749 | 0,00 | 1 | |||||
| 2025-08-08 | 13F | SG Americas Securities, LLC | 0 | -100,00 | 0 | |||||
| 2025-08-12 | 13F | Dimensional Fund Advisors Lp | 445 541 | -2,59 | 811 | 36,36 | ||||
| 2025-07-25 | 13F | JustInvest LLC | 25 857 | -17,33 | 47 | 17,50 | ||||
| 2025-08-14 | 13F | MIRAE ASSET GLOBAL ETFS HOLDINGS Ltd. | 50 305 240 | -13,46 | 91 799 | 20,90 | ||||
| 2025-07-14 | 13F | Pacifica Partners Inc. | 45 300 | 0,00 | 81 | 42,86 | ||||
| 2025-06-26 | NP | AMTAX - AB All Market Real Return Portfolio Class A | 253 996 | 365 | ||||||
| 2025-08-12 | 13F | Accordant Advisory Group Inc | 340 913 | -1,45 | 620 | 38,08 | ||||
| 2025-08-25 | NP | SETM - Sprott Energy Transition Materials ETF | 569 409 | 9,88 | 1 036 | 53,94 | ||||
| 2025-07-29 | NP | JISAX - International Small Company Fund Class NAV | 0 | -100,00 | 0 | -100,00 | ||||
| 2025-05-15 | 13F | Cubist Systematic Strategies, LLC | 0 | -100,00 | 0 | |||||
| 2025-07-17 | 13F | Vermillion Wealth Management, Inc. | 1 043 | 0,00 | 2 | 0,00 | ||||
| 2025-06-27 | NP | URA - Global X Uranium ETF This fund is a listed as child fund of Mirae Asset Global Investments Co., Ltd. and if that institution has disclosed ownership in this security, then these positions will not be double counted when calculating total shares and total value | 49 456 393 | -17,17 | 70 892 | -35,36 | ||||
| 2025-05-15 | 13F | D. E. Shaw & Co., Inc. | 0 | -100,00 | 0 | -100,00 | ||||
| 2025-08-14 | 13F | Ubs Asset Management Americas Inc | 1 390 082 | -7,59 | 2 530 | 29,36 | ||||
| 2025-08-12 | 13F | MAI Capital Management | 0 | -100,00 | 0 | |||||
| 2025-07-14 | 13F | AdvisorNet Financial, Inc | 7 202 | 18,28 | 13 | 85,71 | ||||
| 2025-08-07 | 13F | Allworth Financial LP | 2 424 | 1 854,84 | 4 | |||||
| 2025-08-12 | 13F | Atlas Capital Advisors Llc | 0 | -100,00 | 0 | |||||
| 2025-08-13 | 13F | Lido Advisors, LLC | 12 000 | -5,09 | 22 | 31,25 | ||||
| 2025-07-28 | 13F | Ritholtz Wealth Management | 11 788 | 21 | ||||||
| 2025-08-27 | NP | Brighthouse Funds Trust II - Brighthouse/Dimensional International Small Company Portfolio Class A | 87 299 | -1,80 | 160 | 37,07 | ||||
| 2025-08-11 | 13F | NewEdge Wealth, LLC | 15 000 | 0,00 | 34 | 73,68 | ||||
| 2025-08-15 | 13F | Kestra Advisory Services, LLC | 0 | -100,00 | 0 | |||||
| 2025-08-12 | 13F | J.w. Cole Advisors, Inc. | 58 620 | 54,26 | 107 | 116,33 | ||||
| 2025-06-26 | NP | Dfa Investment Dimensions Group Inc - Va International Small Portfolio This fund is a listed as child fund of Dimensional Fund Advisors Lp and if that institution has disclosed ownership in this security, then these positions will not be double counted when calculating total shares and total value | 14 027 | -71,90 | 20 | -73,24 | ||||
| 2025-08-14 | 13F | SIH Partners, LLLP | 0 | -100,00 | 0 | |||||
| 2025-07-24 | 13F | Total Wealth Planning & Management, Inc. | 24 100 | 12,09 | 44 | 59,26 | ||||
| 2025-08-14 | 13F | Lloyd Harbor Capital Management, LLC | 6 710 162 | 4,68 | 12 212 | 46,55 | ||||
| 2025-07-24 | 13F | Total Wealth Planning & Management, Inc. | Call | 5 000 | 0,00 | 12 | 33,33 | |||
| 2025-08-12 | 13F | Nemes Rush Group LLC | 500 | 0,00 | 1 | |||||
| 2025-09-04 | 13F | SevenBridge Financial Group, LLC | 37 000 | 0,00 | 80 | 41,07 | ||||
| 2025-07-31 | 13F | Fielder Capital Group LLC | 1 194 892 | -1,32 | 2 175 | 38,12 | ||||
| 2025-08-05 | 13F | Huntington National Bank | 0 | -100,00 | 0 | |||||
| 2025-07-17 | 13F | Sound Income Strategies, LLC | 5 400 | 0,00 | 10 | 28,57 | ||||
| 2025-08-05 | 13F | Ninepoint Partners LP | 235 000 | 0,00 | 428 | 40,00 | ||||
| 2025-05-14 | 13F | Credit Agricole S A | 0 | -100,00 | 0 | |||||
| 2025-05-15 | 13F | Point72 Asset Management, L.P. | 0 | -100,00 | 0 | |||||
| 2025-08-12 | 13F | Virtu Financial LLC | 1 150 616 | 426,18 | 2 | |||||
| 2025-08-13 | 13F | Formula Growth Ltd | 868 725 | 1 581 | ||||||
| 2025-08-01 | 13F | Brookwood Investment Group LLC | 71 215 | 321,71 | 130 | 514,29 | ||||
| 2025-08-14 | 13F | Janus Henderson Group Plc | 3 561 186 | 1,03 | 6 510 | 37,52 | ||||
| 2025-05-15 | 13F | Bayesian Capital Management, LP | 0 | -100,00 | 0 | -100,00 | ||||
| 2025-08-04 | 13F | Canton Hathaway, LLC | 41 000 | 0 | ||||||
| 2025-08-07 | 13F | Connor, Clark & Lunn Investment Management Ltd. | 8 945 229 | 35,39 | 16 367 | 89,61 | ||||
| 2025-08-08 | 13F | Keebeck Alpha, LP | 0 | -100,00 | 0 | -100,00 | ||||
| 2025-08-27 | 13F/A | Squarepoint Ops LLC | Call | 22 600 | 0,00 | 41 | 41,38 | |||
| 2025-05-27 | NP | HRITX - Hood River International Opportunity Fund Retirement Shares | 597 961 | 66,76 | 777 | 20,47 | ||||
| 2025-08-12 | 13F | Proequities, Inc. | Put | 0 | 0 | |||||
| 2025-08-13 | 13F | Level Four Advisory Services, Llc | 22 205 | -15,57 | 40 | 17,65 | ||||
| 2025-08-14 | 13F | BW Gestao de Investimentos Ltda. | 2 930 000 | 5 333 | ||||||
| 2025-08-14 | 13F | GWM Advisors LLC | 206 127 | -9,52 | 375 | 26,69 | ||||
| 2025-08-05 | 13F | VGI Partners Ltd | 493 445 | -50,69 | 898 | -30,98 | ||||
| 2025-08-12 | 13F | Proequities, Inc. | Call | 0 | 0 | |||||
| 2025-08-12 | 13F | Proequities, Inc. | 0 | 0 | ||||||
| 2025-08-27 | 13F/A | Squarepoint Ops LLC | Put | 28 200 | -0,70 | 51 | 41,67 | |||
| 2025-08-27 | 13F/A | Squarepoint Ops LLC | 139 573 | -24,95 | 254 | 5,39 | ||||
| 2025-07-25 | NP | FILL - iShares MSCI Global Energy Producers ETF | 27 242 | -5,63 | 43 | 0,00 | ||||
| 2025-08-08 | 13F | SBI Securities Co., Ltd. | 8 818 | 10,72 | 16 | 60,00 | ||||
| 2025-08-14 | 13F | Atomi Financial Group, Inc. | 41 000 | 0,17 | 75 | 39,62 | ||||
| 2025-08-06 | 13F | Stone House Investment Management, LLC | 2 678 | 0,00 | 5 | 33,33 | ||||
| 2025-05-15 | 13F | Polar Asset Management Partners Inc. | 0 | -100,00 | 0 | -100,00 | ||||
| 2025-08-12 | 13F | Catalyst Funds Management Pty Ltd | 1 877 700 | 3 417 | ||||||
| 2025-08-14 | 13F | UBS Group AG | 8 640 294 | 128,87 | 15 725 | 220,46 | ||||
| 2025-06-26 | NP | FTIHX - Fidelity Total International Index Fund This fund is a listed as child fund of Fmr Llc and if that institution has disclosed ownership in this security, then these positions will not be double counted when calculating total shares and total value | 401 579 | 2,44 | 577 | -19,67 | ||||
| 2025-08-14 | 13F | CoreCap Advisors, LLC | 12 438 | 0,00 | 23 | 37,50 | ||||
| 2025-08-14 | 13F | Cantor Fitzgerald, L. P. | 465 629 | 42,41 | 847 | 99,29 | ||||
| 2025-08-14 | 13F | Alyeska Investment Group, L.P. | 1 500 000 | 0,00 | 2 730 | 40,00 | ||||
| 2025-05-21 | 13F | Impala Asset Management LLC | 0 | -100,00 | 0 | |||||
| 2025-07-28 | 13F | Td Asset Management Inc | 8 987 804 | 4,08 | 16 401 | 45,40 | ||||
| 2025-08-27 | NP | URAN - Themes Uranium & Nuclear ETF | 178 001 | 50,54 | 325 | 111,04 | ||||
| 2025-08-14 | 13F | Banque Transatlantique SA | 0 | -100,00 | 0 | |||||
| 2025-08-12 | 13F | Rhumbline Advisers | 26 | 0,00 | 0 | |||||
| 2025-08-18 | 13F/A | National Bank Of Canada /fi/ | 1 045 463 | -2,07 | 1 906 | 37,22 | ||||
| 2025-04-15 | 13F | NewGen Asset Management Ltd | 0 | -100,00 | 0 | -100,00 | ||||
| 2025-08-14 | 13F | Jane Street Group, Llc | 1 695 910 | -64,85 | 3 103 | -50,78 | ||||
| 2025-07-31 | 13F | Cambridge Investment Research Advisors, Inc. | 303 142 | -24,50 | 1 | |||||
| 2025-08-14 | 13F | Jane Street Group, Llc | Put | 44 100 | 29,71 | 81 | 81,82 | |||
| 2025-07-31 | 13F | Ground Swell Capital, LLC | 0 | -100,00 | 0 | |||||
| 2025-08-08 | 13F | Larson Financial Group LLC | 12 849 | 0,00 | 23 | 43,75 | ||||
| 2025-08-14 | 13F | Jane Street Group, Llc | Call | 601 000 | 15,22 | 1 100 | 61,38 | |||
| 2025-08-13 | 13F | Natixis | 344 462 | 6,23 | 616 | 46,43 | ||||
| 2025-08-14 | 13F | Balyasny Asset Management Llc | 4 394 528 | 7 998 | ||||||
| 2025-07-01 | 13F | Confluence Investment Management Llc | 266 880 | -1,09 | 486 | 38,57 | ||||
| 2025-08-14 | 13F | Millennium Management Llc | 4 746 410 | -16,88 | 8 655 | 16,58 | ||||
| 2025-05-15 | 13F | Tudor Investment Corp Et Al | 0 | -100,00 | 0 | |||||
| 2025-08-14 | 13F | Intact Investment Management Inc. | 2 727 100 | 32,72 | 4 985 | 85,73 | ||||
| 2025-08-07 | 13F | PCJ Investment Counsel Ltd. | 2 049 490 | 32,02 | 3 750 | 84,86 | ||||
| 2025-07-15 | 13F | Compagnie Lombard Odier SCmA | 5 500 | 0,00 | 10 | 42,86 | ||||
| 2025-06-26 | NP | CCSO - Carbon Collective Climate Solutions U.S. Equity ETF | 31 769 | -25,85 | 45 | -42,86 | ||||
| 2025-08-14 | 13F | Prelude Capital Management, Llc | 0 | -100,00 | 0 | |||||
| 2025-08-08 | 13F | Emerald Investment Partners, Llc | 18 000 | 50,00 | 33 | 113,33 | ||||
| 2025-06-26 | NP | DFAI - Dimensional International Core Equity Market ETF | 60 776 | -69,86 | 87 | -69,37 | ||||
| 2025-08-11 | 13F | Fore Capital, LLC | 0 | -100,00 | 0 | -100,00 | ||||
| 2025-08-13 | 13F | Providence Capital Advisors, LLC | 23 371 | 0,00 | 43 | 40,00 | ||||
| 2025-08-14 | 13F | Scopus Asset Management, L.p. | 7 611 802 | -1,36 | 13 928 | 38,13 | ||||
| 2025-05-15 | 13F | Crestline Management, LP | 0 | -100,00 | 0 | |||||
| 2025-08-11 | 13F | Alps Advisors Inc | 60 006 874 | 3,83 | 109 213 | 45,37 | ||||
| 2025-08-14 | 13F | Bnp Paribas Arbitrage, Sa | 1 440 393 | 14 403 830,00 | 2 622 | |||||
| 2025-07-31 | 13F | Acuitas Investments, LLC | 0 | -100,00 | 0 | |||||
| 2025-08-05 | 13F | Strategic Financial Concepts, LLC | 71 772 | 0,00 | 131 | 0,00 | ||||
| 2025-09-04 | 13F/A | Advisor Group Holdings, Inc. | 54 647 | 24,17 | 99 | 73,68 | ||||
| 2025-08-19 | 13F | Hohimer Wealth Management, Llc | 22 900 | 42 | ||||||
| 2025-08-08 | 13F | Cetera Investment Advisers | 954 140 | 0,57 | 1 737 | 40,79 | ||||
| 2025-08-14 | 13F | Stifel Financial Corp | 294 656 | 10,95 | 536 | 55,36 | ||||
| 2025-07-16 | 13F | ORG Wealth Partners, LLC | 400 | 0,00 | 1 | |||||
| 2025-08-05 | 13F | Simplex Trading, Llc | Put | 214 300 | 37,28 | 0 | ||||
| 2025-08-05 | 13F | Simplex Trading, Llc | Call | 1 192 800 | -0,88 | 2 | 100,00 | |||
| 2025-07-22 | 13F | Hickory Asset Management, Inc. | 10 000 | 0,00 | 18 | 38,46 | ||||
| 2025-07-25 | NP | WSML - iShares MSCI World Small-Cap ETF | 51 597 | 81 | ||||||
| 2025-08-14 | 13F | Citadel Advisors Llc | 10 492 541 | 9,47 | 19 096 | 53,26 | ||||
| 2025-08-14 | 13F | Citadel Advisors Llc | Call | 175 200 | -32,85 | 319 | -6,19 | |||
| 2025-07-16 | 13F | Crown Wealth Group, LLC | 42 712 | 78 | ||||||
| 2025-08-21 | NP | NLR - VanEck Vectors Uranium+Nuclear Energy ETF | 42 716 837 | 82,76 | 77 745 | 155,87 | ||||
| 2025-08-14 | 13F | Financial Advisors Network, Inc. | 17 425 | 0,00 | 32 | 40,91 | ||||
| 2025-08-05 | 13F | Sigma Planning Corp | 0 | -100,00 | 0 | -100,00 | ||||
| 2025-08-25 | NP | Sprott Funds Trust - Sprott Uranium Miners Etf | 40 035 174 | -3,02 | 72 864 | 35,77 | ||||
| 2025-08-13 | 13F | Walleye Trading LLC | Call | 0 | -100,00 | 0 | ||||
| 2025-08-14 | 13F | Royal Bank Of Canada | 5 664 155 | 31,18 | 10 309 | 83,66 | ||||
| 2025-06-26 | NP | IXUS - iShares Core MSCI Total International Stock ETF | 1 612 115 | 0,83 | 2 315 | -20,88 | ||||
| 2025-04-28 | 13F | Financial Advocates Investment Management | 0 | -100,00 | 0 | |||||
| 2025-08-08 | 13F | Geode Capital Management, Llc | 490 480 | 5,57 | 901 | 47,06 | ||||
| 2025-08-01 | 13F | Advisory Alpha, LLC | 21 932 | 40 | ||||||
| 2025-07-31 | 13F | Buckingham Strategic Partners | 0 | -100,00 | 0 | |||||
| 2025-08-13 | 13F | Summit Financial, LLC | 2 379 247 | 0,00 | 4 330 | 39,99 | ||||
| 2025-08-14 | 13F | SummitTX Capital, L.P. | 2 074 658 | 141,24 | 3 776 | 237,66 | ||||
| 2025-08-29 | NP | JAJDX - International Small Company Trust NAV | 17 895 | 0,00 | 33 | 39,13 | ||||
| 2025-07-16 | 13F | Beaumont Financial Advisors, LLC | 10 700 | 0,00 | 19 | 46,15 | ||||
| 2025-08-14 | 13F | BRITISH COLUMBIA INVESTMENT MANAGEMENT Corp | 505 761 | 7,82 | 925 | 51,14 | ||||
| 2025-05-07 | 13F | Prescott Group Capital Management, L.l.c. | 0 | -100,00 | 0 | |||||
| 2025-08-12 | 13F | CIBC Private Wealth Group, LLC | 1 000 | 0,00 | 2 | 0,00 | ||||
| 2025-08-14 | 13F | CIBC World Markets Inc. | 247 675 | -39,00 | 453 | -14,53 | ||||
| 2025-05-15 | 13F | Manatuck Hill Partners, LLC | 0 | -100,00 | 0 | |||||
| 2025-07-11 | 13F | Afg Fiduciary Services Limited Partnership | 15 000 | 0,00 | 26 | 36,84 | ||||
| 2025-08-14 | 13F | Manufacturers Life Insurance Company, The | 4 559 953 | 0,00 | 8 284 | 39,09 | ||||
| 2025-08-13 | 13F | Quantbot Technologies LP | 0 | -100,00 | 0 | |||||
| 2025-08-05 | 13F | Bank of New York Mellon Corp | 19 362 | 0,01 | 35 | 40,00 | ||||
| 2025-08-13 | 13F | Mackenzie Financial Corp | 513 946 | 5,97 | 940 | 48,50 | ||||
| 2025-08-28 | NP | GWX - SPDR(R) S&P(R) International Small Cap ETF | 395 059 | -1,57 | 721 | 37,40 | ||||
| 2025-07-14 | 13F | Sowell Financial Services LLC | 20 272 | 0,00 | 37 | 38,46 | ||||
| 2025-08-14 | 13F | Gotham Asset Management, LLC | 63 437 | 481,94 | 115 | 721,43 | ||||
| 2025-08-01 | 13F | Envestnet Asset Management Inc | 55 962 | 29,37 | 102 | 80,36 | ||||
| 2025-07-11 | 13F | Farther Finance Advisors, LLC | 1 214 | 4,30 | 2 | 100,00 | ||||
| 2025-05-14 | 13F | Northwestern Mutual Wealth Management Co | 0 | -100,00 | 0 | |||||
| 2025-08-28 | NP | QCSTRX - Stock Account Class R1 | 709 085 | -9,83 | 1 297 | 26,19 | ||||
| 2025-07-09 | 13F | HFG Wealth Management, LLC | 25 000 | 32 | ||||||
| 2025-08-14 | 13F | Visionary Wealth Advisors | 17 500 | 0,00 | 32 | 40,91 | ||||
| 2025-08-14 | 13F | Moore Capital Management, Lp | 2 002 110 | 3 644 | ||||||
| 2025-03-31 | NP | PDAVX - PineBridge Dynamic Asset Allocation Fund Investor Servicing Shares | 38 096 | 0,00 | 69 | -13,75 | ||||
| 2025-07-23 | 13F | Heathbridge Capital Management Ltd. | 100 000 | 0,00 | 183 | 40,00 | ||||
| 2025-08-14 | 13F | Kerrisdale Advisers, LLC | 86 800 | 0,00 | 158 | 40,18 | ||||
| 2025-08-27 | NP | HRSMX - Hood River Small-Cap Growth Fund Institutional Shares | 17 021 024 | -2,13 | 30 978 | 37,02 | ||||
| 2025-06-26 | NP | DFA INVESTMENT TRUST CO - The Canadian Small Company Series This fund is a listed as child fund of Dimensional Fund Advisors Lp and if that institution has disclosed ownership in this security, then these positions will not be double counted when calculating total shares and total value | 1 481 731 | 3 528,85 | 2 128 | 2 775,68 | ||||
| 2025-07-24 | 13F | Vantage Point Financial LLC | 18 620 | 0,00 | 34 | 37,50 | ||||
| 2025-08-29 | NP | FTWO - Strive FAANG 2.0 ETF | 39 542 | 19,48 | 72 | 67,44 |