Statistiques de base
| Valeur du portefeuille | $ 607 364 625 |
| Positions actuelles | 87 |
Dernières positions, performances, ASG (à partir des dépôts 13F, 13D)
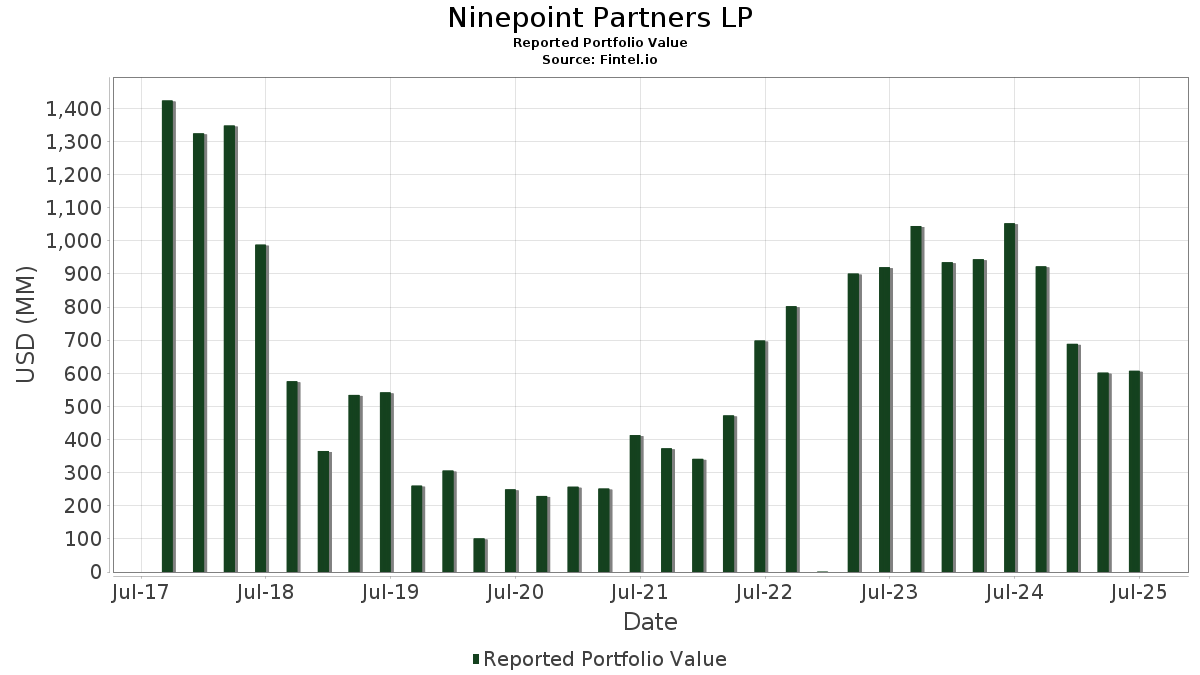
Ninepoint Partners LP a déclaré un total de 87 positions dans ses derniers dépôts auprès de la SEC. La valeur la plus récente du portefeuille est calculée à 607 364 625 USD. Les actifs sous gestion réels (ASG) sont cette valeur plus les liquidités (qui ne sont pas divulguées). Les principales positions de Ninepoint Partners LP sont Expand Energy Corporation (US:EXE) , EQT Corporation (US:EQT) , Range Resources Corporation (US:RRC) , Antero Resources Corporation (US:AR) , and iShares Trust - iShares S&P 100 ETF (US:OEF) . Les nouvelles positions de Ninepoint Partners LP incluent Eaton Corporation plc (US:ETN) , SAP SE - Depositary Receipt (Common Stock) (US:SAP) , Dell Technologies Inc. (US:DELL) , Equinox Gold Corp. (US:EQX) , and Circle Internet Group, Inc. (US:CRCL) .
Meilleures augmentations ce trimestre
Nous utilisons la variation de l'allocation du portefeuille car il s'agit de l'indicateur le plus significatif. Les changements peuvent être dus à des transactions ou à des variations de prix des actions.
| Titre | Actions (en millions) |
Valeur ($ en millions) |
% du portefeuille | ΔPortefeuille % |
|---|---|---|---|---|
| 1,50 | 61,01 | 10,0442 | 10,0442 | |
| 0,60 | 52,95 | 8,7180 | 8,7180 | |
| 1,40 | 56,39 | 9,2847 | 5,9240 | |
| 1,60 | 93,31 | 15,3634 | 2,0429 | |
| 0,30 | 7,77 | 1,2798 | 1,2798 | |
| 0,06 | 37,69 | 6,2053 | 0,8593 | |
| 0,80 | 93,55 | 15,4029 | 0,6014 | |
| 0,33 | 8,76 | 1,4431 | 0,4209 | |
| 0,01 | 1,75 | 0,2886 | 0,2886 | |
| 0,05 | 3,71 | 0,6111 | 0,2690 |
Principales baisses ce trimestre
Nous utilisons la variation de l'allocation du portefeuille car il s'agit de l'indicateur le plus significatif. Les changements peuvent être dus à des transactions ou à des variations de prix des actions.
| Titre | Actions (en millions) |
Valeur ($ en millions) |
% du portefeuille | ΔPortefeuille % |
|---|---|---|---|---|
| 0,09 | 2,84 | 0,4670 | -15,3528 | |
| 0,05 | 4,84 | 0,7973 | -1,2635 | |
| 0,00 | 0,00 | -1,0378 | ||
| 0,60 | 8,16 | 1,3435 | -0,9684 | |
| 0,15 | 4,25 | 0,7002 | -0,3047 | |
| 0,00 | 0,15 | 0,0248 | -0,1474 | |
| 0,35 | 4,77 | 0,7849 | -0,1359 | |
| 0,10 | 3,81 | 0,6278 | -0,1226 | |
| 0,05 | 3,23 | 0,5323 | -0,0666 | |
| 0,02 | 0,38 | 0,0626 | -0,0466 |
Déclarations 13F et dépôts de fonds
Ce formulaire a été déposé le 2025-08-05 pour la période de déclaration 2025-06-30. Cliquez sur l'icône du lien pour voir l'historique complet des transactions.
Mettre à niveau pour débloquer les données premium et exporter vers Excel ![]() .
.
| Titre | Type | Prix moyen de l'action | Actions (en millions) |
ΔActions (%) |
ΔActions (%) |
Valeur ($ en millions) |
Portefeuille (%) |
ΔPortefeuille (%) |
|
|---|---|---|---|---|---|---|---|---|---|
| EXE / Expand Energy Corporation | 0,80 | 0,00 | 93,55 | 5,05 | 15,4029 | 0,6014 | |||
| EQT / EQT Corporation | 1,60 | 6,67 | 93,31 | 16,43 | 15,3634 | 2,0429 | |||
| RRC / Range Resources Corporation | 1,50 | 61,01 | 10,0442 | 10,0442 | |||||
| AR / Antero Resources Corporation | 1,40 | 180,00 | 56,39 | 178,89 | 9,2847 | 5,9240 | |||
| OEF / iShares Trust - iShares S&P 100 ETF | Put | 0,60 | 52,95 | 8,7180 | 8,7180 | ||||
| SPY / SPDR S&P 500 ETF | Put | 0,06 | 6,09 | 37,69 | 17,17 | 6,2053 | 0,8593 | ||
| SPY / SPDR S&P 500 ETF | 0,05 | -4,92 | 32,25 | 5,02 | 5,3101 | 0,2059 | |||
| ALG / Alamo Group Inc. | 0,33 | 43,48 | 8,76 | 42,50 | 1,4431 | 0,4209 | |||
| KGCRF / Kinross Gold Corporation - Equity Right | 0,53 | 0,00 | 8,31 | 23,95 | 1,3686 | 0,2540 | |||
| CVE / Cenovus Energy Inc. | 0,60 | -40,00 | 8,16 | -41,34 | 1,3435 | -0,9684 | |||
| SOBO / South Bow Corporation | 0,30 | 7,77 | 1,2798 | 1,2798 | |||||
| AEM / Agnico Eagle Mines Limited | 0,06 | 0,00 | 7,57 | 9,71 | 1,2469 | 0,0995 | |||
| CHRD / Chord Energy Corporation | 0,05 | -54,55 | 4,84 | -60,95 | 0,7973 | -1,2635 | |||
| PR / Permian Resources Corporation | 0,35 | -12,50 | 4,77 | -13,95 | 0,7849 | -0,1359 | |||
| EBGEF / Enbridge Inc. - Preferred Stock | 0,10 | -1,93 | 4,68 | 0,32 | 0,7712 | -0,0049 | |||
| NOG / Northern Oil and Gas, Inc. | 0,15 | -25,00 | 4,25 | -29,67 | 0,7002 | -0,3047 | |||
| CNL / Collective Mining Ltd. | 0,39 | -6,10 | 4,21 | 18,22 | 0,6935 | 0,1013 | |||
| VZLA / Vizsla Silver Corp. | 1,40 | 19,93 | 4,12 | 55,33 | 0,6786 | 0,2376 | |||
| MFC / Manulife Financial Corporation | 0,13 | 20,82 | 4,02 | 23,96 | 0,6619 | 0,1229 | |||
| VNOM / Viper Energy, Inc. | 0,10 | 0,00 | 3,81 | -15,55 | 0,6278 | -0,1226 | |||
| CCJ / Cameco Corporation | 0,05 | 0,00 | 3,71 | 80,32 | 0,6111 | 0,2690 | |||
| CM / Canadian Imperial Bank of Commerce | 0,05 | -2,70 | 3,46 | 22,43 | 0,5697 | 0,0999 | |||
| RY / Royal Bank of Canada | 0,03 | -0,28 | 3,43 | 16,40 | 0,5645 | 0,0748 | |||
| NVDA / NVIDIA Corporation | 0,02 | 23,91 | 3,33 | 80,61 | 0,5490 | 0,2422 | |||
| SLF / Sun Life Financial Inc. | 0,05 | -22,68 | 3,23 | -10,30 | 0,5323 | -0,0666 | |||
| MSFT / Microsoft Corporation | 0,01 | 0,25 | 3,18 | 32,87 | 0,5238 | 0,1257 | |||
| TU / TELUS Corporation | 0,19 | -3,54 | 3,08 | 8,03 | 0,5074 | 0,0333 | |||
| IAG / IAMGOLD Corporation | 0,42 | 0,00 | 3,08 | 17,57 | 0,5069 | 0,0718 | |||
| SU / Suncor Energy Inc. | 0,08 | 5,61 | 3,03 | 2,16 | 0,4994 | 0,0058 | |||
| FTS / Fortis Inc. | 0,06 | -10,80 | 2,91 | -6,57 | 0,4796 | -0,0387 | |||
| CNQ / Canadian Natural Resources Limited | 0,09 | -97,08 | 2,84 | -97,02 | 0,4670 | -15,3528 | |||
| NXE / NexGen Energy Ltd. | 0,38 | 0,00 | 2,64 | 54,57 | 0,4342 | 0,1506 | |||
| FCX / Freeport-McMoRan Inc. | 0,06 | 9,09 | 2,60 | 24,93 | 0,4282 | 0,0822 | |||
| AMT / American Tower Corporation | 0,01 | 0,00 | 2,60 | 1,57 | 0,4273 | 0,0026 | |||
| WCN / Waste Connections, Inc. | 0,01 | 0,00 | 2,24 | -4,32 | 0,3680 | -0,0203 | |||
| WPM / Wheaton Precious Metals Corp. | 0,02 | 0,00 | 2,19 | 15,69 | 0,3606 | 0,0459 | |||
| TRP / TC Energy Corporation | 0,04 | 0,00 | 2,18 | 3,31 | 0,3594 | 0,0083 | |||
| COIN / Coinbase Global, Inc. | 0,01 | -16,28 | 2,16 | 70,37 | 0,3561 | 0,1451 | |||
| UNP / Union Pacific Corporation | 0,01 | 11,20 | 2,00 | 8,30 | 0,3289 | 0,0223 | |||
| SBAC / SBA Communications Corporation | 0,01 | 0,00 | 1,99 | 6,75 | 0,3282 | 0,0178 | |||
| TLN / Talen Energy Corporation | 0,01 | -11,09 | 1,93 | 29,47 | 0,3183 | 0,0701 | |||
| CEG / Constellation Energy Corporation | 0,01 | 1,75 | 0,2886 | 0,2886 | |||||
| AVGO / Broadcom Inc. | 0,01 | 12,03 | 1,67 | 84,50 | 0,2743 | 0,1242 | |||
| TRGP / Targa Resources Corp. | 0,01 | 14,60 | 1,53 | -0,45 | 0,2526 | -0,0036 | |||
| LNG / Cheniere Energy, Inc. | 0,01 | -6,84 | 1,53 | -1,98 | 0,2522 | -0,0075 | |||
| CP / Canadian Pacific Kansas City Limited | 0,02 | 0,00 | 1,52 | 12,94 | 0,2501 | 0,0265 | |||
| DUK / Duke Energy Corporation | 0,01 | 4,30 | 1,48 | 0,88 | 0,2443 | -0,0001 | |||
| AEP / American Electric Power Company, Inc. | 0,01 | 8,21 | 1,48 | 2,77 | 0,2441 | 0,0043 | |||
| PPL / PPL Corporation | 0,04 | 13,09 | 1,46 | 6,10 | 0,2408 | 0,0118 | |||
| NI / NiSource Inc. | 0,04 | -7,29 | 1,45 | -6,74 | 0,2395 | -0,0197 | |||
| HOOD / Robinhood Markets, Inc. | 0,02 | 25,65 | 1,45 | 182,68 | 0,2394 | 0,1539 | |||
| CMS / CMS Energy Corporation | 0,02 | 6,73 | 1,44 | -1,58 | 0,2367 | -0,0060 | |||
| ERO / Ero Copper Corp. | 0,09 | 0,00 | 1,43 | 39,03 | 0,2358 | 0,0646 | |||
| ET / Energy Transfer LP - Limited Partnership | 0,08 | 0,00 | 1,43 | -2,46 | 0,2353 | -0,0083 | |||
| EQIX / Equinix, Inc. | 0,00 | 3,49 | 1,42 | 1,00 | 0,2330 | 0,0000 | |||
| PAASF / Pan American Silver Corp. - Equity Right | 0,05 | 0,00 | 1,35 | 10,00 | 0,2228 | 0,0182 | |||
| AEE / Ameren Corporation | 0,01 | 0,00 | 1,34 | -4,35 | 0,2210 | -0,0122 | |||
| PYPL / PayPal Holdings, Inc. | 0,02 | -14,05 | 1,24 | -2,06 | 0,2038 | -0,0063 | |||
| JPM / JPMorgan Chase & Co. | 0,00 | 2,28 | 1,14 | 20,82 | 0,1884 | 0,0311 | |||
| ORCL / Oracle Corporation | 0,01 | 1,14 | 0,1869 | 0,1869 | |||||
| META / Meta Platforms, Inc. | 0,00 | 3,79 | 1,09 | 32,89 | 0,1797 | 0,0432 | |||
| AMZN / Amazon.com, Inc. | 0,00 | 7,47 | 0,99 | 23,94 | 0,1637 | 0,0304 | |||
| GOOG / Alphabet Inc. | 0,01 | 10,20 | 0,99 | 25,06 | 0,1628 | 0,0315 | |||
| V / Visa Inc. | 0,00 | -6,69 | 0,99 | -5,47 | 0,1623 | -0,0110 | |||
| RBLX / Roblox Corporation | 0,01 | 0,00 | 0,98 | 80,55 | 0,1621 | 0,0714 | |||
| WMT / Walmart Inc. | 0,01 | 3,37 | 0,95 | 15,21 | 0,1560 | 0,0192 | |||
| COST / Costco Wholesale Corporation | 0,00 | 3,53 | 0,90 | 8,32 | 0,1480 | 0,0101 | |||
| GSCE / GS Connect S&P GSCI Enhanced Commodity Total Return ETN | 0,00 | -4,82 | 0,85 | 23,30 | 0,1403 | 0,0254 | |||
| APH / Amphenol Corporation | 0,01 | 0,85 | 0,1402 | 0,1402 | |||||
| BSX / Boston Scientific Corporation | 0,01 | -7,13 | 0,81 | -1,11 | 0,1327 | -0,0028 | |||
| HUT / Hut 8 Corp. | 0,04 | 0,00 | 0,80 | 60,16 | 0,1311 | 0,0484 | |||
| MA / Mastercard Incorporated | 0,00 | 9,46 | 0,78 | 12,09 | 0,1284 | 0,0129 | |||
| UEC / Uranium Energy Corp. | 0,11 | 0,00 | 0,77 | 42,19 | 0,1261 | 0,0366 | |||
| BLK / BlackRock, Inc. | 0,00 | 0,00 | 0,76 | 10,89 | 0,1259 | 0,0113 | |||
| GEV / GE Vernova Inc. | 0,00 | -38,16 | 0,76 | 7,30 | 0,1258 | 0,0073 | |||
| AMD / Advanced Micro Devices, Inc. | 0,01 | 40,84 | 0,76 | 94,85 | 0,1245 | 0,0599 | |||
| TJX / The TJX Companies, Inc. | 0,01 | -2,89 | 0,74 | -1,59 | 0,1224 | -0,0031 | |||
| ETN / Eaton Corporation plc | 0,00 | 0,74 | 0,1224 | 0,1224 | |||||
| SAP / SAP SE - Depositary Receipt (Common Stock) | 0,00 | 0,73 | 0,1207 | 0,1207 | |||||
| DELL / Dell Technologies Inc. | 0,01 | 0,71 | 0,1166 | 0,1166 | |||||
| TMUS / T-Mobile US, Inc. | 0,00 | 0,00 | 0,68 | -10,66 | 0,1119 | -0,0146 | |||
| CME / CME Group Inc. | 0,00 | 0,00 | 0,58 | 3,91 | 0,0962 | 0,0027 | |||
| DNN / Denison Mines Corp. | 0,23 | 0,00 | 0,43 | 40,00 | 0,0704 | 0,0196 | |||
| MAG / MAG Silver Corp. | 0,02 | -58,14 | 0,38 | -42,16 | 0,0626 | -0,0466 | |||
| EQX / Equinox Gold Corp. | 0,05 | 0,38 | 0,0620 | 0,0620 | |||||
| CRCL / Circle Internet Group, Inc. | 0,00 | 0,27 | 0,0448 | 0,0448 | |||||
| AAPL / Apple Inc. | 0,00 | -84,26 | 0,15 | -85,51 | 0,0248 | -0,1474 | |||
| CIVI / Civitas Resources, Inc. | 0,00 | -100,00 | 0,00 | 0,0000 | |||||
| XYZ / Block, Inc. | 0,00 | -100,00 | 0,00 | 0,0000 | |||||
| BTE / Baytex Energy Corp. | 0,00 | -100,00 | 0,00 | -100,00 | -1,0378 | ||||
| SO / The Southern Company | 0,00 | -100,00 | 0,00 | 0,0000 | |||||
| NSC / Norfolk Southern Corporation | 0,00 | -100,00 | 0,00 | 0,0000 | |||||
| LLY / Eli Lilly and Company | 0,00 | -100,00 | 0,00 | 0,0000 | |||||
| HWM / Howmet Aerospace Inc. | 0,00 | -100,00 | 0,00 | 0,0000 | |||||
| DVN / Devon Energy Corporation | 0,00 | -100,00 | 0,00 | 0,0000 | |||||
| C / Citigroup Inc. | 0,00 | -100,00 | 0,00 | 0,0000 | |||||
| PEG / Public Service Enterprise Group Incorporated | 0,00 | -100,00 | 0,00 | 0,0000 | |||||
| ABBV / AbbVie Inc. | 0,00 | -100,00 | 0,00 | 0,0000 | |||||
| VRN / Veren Inc. | 0,00 | -100,00 | 0,00 | 0,0000 | |||||
| GFR / Greenfire Resources Ltd. | 0,00 | -100,00 | 0,00 | 0,0000 | |||||
| BAC / Bank of America Corporation | 0,00 | -100,00 | 0,00 | 0,0000 | |||||
| HD / The Home Depot, Inc. | 0,00 | -100,00 | 0,00 | 0,0000 |