Statistiques de base
| Propriétaires institutionnels | 248 total, 245 long only, 0 short only, 3 long/short - change of 5,53% MRQ |
| Allocation moyenne du portefeuille | 0.1155 % - change of 15,64% MRQ |
| Actions institutionnelles (Long) | 19 187 544 (ex 13D/G) - change of 1,24MM shares 6,93% MRQ |
| Valeur institutionnelle (Long) | $ 513 369 USD ($1000) |
Participation institutionnels et actionnaires
Eni S.p.A. - Depositary Receipt (Common Stock) (US:E) détient 248 des propriétaires institutionnels et des actionnaires qui ont déposé des formulaires 13D/G ou 13F auprès de la Securities Exchange Commission (SEC). Ces institutions détiennent un total de 19,187,544 actions. Les principaux actionnaires incluent Morgan Stanley, Natixis Advisors, L.p., Goldman Sachs Group Inc, BlackRock, Inc., Bank Of America Corp /de/, Northern Trust Corp, Brandes Investment Partners, Lp, Fmr Llc, Raymond James Financial Inc, and American Century Companies Inc .
Eni S.p.A. - Depositary Receipt (Common Stock) (NYSE:E) la structure de l'actionnariat institutionnel indique les positions actuelles des institutions et des fonds dans l'entreprise, ainsi que les derniers changements dans le volume des positions. Les principaux actionnaires peuvent être des investisseurs individuels, des fonds communs de placement, des fonds spéculatifs ou des institutions. L'annexe 13D indique que l'investisseur détient (ou a détenu) plus de 5 % de l'entreprise et qu'il a l'intention (ou a eu l'intention) de poursuivre activement un changement de stratégie commerciale. L'annexe 13G indique un investissement passif de plus de 5 %.
The share price as of September 5, 2025 is 34,18 / share. Previously, on September 9, 2024, the share price was 31,11 / share. This represents an increase of 9,87% over that period.

Indice de confiance des fonds
L'indice de confiance des fonds (anciennement score d'accumulation de participation) trouve les actions qui sont les plus achetées par les fonds. Il est le résultat d'un modèle quantitatif sophistiqué à plusieurs facteurs qui identifie les entreprises avec les niveaux les plus élevés d'accumulation institutionnelle. Le modèle de notation utilise une combinaison de l'augmentation totale des propriétaires déclarés, des variations des allocations de portefeuille chez ces propriétaires et d'autres indicateurs. Le chiffre varie de 0 à 100, les chiffres plus élevés indiquant un niveau d'accumulation plus élevé par rapport aux autres entreprises, 50 étant la moyenne.
Fréquence de mise à jour : Quotidienne
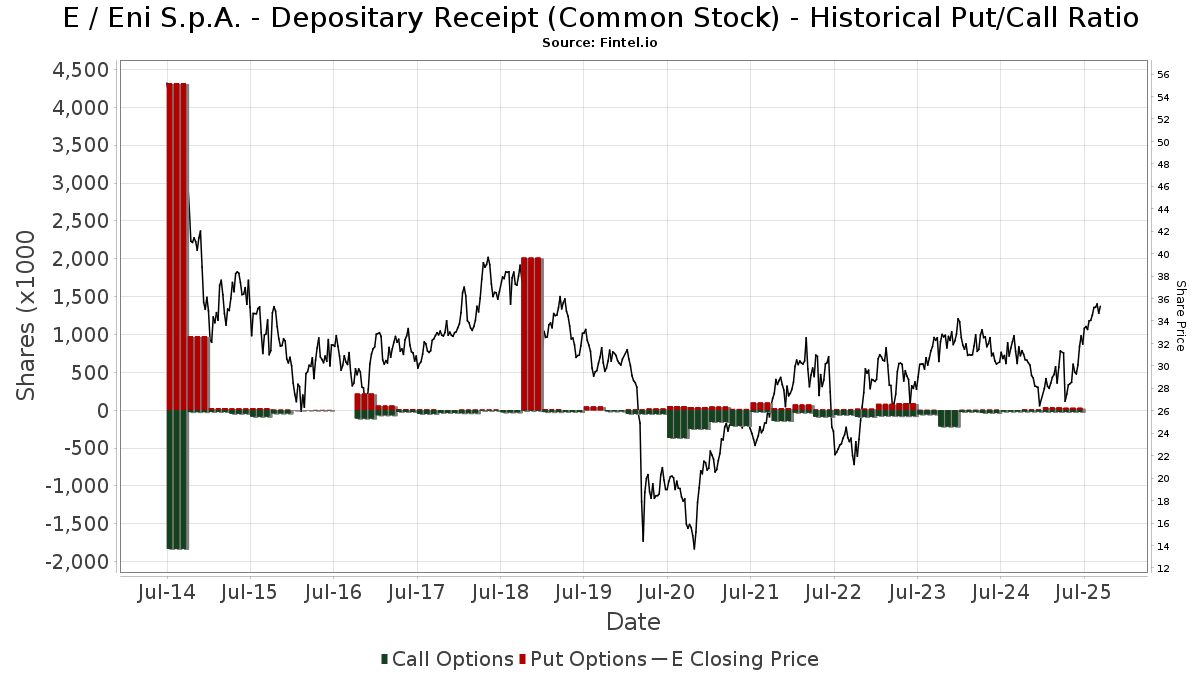
Ratio put/call institutionnel
En plus de signaler les actions et les dettes standard, les institutions ayant plus de 100 millions d'actifs sous gestion doivent également divulguer leurs positions en options de vente et d'achat. Étant donné que les options de vente indiquent généralement une confiance négative, et les options d'achat indiquent une confiance positive, nous pouvons avoir une idée de la confiance institutionnelle globale en traçant le ratio des ventes à découvert par rapport aux achats d'options. Le graphique à droite trace l'historique du ratio des ventes à découvert/achats d'options pour cet instrument.
L'utilisation du ratio put/call comme indicateur de la confiance des investisseurs permet de pallier à l'une des principales lacunes de l'utilisation de la participation institutionnelle totale, à savoir qu'une part importante des actifs sous gestion est investie passivement pour suivre les indices. Les fonds gérés passivement n'achètent généralement pas d'options, de sorte que l'indicateur du ratio put/call suit de plus près la confiance des fonds gérés activement.
Déclarations 13F et NPORT
Les détails des déclarations 13F sont gratuits. Les détails des déclarations NP nécessitent une adhésion premium. Les lignes vertes indiquent de nouvelles positions. Les lignes rouges indiquent des positions clôturées. Cliquez sur l'icône du lien pour voir l'historique complet des transactions.
Mettre à niveau
pour débloquer des données premium et les exporter vers Excel ![]() .
.
| Date de dépôt | Source | Investisseur | Type | Prix moyen (Est) |
Actions | Δ Actions (%) |
Valeur déclarée (1000 $) |
Δ Valeur (%) |
Allocation de portefeuille (%) |
|
|---|---|---|---|---|---|---|---|---|---|---|
| 2025-08-14 | 13F | Boston Private Wealth Llc | 0 | -100,00 | 0 | |||||
| 2025-08-14 | 13F | Wetherby Asset Management Inc | 15 724 | 0,58 | 510 | 19,20 | ||||
| 2025-08-07 | 13F | Parkside Financial Bank & Trust | 653 | -35,85 | 21 | -32,26 | ||||
| 2025-08-04 | 13F | Simon Quick Advisors, Llc | 6 453 | 209 | ||||||
| 2025-08-14 | 13F | Royal Bank Of Canada | 108 007 | 55,98 | 3 503 | 63,62 | ||||
| 2025-08-13 | 13F | Twin Peaks Wealth Advisors, LLC | 528 | 18 | ||||||
| 2025-08-11 | 13F | Rothschild Investment Llc | 470 | -27,13 | 15 | -21,05 | ||||
| 2025-07-24 | 13F | IFP Advisors, Inc | 581 | 37,35 | 19 | 38,46 | ||||
| 2025-08-13 | 13F | Cresset Asset Management, LLC | 6 205 | -31,96 | 201 | -29,72 | ||||
| 2025-08-21 | NP | HAP - VanEck Vectors Natural Resources ETF | 22 131 | 6,69 | 717 | 11,86 | ||||
| 2025-05-02 | 13F | Capital A Wealth Management, LLC | 109 | 0,00 | 3 | 50,00 | ||||
| 2025-08-12 | 13F | RD Lewis Holdings, Inc. | 67 234 | 2 316 | ||||||
| 2025-06-26 | NP | LSVMX - LSV U.S. MANAGED VOLATILITY FUND Institutional Class Shares | 6 900 | 0,00 | 196 | 1,03 | ||||
| 2025-08-28 | NP | GQFPX - GQG PARTNERS GLOBAL QUALITY DIVIDEND INCOME FUND Investor Shares | 73 632 | 17,64 | 2 387 | 23,36 | ||||
| 2025-08-13 | 13F | M&t Bank Corp | 6 417 | 208 | ||||||
| 2025-07-28 | NP | AVDE - Avantis International Equity ETF This fund is a listed as child fund of American Century Companies Inc and if that institution has disclosed ownership in this security, then these positions will not be double counted when calculating total shares and total value | 305 222 | 11,76 | 9 022 | 14,04 | ||||
| 2025-08-19 | 13F | Cape Investment Advisory, Inc. | 2 500 | -7,41 | 81 | -2,41 | ||||
| 2025-08-08 | 13F | Cetera Investment Advisers | 11 232 | 8,40 | 364 | 13,75 | ||||
| 2025-08-11 | 13F | GW&K Investment Management, LLC | 131 | 0,00 | 0 | |||||
| 2025-08-13 | 13F | Barclays Plc | 0 | -100,00 | 0 | |||||
| 2025-08-12 | 13F | Park Square Financial Group, LLC | 100 | 3 | ||||||
| 2025-07-14 | 13F | Toth Financial Advisory Corp | 110 | 4 | ||||||
| 2025-08-13 | 13F | Cerity Partners LLC | 28 403 | -0,25 | 921 | 4,55 | ||||
| 2025-08-06 | 13F | SOUTH STATE Corp | 374 | 10,65 | 12 | 20,00 | ||||
| 2025-08-08 | 13F | SG Americas Securities, LLC | 0 | -100,00 | 0 | |||||
| 2025-08-04 | 13F | Hantz Financial Services, Inc. | 46 205 | 6,24 | 1 | 0,00 | ||||
| 2025-09-04 | 13F | Beacon Capital Management, Inc. | 1 | 0 | ||||||
| 2025-06-30 | NP | CVY - Invesco Zacks Multi-Asset Income ETF This fund is a listed as child fund of Invesco Ltd. and if that institution has disclosed ownership in this security, then these positions will not be double counted when calculating total shares and total value | 28 844 | -13,32 | 819 | -12,50 | ||||
| 2025-07-09 | 13F | Bruce G. Allen Investments, LLC | 355 | 10,59 | 12 | 22,22 | ||||
| 2025-08-13 | 13F | Flow Traders U.s. Llc | 0 | -100,00 | 0 | |||||
| 2025-06-26 | NP | DFIEX - International Core Equity Portfolio - Institutional Class This fund is a listed as child fund of Dimensional Fund Advisors Lp and if that institution has disclosed ownership in this security, then these positions will not be double counted when calculating total shares and total value | 35 842 | 0,00 | 1 018 | 0,99 | ||||
| 2025-07-25 | 13F | We Are One Seven, LLC | 14 394 | 467 | ||||||
| 2025-08-11 | 13F | Cornerstone Planning Group LLC | 122 | 577,78 | 4 | |||||
| 2025-08-08 | 13F | Hartland & Co., LLC | 0 | -100,00 | 0 | |||||
| 2025-08-13 | 13F | Kayne Anderson Rudnick Investment Management Llc | 5 | 0,00 | 0 | |||||
| 2025-08-13 | 13F | Natixis Advisors, L.p. | 2 921 064 | 5,11 | 95 | 10,59 | ||||
| 2025-07-14 | 13F | GAMMA Investing LLC | 4 869 | 44,22 | 158 | 50,96 | ||||
| 2025-08-06 | 13F | Harvest Portfolios Group Inc. | 51 200 | -20,35 | 1 660 | -16,55 | ||||
| 2025-07-25 | 13F | Allspring Global Investments Holdings, LLC | 7 817 | 1,32 | 259 | 7,95 | ||||
| 2025-08-14 | 13F | Bank Of America Corp /de/ | 945 453 | -7,54 | 30 652 | -3,08 | ||||
| 2025-07-28 | 13F | Ativo Capital Management LLC | 35 566 | -2,61 | 1 153 | 2,13 | ||||
| 2025-08-26 | NP | RPAR - RPAR Risk Parity ETF | 22 286 | -6,20 | 723 | -1,63 | ||||
| 2025-08-14 | 13F | CoreCap Advisors, LLC | 717 | 4 117,65 | 23 | |||||
| 2025-08-14 | 13F | Stifel Financial Corp | 49 412 | 20,16 | 1 602 | 25,96 | ||||
| 2025-08-14 | 13F/A | Skopos Labs, Inc. | 8 219 | 369,12 | 266 | 392,59 | ||||
| 2025-07-28 | 13F | Sagespring Wealth Partners, Llc | 6 817 | 221 | ||||||
| 2025-08-01 | 13F | Motco | 100 | 3 | ||||||
| 2025-08-28 | NP | Amplify ETF Trust - Amplify Natural Resources Dividend Income ETF | 4 648 | -41,59 | 151 | -39,02 | ||||
| 2025-08-12 | 13F | Manchester Capital Management LLC | 769 | 36,59 | 25 | 41,18 | ||||
| 2025-08-14 | 13F | CIBC World Markets Inc. | 130 923 | 0,11 | 4 245 | 4,92 | ||||
| 2025-08-13 | 13F | Rsm Us Wealth Management Llc | 8 815 | 36,62 | 286 | 41,09 | ||||
| 2025-07-11 | 13F | Pinnacle Bancorp, Inc. | 251 | 0,00 | 8 | 14,29 | ||||
| 2025-08-14 | 13F | Sei Investments Co | 10 226 | 11,25 | 332 | 16,55 | ||||
| 2025-03-17 | NP | ABLD - Donoghue Forlines Yield Enhanced Real Asset ETF | 3 756 | -50,77 | 106 | -54,74 | ||||
| 2025-07-28 | 13F | Private Wealth Asset Management, LLC | 0 | -100,00 | 0 | |||||
| 2025-07-30 | 13F | Cullen/frost Bankers, Inc. | 47 | 0,00 | 2 | 0,00 | ||||
| 2025-04-14 | 13F | Old National Bancorp /in/ | 0 | -100,00 | 0 | -100,00 | ||||
| 2025-07-08 | 13F | Nbc Securities, Inc. | 9 669 | -0,20 | 0 | |||||
| 2025-07-14 | 13F | AdvisorNet Financial, Inc | 77 | 2 | ||||||
| 2025-07-25 | 13F | Yousif Capital Management, Llc | 28 181 | 10,34 | 914 | 15,72 | ||||
| 2025-05-09 | 13F | R Squared Ltd | 0 | -100,00 | 0 | |||||
| 2025-08-14 | 13F | Quantinno Capital Management LP | 202 792 | 44,89 | 6 575 | 51,89 | ||||
| 2025-08-12 | 13F | Ci Investments Inc. | 247 865 | -3,18 | 8 | 14,29 | ||||
| 2025-08-14 | 13F | Mercer Global Advisors Inc /adv | 26 638 | 34,01 | 864 | 40,55 | ||||
| 2025-08-14 | 13F | Sunbelt Securities, Inc. | 200 | 0,00 | 5 | -16,67 | ||||
| 2025-08-04 | 13F | Creative Financial Designs Inc /adv | 46 | 91,67 | 1 | |||||
| 2025-07-08 | 13F | Arlington Trust Co LLC | 17 | 1 | ||||||
| 2025-08-08 | 13F | Crossmark Global Holdings, Inc. | 108 747 | -0,09 | 3 526 | 4,72 | ||||
| 2025-04-29 | 13F | Callan Capital, LLC | 26 328 | 76,67 | 814 | 100,00 | ||||
| 2025-08-14 | 13F | Jane Street Group, Llc | 0 | -100,00 | 0 | |||||
| 2025-08-12 | 13F | O'shaughnessy Asset Management, Llc | 90 628 | 20,97 | 2 938 | 26,80 | ||||
| 2025-08-13 | 13F | Bare Financial Services, Inc | 250 | 8 | ||||||
| 2025-07-29 | 13F | Salomon & Ludwin, LLC | 23 | 1 | ||||||
| 2025-07-24 | 13F | CWM Advisors, LLC | 6 842 | 222 | ||||||
| 2025-08-13 | 13F | EverSource Wealth Advisors, LLC | 7 707 | 285,74 | 250 | 308,20 | ||||
| 2025-07-30 | 13F | Bleakley Financial Group, LLC | 23 292 | 16,16 | 755 | 21,77 | ||||
| 2025-05-15 | 13F | CAPROCK Group, Inc. | 18 357 | 120,21 | 577 | 153,07 | ||||
| 2025-07-11 | 13F/A | Umb Bank N A/mo | 111 | -82,92 | 4 | -85,00 | ||||
| 2025-07-17 | 13F | Albion Financial Group /ut | 0 | -100,00 | 0 | -100,00 | ||||
| 2025-07-25 | 13F | Avion Wealth | 0 | -100,00 | 0 | |||||
| 2025-08-15 | 13F | CI Private Wealth, LLC | 53 213 | 8,50 | 1 725 | 13,79 | ||||
| 2025-07-24 | 13F | Callan Family Office, LLC | 56 281 | 58,48 | 1 825 | 66,12 | ||||
| 2025-07-25 | 13F | Sequoia Financial Advisors, LLC | 29 558 | 131,75 | 958 | 143,15 | ||||
| 2025-08-15 | 13F | Morgan Stanley | 3 079 410 | 1,97 | 99 835 | 6,88 | ||||
| 2025-08-14 | 13F | Citadel Advisors Llc | Call | 10 900 | -46,31 | 353 | -43,70 | |||
| 2025-07-24 | 13F | Us Bancorp \de\ | 41 775 | -18,70 | 1 354 | -14,79 | ||||
| 2025-08-05 | 13F | Key FInancial Inc | 135 | 0,00 | 4 | 0,00 | ||||
| 2025-08-01 | 13F | Boyd Watterson Asset Management Llc/oh | 258 | 0,00 | 8 | 14,29 | ||||
| 2025-08-12 | 13F | SRS Capital Advisors, Inc. | 995 | 1 030,68 | 32 | 1 500,00 | ||||
| 2025-08-05 | 13F | Bank of New York Mellon Corp | 49 025 | 14,57 | 1 589 | 20,11 | ||||
| 2025-08-25 | 13F/A | Promus Capital, LLC | 50 | -50,00 | 2 | -66,67 | ||||
| 2025-08-13 | 13F | Northern Trust Corp | 911 963 | 13,83 | 29 566 | 19,31 | ||||
| 2025-05-15 | 13F/A | Orion Portfolio Solutions, LLC | 71 238 | 1,07 | 2 203 | 14,26 | ||||
| 2025-08-08 | 13F | Massachusetts Financial Services Co /ma/ | 473 461 | 16,72 | 15 350 | 22,34 | ||||
| 2025-08-14 | 13F | Smartleaf Asset Management LLC | 4 676 | -32,08 | 152 | -29,11 | ||||
| 2025-07-22 | 13F | Checchi Capital Advisers, LLC | 10 593 | -13,95 | 343 | -9,74 | ||||
| 2025-08-11 | 13F | Lsv Asset Management | 37 400 | -25,79 | 1 | 0,00 | ||||
| 2025-07-28 | NP | AVDEX - Avantis International Equity Fund Institutional Class This fund is a listed as child fund of American Century Companies Inc and if that institution has disclosed ownership in this security, then these positions will not be double counted when calculating total shares and total value | 21 007 | 0,00 | 621 | 1,97 | ||||
| 2025-08-14 | 13F | Citadel Advisors Llc | 37 856 | 146,11 | 1 227 | 158,32 | ||||
| 2025-07-11 | 13F | Farther Finance Advisors, LLC | 829 | 2,73 | 27 | 4,00 | ||||
| 2025-08-14 | 13F | Citadel Advisors Llc | Put | 24 600 | -14,88 | 798 | -10,75 | |||
| 2025-08-14 | 13F | Wiley Bros.-aintree Capital, Llc | 9 954 | 339 | ||||||
| 2025-08-14 | 13F | Glen Eagle Advisors, LLC | 1 820 | 18 100,00 | 59 | |||||
| 2025-07-31 | 13F | Carnegie Capital Asset Management, LLC | 8 745 | 1,16 | 284 | 23,58 | ||||
| 2025-08-14 | 13F | Susquehanna International Group, Llp | 47 836 | 458,77 | 1 551 | 487,12 | ||||
| 2025-05-15 | 13F | Old Mission Capital Llc | 0 | -100,00 | 0 | -100,00 | ||||
| 2025-08-14 | 13F | DecisionPoint Financial, LLC | 67 | 0,00 | 2 | 0,00 | ||||
| 2025-07-30 | 13F | Rehmann Capital Advisory Group | 13 780 | -0,70 | 447 | 3,96 | ||||
| 2025-05-14 | 13F | Van Hulzen Asset Management, LLC | 0 | -100,00 | 0 | |||||
| 2025-08-11 | 13F | United Capital Financial Advisers, Llc | 6 898 | 0,80 | 224 | 5,69 | ||||
| 2025-07-28 | 13F | BRYN MAWR TRUST Co | 234 | 0,00 | 8 | 0,00 | ||||
| 2025-08-15 | 13F | Provenance Wealth Advisors, LLC | 0 | -100,00 | 0 | |||||
| 2025-05-05 | 13F | Lindbrook Capital, Llc | 2 387 | 5,11 | 74 | 17,74 | ||||
| 2025-05-15 | 13F | Glenmede Trust Co Na | 6 992 | -5,21 | 216 | 7,46 | ||||
| 2025-08-12 | 13F | MAI Capital Management | 1 113 | 2 488,37 | 36 | 3 500,00 | ||||
| 2025-08-13 | 13F | Manning & Napier Advisors Llc | 123 482 | 6,89 | 4 003 | 12,03 | ||||
| 2025-08-18 | 13F | Geneos Wealth Management Inc. | 597 | -9,55 | 19 | -5,00 | ||||
| 2025-08-14 | 13F | Mpwm Advisory Solutions, Llc | 114 | 0,00 | 4 | 0,00 | ||||
| 2025-08-04 | 13F | Assetmark, Inc | 72 | 7 100,00 | 2 | |||||
| 2025-07-17 | 13F | Greenleaf Trust | 12 459 | 1,14 | 404 | 5,77 | ||||
| 2025-08-07 | 13F | Sierra Ocean, Llc | 481 | 8,33 | 16 | 15,38 | ||||
| 2025-07-21 | 13F | Hilltop National Bank | 4 285 | 139 | ||||||
| 2025-05-06 | 13F | Venturi Wealth Management, LLC | 0 | -100,00 | 0 | -100,00 | ||||
| 2025-07-15 | 13F | Td Private Client Wealth Llc | 825 | -19,04 | 27 | -16,13 | ||||
| 2025-08-13 | 13F | Fisher Asset Management, LLC | 143 622 | 25,22 | 4 656 | 31,27 | ||||
| 2025-05-15 | 13F | Optiver Holding B.V. | 0 | -100,00 | 0 | |||||
| 2025-07-29 | 13F | Private Trust Co Na | 229 | 0,00 | 7 | 0,00 | ||||
| 2025-08-26 | NP | UPAR - UPAR Ultra Risk Parity ETF | 3 277 | -10,85 | 106 | -6,19 | ||||
| 2025-08-11 | 13F | Citigroup Inc | 3 756 | 58,28 | 122 | 65,75 | ||||
| 2025-08-13 | 13F | Invesco Ltd. | 0 | -100,00 | 0 | |||||
| 2025-08-14 | 13F | Glenmede Investment Management, LP | 13 131 | 426 | ||||||
| 2025-08-06 | 13F | Golden State Wealth Management, LLC | 601 | 0,00 | 19 | 5,56 | ||||
| 2025-08-14 | 13F | Syon Capital Llc | 0 | -100,00 | 0 | -100,00 | ||||
| 2025-07-14 | 13F | Armstrong Advisory Group, Inc | 43 | 1 | ||||||
| 2025-08-14 | 13F | Vident Advisory, LLC | 36 881 | 4,69 | 1 196 | 9,73 | ||||
| 2025-08-12 | 13F | AlphaCore Capital LLC | 575 | 19 | ||||||
| 2025-07-22 | 13F | DAVENPORT & Co LLC | 10 373 | 1,10 | 336 | 5,99 | ||||
| 2025-08-07 | 13F | Montag A & Associates Inc | 242 | 0,00 | 8 | 0,00 | ||||
| 2025-08-12 | 13F | Advisors Asset Management, Inc. | 63 270 | -3,41 | 2 051 | 1,28 | ||||
| 2025-08-13 | 13F/A | StoneX Group Inc. | 0 | -100,00 | 0 | -100,00 | ||||
| 2025-08-11 | 13F | Inspire Advisors, LLC | 16 817 | -5,43 | 545 | -0,91 | ||||
| 2025-08-11 | 13F | Inspire Advisors, LLC | Call | 100 | 3 | |||||
| 2025-08-05 | 13F | Bank Of Montreal /can/ | 16 012 | 0,29 | 519 | 5,27 | ||||
| 2025-08-01 | 13F | Envestnet Asset Management Inc | 146 962 | -12,38 | 4 765 | -8,16 | ||||
| 2025-08-14 | 13F | Aquatic Capital Management LLC | 49 132 | 132,36 | 1 593 | 143,43 | ||||
| 2025-07-21 | 13F | Barrett & Company, Inc. | 325 | 11 | ||||||
| 2025-08-14 | 13F | Atomi Financial Group, Inc. | 9 808 | 1,23 | 318 | 6,02 | ||||
| 2025-07-28 | NP | AVIV - Avantis International Large Cap Value ETF This fund is a listed as child fund of American Century Companies Inc and if that institution has disclosed ownership in this security, then these positions will not be double counted when calculating total shares and total value | 137 960 | 27,69 | 4 078 | 30,29 | ||||
| 2025-07-24 | 13F | Jfs Wealth Advisors, Llc | 1 010 | -5,87 | 33 | -3,03 | ||||
| 2025-07-28 | 13F | Rosenberg Matthew Hamilton | 1 871 | 0,00 | 61 | 5,26 | ||||
| 2025-08-11 | 13F | Principal Securities, Inc. | 1 150 | 83,12 | 37 | 117,65 | ||||
| 2025-08-14 | 13F | Barometer Capital Management Inc. | 3 653 | 0,00 | 118 | 5,36 | ||||
| 2025-05-15 | 13F | Lighthouse Investment Partners, LLC | 0 | -100,00 | 0 | |||||
| 2025-08-11 | 13F | Private Advisor Group, LLC | 8 740 | -19,08 | 283 | -15,27 | ||||
| 2025-08-13 | 13F | Northwestern Mutual Wealth Management Co | 445 | 14 | ||||||
| 2025-08-13 | 13F | Jump Financial, LLC | 0 | -100,00 | 0 | |||||
| 2025-04-21 | 13F | Nelson, Van Denburg & Campbell Wealth Management Group, LLC | 0 | -100,00 | 0 | |||||
| 2025-07-15 | 13F | Ballentine Partners, LLC | 11 464 | 48,15 | 372 | 55,23 | ||||
| 2025-07-24 | 13F | Ronald Blue Trust, Inc. | 16 434 | -1,23 | 533 | 3,50 | ||||
| 2025-08-12 | 13F | LPL Financial LLC | 47 466 | 19,88 | 1 539 | 25,65 | ||||
| 2025-07-09 | 13F | Aaron Wealth Advisors LLC | 10 536 | 32,70 | 342 | 39,18 | ||||
| 2025-08-14 | 13F | Ieq Capital, Llc | 9 206 | 298 | ||||||
| 2025-09-04 | 13F/A | Advisor Group Holdings, Inc. | 13 829 | 120,63 | 448 | 132,12 | ||||
| 2025-07-21 | 13F | Qrg Capital Management, Inc. | 82 777 | 69,16 | 2 684 | 77,33 | ||||
| 2025-07-30 | NP | APIE - ActivePassive International Equity ETF | 109 515 | 33,93 | 3 237 | 36,70 | ||||
| 2025-08-08 | 13F | TD Capital Management LLC | 200 | 0,00 | 6 | 0,00 | ||||
| 2025-07-08 | 13F | Parallel Advisors, LLC | 7 061 | -19,42 | 229 | -15,87 | ||||
| 2025-06-25 | NP | CCNR - ALPS | CoreCommodity Natural Resources ETF | 727 | 19,97 | 21 | 17,65 | ||||
| 2025-06-26 | NP | DFIV - Dimensional International Value ETF | 32 | 0,00 | 1 | -100,00 | ||||
| 2025-08-01 | 13F | Bessemer Group Inc | 5 620 | 65,05 | 0 | |||||
| 2025-08-08 | 13F | Creative Planning | 81 928 | 2,42 | 2 656 | 7,36 | ||||
| 2025-08-12 | 13F | Coldstream Capital Management Inc | 7 616 | 28,87 | 247 | 35,16 | ||||
| 2025-08-11 | 13F | HighTower Advisors, LLC | 16 896 | -6,47 | 548 | -1,97 | ||||
| 2025-08-14 | 13F | Mariner, LLC | 100 411 | 42,09 | 3 255 | 48,97 | ||||
| 2025-07-25 | 13F | JustInvest LLC | 79 836 | 8,85 | 2 588 | 14,11 | ||||
| 2025-08-12 | 13F | Proequities, Inc. | 0 | 0 | ||||||
| 2025-08-14 | 13F | Ameriprise Financial Inc | 28 733 | 7,51 | 932 | 11,63 | ||||
| 2025-08-06 | 13F | Stone House Investment Management, LLC | 120 | 4 | ||||||
| 2025-08-11 | 13F | Brown Brothers Harriman & Co | 71 | 2 | ||||||
| 2025-07-31 | 13F | Oppenheimer Asset Management Inc. | 11 284 | 2,97 | 366 | 7,99 | ||||
| 2025-08-14 | 13F | Verition Fund Management LLC | 0 | -100,00 | 0 | |||||
| 2025-08-12 | 13F | Global Retirement Partners, LLC | 380 | -4,04 | 12 | 20,00 | ||||
| 2025-08-14 | 13F | Susquehanna International Group, Llp | Call | 7 700 | 250 | |||||
| 2025-08-14 | 13F | Susquehanna International Group, Llp | Put | 7 900 | -11,24 | 256 | -6,91 | |||
| 2025-08-12 | 13F | Jpmorgan Chase & Co | 45 348 | 60,72 | 1 470 | 68,58 | ||||
| 2025-07-21 | 13F | Cromwell Holdings LLC | 2 795 | 0,00 | 91 | 4,65 | ||||
| 2025-08-14 | 13F | Mml Investors Services, Llc | 12 282 | 33,40 | 0 | |||||
| 2025-07-08 | 13F/A | Salem Investment Counselors Inc | 155 | 0,00 | 5 | 25,00 | ||||
| 2025-08-12 | 13F | Dimensional Fund Advisors Lp | 86 768 | 1,73 | 2 813 | 6,63 | ||||
| 2025-08-13 | 13F | Russell Investments Group, Ltd. | 15 437 | 60,70 | 500 | 68,35 | ||||
| 2025-08-14 | 13F | Cubist Systematic Strategies, LLC | 0 | -100,00 | 0 | |||||
| 2025-08-11 | 13F | Hexagon Capital Partners LLC | 0 | -100,00 | 0 | |||||
| 2025-08-04 | 13F | Spire Wealth Management | 1 108 | 0,00 | 36 | 2,94 | ||||
| 2025-07-30 | 13F | Legacy Wealth Asset Management, LLC | 20 827 | -41,82 | 675 | -39,02 | ||||
| 2025-07-08 | 13F | Gallacher Capital Management LLC | 17 936 | 3,00 | 581 | 7,99 | ||||
| 2025-08-13 | 13F | Transce3nd, LLC | 174 | 0,00 | 6 | 0,00 | ||||
| 2025-08-28 | NP | KOMP - SPDR S&P Kensho New Economies Composite ETF This fund is a listed as child fund of State Street Corp and if that institution has disclosed ownership in this security, then these positions will not be double counted when calculating total shares and total value | 204 929 | 189,78 | 6 644 | 203,75 | ||||
| 2025-07-10 | 13F | Wealth Enhancement Advisory Services, Llc | 8 535 | 280 | ||||||
| 2025-08-08 | 13F | Larson Financial Group LLC | 1 009 | 33 | ||||||
| 2025-08-07 | 13F | Addison Advisors LLC | 1 679 | 9,52 | 54 | 14,89 | ||||
| 2025-08-14 | 13F | Aqr Capital Management Llc | 17 377 | 13,87 | 563 | 19,53 | ||||
| 2025-08-14 | 13F | Qube Research & Technologies Ltd | 22 116 | -85,79 | 717 | -85,11 | ||||
| 2025-04-25 | 13F | Red Tortoise LLC | 0 | -100,00 | 0 | |||||
| 2025-07-16 | 13F | Signaturefd, Llc | 26 936 | -3,74 | 873 | 0,92 | ||||
| 2025-08-13 | 13F | Townsquare Capital Llc | 0 | -100,00 | 0 | |||||
| 2025-05-15 | 13F | Shelton Capital Management | 0 | -100,00 | 0 | -100,00 | ||||
| 2025-08-14 | 13F | BW Gestao de Investimentos Ltda. | 25 000 | 810 | ||||||
| 2025-08-14 | 13F | State Street Corp | 211 900 | 164,03 | 6 870 | 172,69 | ||||
| 2025-07-14 | 13F | Abound Wealth Management | 8 | 0,00 | 0 | |||||
| 2025-08-14 | 13F | UBS Group AG | 228 954 | 3,63 | 7 423 | 8,62 | ||||
| 2025-07-14 | 13F | Park Avenue Securities Llc | 8 088 | 0 | ||||||
| 2025-08-29 | NP | Gabelli Dividend & Income Trust | 123 000 | 0,00 | 3 988 | 4,81 | ||||
| 2025-08-27 | 13F/A | Brinker Capital Investments, LLC | 81 352 | 14,20 | 2 637 | 19,70 | ||||
| 2025-08-12 | 13F | Pathstone Holdings, LLC | 32 448 | -0,44 | 1 052 | 4,37 | ||||
| 2025-08-14 | 13F | Evergreen Capital Management Llc | 19 824 | 24,29 | 643 | 28,14 | ||||
| 2025-07-28 | 13F | Ritholtz Wealth Management | 21 216 | 64,81 | 688 | 72,61 | ||||
| 2025-08-13 | 13F | First Trust Advisors Lp | 22 196 | -16,58 | 720 | -12,53 | ||||
| 2025-04-29 | 13F | Lee Danner & Bass Inc | 0 | -100,00 | 0 | |||||
| 2025-08-13 | 13F | Arrowstreet Capital, Limited Partnership | 0 | -100,00 | 0 | |||||
| 2025-07-14 | 13F | UMA Financial Services, Inc. | 22 | 0,00 | 1 | |||||
| 2025-07-21 | 13F | Credential Securities Inc. | 15 817 | 83 147,37 | 587 | |||||
| 2025-05-13 | 13F | Mondrian Investment Partners LTD | 0 | -100,00 | 0 | -100,00 | ||||
| 2025-07-24 | 13F | PDS Planning, Inc | 6 474 | 210 | ||||||
| 2025-08-06 | 13F | Vestmark Advisory Solutions, Inc. | 24 748 | 802 | ||||||
| 2025-08-14 | 13F | Goldman Sachs Group Inc | 1 303 108 | 0,34 | 42 247 | 5,17 | ||||
| 2025-08-15 | 13F | Tower Research Capital LLC (TRC) | 21 | 1 | ||||||
| 2025-07-15 | 13F | Mather Group, Llc. | 0 | -100,00 | 0 | |||||
| 2025-07-25 | 13F | Cwm, Llc | 5 880 | -1,46 | 0 | |||||
| 2025-08-13 | 13F | Jones Financial Companies Lllp | 6 407 | 54,50 | 208 | 62,50 | ||||
| 2025-05-16 | 13F | Coppell Advisory Solutions LLC | 0 | -100,00 | 0 | |||||
| 2025-08-14 | 13F | Wells Fargo & Company/mn | 264 335 | 3,92 | 8 570 | 8,92 | ||||
| 2025-05-07 | 13F | Ramirez Asset Management, Inc. | 0 | -100,00 | 0 | |||||
| 2025-07-21 | 13F | Credential Qtrade Securities Inc. | 0 | -100,00 | 0 | -100,00 | ||||
| 2025-08-13 | 13F | Brandes Investment Partners, Lp | 702 770 | 5,36 | 22 784 | 10,44 | ||||
| 2025-08-13 | 13F | Quadrant Capital Group Llc | 31 793 | 48,23 | 1 031 | 55,35 | ||||
| 2025-08-14 | 13F | Group One Trading, L.p. | 800 | 26 | ||||||
| 2025-07-17 | 13F | Sound Income Strategies, LLC | 59 | 0,00 | 2 | 0,00 | ||||
| 2025-08-14 | 13F | Group One Trading, L.p. | Put | 100 | -66,67 | 3 | -66,67 | |||
| 2025-08-14 | 13F | Group One Trading, L.p. | Call | 1 300 | 1 200,00 | 42 | 1 300,00 | |||
| 2025-04-22 | 13F | Synergy Financial Management, LLC | 0 | -100,00 | 0 | |||||
| 2025-08-07 | 13F | Zions Bancorporation, National Association /ut/ | 115 | 0,00 | 4 | 0,00 | ||||
| 2025-08-19 | 13F | Asset Dedication, LLC | 38 | 0,00 | 1 | 0,00 | ||||
| 2025-07-07 | 13F | Roxbury Financial LLC | 30 | 0,00 | 1 | |||||
| 2025-08-14 | 13F | Millennium Management Llc | 267 203 | 53,31 | 8 663 | 60,71 | ||||
| 2025-08-12 | 13F | BlackRock, Inc. | 989 599 | 5,27 | 32 083 | 10,34 | ||||
| 2025-08-12 | 13F | Charles Schwab Investment Management Inc | 104 842 | 16,57 | 3 399 | 22,19 | ||||
| 2025-08-05 | 13F | Flynn Zito Capital Management, Llc | 7 519 | -17,45 | 244 | -13,52 | ||||
| 2025-08-07 | 13F | Connor, Clark & Lunn Investment Management Ltd. | 122 839 | 3 982 | ||||||
| 2025-08-14 | 13F | Raymond James Financial Inc | 508 924 | -4,16 | 16 499 | 0,46 | ||||
| 2025-08-14 | 13F | Van Eck Associates Corp | 21 902 | 6,76 | 1 | |||||
| 2025-07-25 | 13F | LRI Investments, LLC | 33 | 0,00 | 1 | 0,00 | ||||
| 2025-08-14 | 13F | Hrt Financial Lp | 0 | -100,00 | 0 | |||||
| 2025-08-25 | 13F/A | Neuberger Berman Group LLC | 23 088 | 99,91 | 749 | 109,52 | ||||
| 2025-08-05 | 13F | Dunhill Financial, LLC | 250 | 8 | ||||||
| 2025-08-08 | NP | QGBLX - Quantified Global Fund Investor Class | 159 082 | 5 157 | ||||||
| 2025-08-13 | 13F | Guggenheim Capital Llc | 24 639 | 18,60 | 799 | 24,30 | ||||
| 2025-07-31 | 13F | Nisa Investment Advisors, Llc | 1 500 | 100,00 | 49 | 108,70 | ||||
| 2025-08-13 | 13F | Safe Harbor Fiduciary, LLC | 300 | 0,00 | 10 | 0,00 | ||||
| 2025-07-17 | 13F | Janney Montgomery Scott LLC | 6 703 | -32,54 | 0 | |||||
| 2025-08-12 | 13F | Steward Partners Investment Advisory, Llc | 3 639 | -18,02 | 118 | -14,60 | ||||
| 2025-05-16 | 13F/A | Kestra Investment Management, LLC | 0 | -100,00 | 0 | |||||
| 2025-08-05 | 13F | Cambiar Investors Llc | 137 470 | -23,28 | 4 457 | -19,60 | ||||
| 2025-08-08 | 13F | Pnc Financial Services Group, Inc. | 33 047 | 13,68 | 1 071 | 19,13 | ||||
| 2025-08-14 | 13F | Jain Global LLC | 0 | -100,00 | 0 | |||||
| 2025-07-23 | 13F | High Note Wealth, LLC | 0 | -100,00 | 0 | |||||
| 2025-07-08 | 13F | Northwest & Ethical Investments L.P. | 0 | -100,00 | 0 | -100,00 | ||||
| 2025-08-12 | 13F | Proequities, Inc. | Put | 0 | 0 | |||||
| 2025-08-12 | 13F | Proequities, Inc. | Call | 0 | 0 | |||||
| 2025-08-28 | NP | HAIL - SPDR S&P Kensho Smart Mobility ETF This fund is a listed as child fund of State Street Corp and if that institution has disclosed ownership in this security, then these positions will not be double counted when calculating total shares and total value | 6 551 | -24,06 | 212 | -20,30 | ||||
| 2025-08-11 | 13F | Nations Financial Group Inc, /ia/ /adv | 7 386 | 239 | ||||||
| 2025-08-14 | 13F | Graham Capital Management, L.P. | 0 | -100,00 | 0 | |||||
| 2025-08-14 | 13F | GWM Advisors LLC | 51 | 4,08 | 2 | 0,00 | ||||
| 2025-08-12 | 13F | Rhumbline Advisers | 4 204 | 58,10 | 136 | 65,85 | ||||
| 2025-07-29 | NP | SEPIX - Energy & Basic Materials Portfolio Energy & Basic Materials Class I | 1 075 | -7,65 | 32 | -6,06 | ||||
| 2025-07-30 | NP | ENDW - Cambria Endowment Style ETF | 7 | 0 | ||||||
| 2025-08-29 | 13F | Total Investment Management Inc | 1 | 0 | ||||||
| 2025-07-15 | 13F | Fifth Third Bancorp | 316 | 51,20 | 10 | 66,67 | ||||
| 2025-06-26 | NP | SNTKX - Steward International Enhanced Index Fund Class A | 67 356 | 0,00 | 1 914 | 0,90 | ||||
| 2025-05-01 | 13F | Schechter Investment Advisors, LLC | 24 983 | -6,97 | 773 | 5,18 | ||||
| 2025-08-05 | 13F | NewSquare Capital LLC | 916 | 179,27 | 30 | 190,00 | ||||
| 2025-08-12 | 13F | Atlas Capital Advisors Llc | 4 072 | 5,11 | 132 | 10,92 | ||||
| 2025-07-07 | 13F | Investors Research Corp | 11 350 | 0,00 | 368 | 4,56 | ||||
| 2025-07-17 | 13F | Sonora Investment Management Group, LLC | 0 | -100,00 | 0 | |||||
| 2025-07-21 | 13F | Ameritas Advisory Services, LLC | 100 | 3 | ||||||
| 2025-04-21 | 13F | Envestnet Portfolio Solutions, Inc. | 0 | -100,00 | 0 | |||||
| 2025-08-06 | 13F | True Wealth Design, LLC | 93 | -1,06 | 3 | 50,00 | ||||
| 2025-08-14 | 13F | Principia Wealth Advisory, LLC | 22 | 1 | ||||||
| 2025-07-25 | 13F | Meritage Portfolio Management | 0 | -100,00 | 0 | |||||
| 2025-08-12 | 13F | CIBC Private Wealth Group, LLC | 0 | -100,00 | 0 | |||||
| 2025-08-13 | 13F | Gabelli Funds Llc | 130 000 | 0,00 | 4 215 | 4,83 | ||||
| 2025-08-13 | 13F | GQG Partners LLC | 132 222 | 21,79 | 4 287 | 27,67 | ||||
| 2025-08-27 | NP | TPDAX - Timothy Plan Defensive Strategies Fund Class A | 1 525 | 0,00 | 49 | 4,26 | ||||
| 2025-05-12 | 13F | Todd Asset Management Llc | 0 | -100,00 | 0 | |||||
| 2025-05-05 | 13F | Teachers Retirement System Of The State Of Kentucky | 0 | -100,00 | 0 | |||||
| 2025-04-24 | NP | AIWEX - World Energy Fund Institutional | 100 000 | 400,00 | 2 897 | 414,56 | ||||
| 2025-08-07 | 13F | Allworth Financial LP | 2 884 | 8,22 | 94 | 22,37 | ||||
| 2025-08-14 | 13F | Toroso Investments, LLC | 30 211 | -14,64 | 979 | -10,51 | ||||
| 2025-07-31 | 13F | CVA Family Office, LLC | 37 | 0,00 | 1 | 0,00 | ||||
| 2025-08-08 | 13F | Abc Arbitrage Sa | 32 110 | 78,80 | 1 041 | 87,57 | ||||
| 2025-08-14 | 13F | Bnp Paribas Arbitrage, Sa | 19 770 | 671,96 | 641 | 710,13 | ||||
| 2025-08-29 | NP | Gabelli Global Utility & Income Trust | 7 000 | 0,00 | 227 | 4,63 | ||||
| 2025-08-12 | 13F | American Century Companies Inc | 478 192 | 12,10 | 15 503 | 17,50 | ||||
| 2025-07-07 | 13F | Versant Capital Management, Inc | 11 046 | 7,73 | 358 | 12,93 | ||||
| 2025-07-30 | 13F | Forum Financial Management, LP | 28 823 | 0,00 | 934 | 4,83 | ||||
| 2025-08-14 | 13F | Fmr Llc | 538 956 | 19,07 | 17 473 | 24,80 | ||||
| 2025-08-06 | 13F | Savant Capital, LLC | 18 747 | 608 |