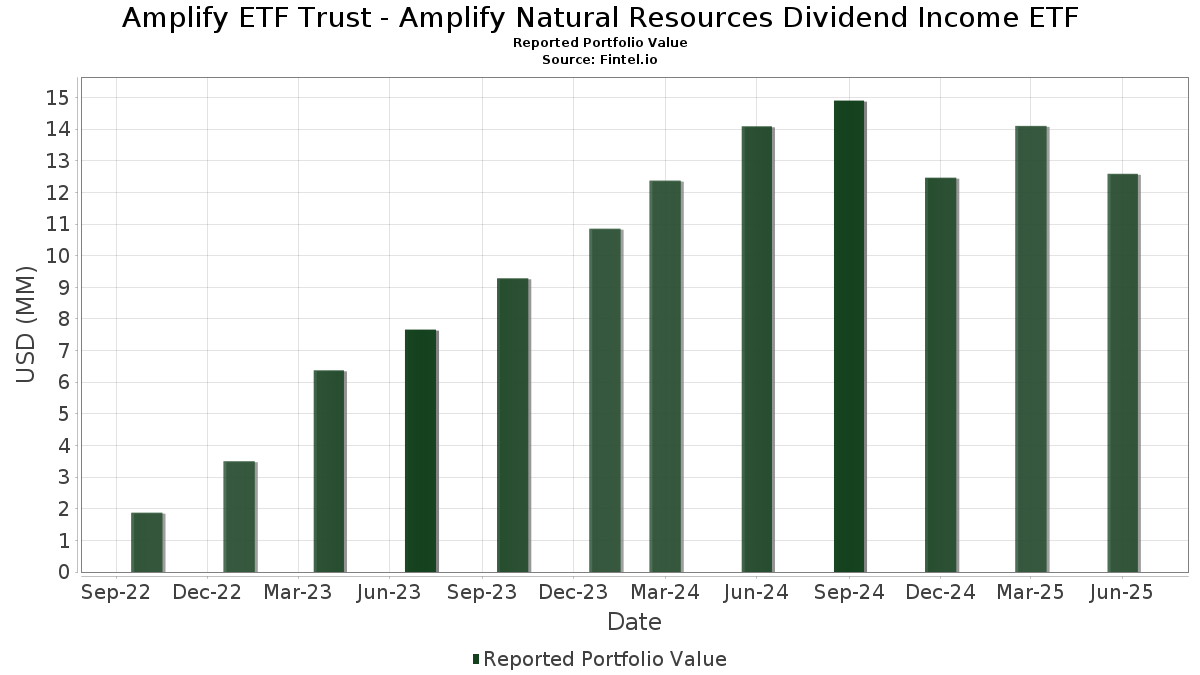
Statistiques de base
| Valeur du portefeuille | $ 12 588 110 |
| Positions actuelles | 48 |
Dernières positions, performances, ASG (à partir des dépôts 13F, 13D)
Amplify ETF Trust - Amplify Natural Resources Dividend Income ETF a déclaré un total de 48 positions dans ses derniers dépôts auprès de la SEC. La valeur la plus récente du portefeuille est calculée à 12 588 110 USD. Les actifs sous gestion réels (ASG) sont cette valeur plus les liquidités (qui ne sont pas divulguées). Les principales positions de Amplify ETF Trust - Amplify Natural Resources Dividend Income ETF sont First American Funds Inc - First American Government Obligations Fund Class X (US:FGXXX) , Petróleo Brasileiro S.A. - Petrobras - Depositary Receipt (Common Stock) (US:PBR) , LyondellBasell Industries N.V. (US:LYB) , CVR Energy, Inc. (US:CVI) , and The Chemours Company (US:CC) . Les nouvelles positions de Amplify ETF Trust - Amplify Natural Resources Dividend Income ETF incluent PBF Energy Inc. (US:PBF) , Atlas Energy Solutions Inc. (US:AESI) , Crescent Energy Company (US:CRGY) , .
Meilleures augmentations ce trimestre
Nous utilisons la variation de l'allocation du portefeuille car il s'agit de l'indicateur le plus significatif. Les changements peuvent être dus à des transactions ou à des variations de prix des actions.
| Titre | Actions (en millions) |
Valeur ($ en millions) |
% du portefeuille | ΔPortefeuille % |
|---|---|---|---|---|
| 0,01 | 0,41 | 3,4775 | 3,4775 | |
| 0,05 | 0,54 | 4,5412 | 2,9075 | |
| 0,01 | 0,31 | 2,6449 | 2,6449 | |
| 0,01 | 0,31 | 2,6076 | 2,6076 | |
| 0,02 | 0,44 | 3,7387 | 2,2816 | |
| 0,02 | 0,23 | 1,9780 | 1,9780 | |
| 0,01 | 0,56 | 4,7771 | 1,7706 | |
| 0,02 | 0,20 | 1,6931 | 1,6931 | |
| 0,02 | 0,52 | 4,4421 | 1,6644 | |
| 0,02 | 0,56 | 4,7120 | 1,5635 |
Principales baisses ce trimestre
Nous utilisons la variation de l'allocation du portefeuille car il s'agit de l'indicateur le plus significatif. Les changements peuvent être dus à des transactions ou à des variations de prix des actions.
| Titre | Actions (en millions) |
Valeur ($ en millions) |
% du portefeuille | ΔPortefeuille % |
|---|---|---|---|---|
| 0,00 | 0,00 | -3,2208 | ||
| 0,01 | 0,17 | 1,4211 | -2,4630 | |
| 0,01 | 0,16 | 1,3899 | -1,9343 | |
| 0,01 | 0,17 | 1,4665 | -1,8896 | |
| 0,01 | 0,14 | 1,2019 | -1,6975 | |
| 0,00 | 0,00 | -1,5462 | ||
| 0,00 | 0,10 | 0,8285 | -1,4698 | |
| 0,00 | 0,13 | 1,1386 | -1,4368 | |
| 0,77 | 0,77 | 6,5337 | -1,3790 | |
| 0,00 | 0,17 | 1,4551 | -1,2948 |
Déclarations 13F et dépôts de fonds
Ce formulaire a été déposé le 2025-08-27 pour la période de déclaration 2025-06-30. Cliquez sur l'icône du lien pour voir l'historique complet des transactions.
Mettre à niveau pour débloquer les données premium et exporter vers Excel ![]() .
.
| Titre | Type | Prix moyen de l'action | Actions (en millions) |
ΔActions (%) |
ΔActions (%) |
Valeur ($ en millions) |
Portefeuille (%) |
ΔPortefeuille (%) |
|
|---|---|---|---|---|---|---|---|---|---|
| FGXXX / First American Funds Inc - First American Government Obligations Fund Class X | 0,77 | -25,28 | 0,77 | -25,32 | 6,5337 | -1,3790 | |||
| PBR / Petróleo Brasileiro S.A. - Petrobras - Depositary Receipt (Common Stock) | 0,05 | 5,79 | 0,61 | -7,82 | 5,2027 | 0,1013 | |||
| LYB / LyondellBasell Industries N.V. | 0,01 | 74,95 | 0,56 | 43,99 | 4,7771 | 1,7706 | |||
| CVI / CVR Energy, Inc. | 0,02 | -2,15 | 0,56 | 35,37 | 4,7120 | 1,5635 | |||
| CC / The Chemours Company | 0,05 | 197,23 | 0,54 | 151,17 | 4,5412 | 2,9075 | |||
| DOW / Dow Inc. | 0,02 | 90,84 | 0,52 | 44,75 | 4,4421 | 1,6644 | |||
| NE / Noble Corporation plc | 0,02 | 107,26 | 0,44 | 133,33 | 3,7387 | 2,2816 | |||
| FMC / FMC Corporation | 0,01 | 0,41 | 3,4775 | 3,4775 | |||||
| HUN / Huntsman Corporation | 0,04 | 95,30 | 0,41 | 28,93 | 3,4756 | 1,0353 | |||
| FLNG / FLEX LNG Ltd. | 0,02 | -12,08 | 0,40 | -15,97 | 3,3925 | -0,2595 | |||
| US82983N1081 / Sitio Royalties Corp | 0,02 | 73,24 | 0,35 | 60,19 | 2,9363 | 1,2781 | |||
| PBF / PBF Energy Inc. | 0,01 | 0,31 | 2,6449 | 2,6449 | |||||
| NOG / Northern Oil and Gas, Inc. | 0,01 | 0,31 | 2,6076 | 2,6076 | |||||
| DINO / HF Sinclair Corporation | 0,01 | 3,98 | 0,30 | 29,74 | 2,5557 | 0,7755 | |||
| SOBO / South Bow Corporation | 0,01 | -25,46 | 0,28 | -24,46 | 2,3634 | -0,4624 | |||
| KNTK / Kinetik Holdings Inc. | 0,01 | -32,07 | 0,26 | -25,14 | 2,2025 | -0,7726 | |||
| KRP / Kimbell Royalty Partners, LP - Limited Partnership | 0,02 | -36,26 | 0,26 | -36,48 | 2,1723 | -0,9205 | |||
| APA / APA Corporation | 0,01 | 48,58 | 0,25 | 17,62 | 2,0948 | 0,4107 | |||
| DKL / Delek Logistics Partners, LP - Limited Partnership | 0,01 | -44,19 | 0,24 | -44,60 | 2,0026 | -1,2677 | |||
| AESI / Atlas Energy Solutions Inc. | 0,02 | 0,23 | 1,9780 | 1,9780 | |||||
| BP / BP p.l.c. - Depositary Receipt (Common Stock) | 0,01 | -11,03 | 0,23 | -20,96 | 1,9503 | -0,2891 | |||
| MUR / Murphy Oil Corporation | 0,01 | 64,65 | 0,23 | 22,58 | 1,9355 | 0,4396 | |||
| CIVI / Civitas Resources, Inc. | 0,01 | 85,53 | 0,22 | 11,62 | 1,8756 | 0,2813 | |||
| AM / Antero Midstream Corporation | 0,01 | -26,69 | 0,20 | -22,81 | 1,7217 | -0,2970 | |||
| CNQ / Canadian Natural Resources Limited | 0,01 | -8,00 | 0,20 | -6,48 | 1,7203 | 0,0606 | |||
| CRGY / Crescent Energy Company | 0,02 | 0,20 | 1,6931 | 1,6931 | |||||
| CHRD / Chord Energy Corporation | 0,00 | 20,93 | 0,19 | 0,00 | 1,6410 | 0,0910 | |||
| ENB / Enbridge Inc. | 0,00 | -26,69 | 0,19 | -25,10 | 1,6260 | -0,3363 | |||
| PR / Permian Resources Corporation | 0,01 | 56,40 | 0,19 | 20,25 | 1,6188 | 0,2583 | |||
| PTEN / Patterson-UTI Energy, Inc. | 0,03 | 0,18 | 1,5396 | 1,5396 | |||||
| CVX / Chevron Corporation | 0,00 | -22,85 | 0,17 | -23,79 | 1,4710 | -0,3539 | |||
| ARLP / Alliance Resource Partners, L.P. - Limited Partnership | 0,01 | -58,73 | 0,17 | -60,41 | 1,4665 | -1,8896 | |||
| WES / Western Midstream Partners, LP - Limited Partnership | 0,00 | -49,32 | 0,17 | -52,23 | 1,4551 | -1,2948 | |||
| DMLP / Dorchester Minerals, L.P. - Limited Partnership | 0,01 | -64,25 | 0,17 | -67,00 | 1,4211 | -2,4630 | |||
| PBA / Pembina Pipeline Corporation | 0,00 | -29,12 | 0,17 | -33,47 | 1,3998 | -0,5074 | |||
| BSM / Black Stone Minerals, L.P. - Limited Partnership | 0,01 | -55,83 | 0,16 | -62,36 | 1,3899 | -1,9343 | |||
| PAA / Plains All American Pipeline, L.P. - Limited Partnership | 0,01 | -46,07 | 0,16 | -50,63 | 1,3245 | -1,1016 | |||
| E / Eni S.p.A. - Depositary Receipt (Common Stock) | 0,00 | -41,59 | 0,15 | -39,02 | 1,2772 | -0,6104 | |||
| ET / Energy Transfer LP - Limited Partnership | 0,01 | -39,53 | 0,14 | -41,22 | 1,2280 | -0,6561 | |||
| USAC / USA Compression Partners, LP - Limited Partnership | 0,01 | -58,37 | 0,14 | -62,70 | 1,2019 | -1,6975 | |||
| MPLX / MPLX LP - Limited Partnership | 0,00 | -58,43 | 0,13 | -60,00 | 1,1386 | -1,4368 | |||
| HESM / Hess Midstream LP | 0,00 | -52,56 | 0,13 | -56,82 | 1,1281 | -1,2349 | |||
| HP / Helmerich & Payne, Inc. | 0,01 | 0,13 | 1,0848 | 1,0848 | |||||
| EPD / Enterprise Products Partners L.P. - Limited Partnership | 0,00 | -51,91 | 0,12 | -56,38 | 1,0445 | -1,1192 | |||
| US8252528851 / Invesco Government & Agency Portfolio, Institutional Class | 0,12 | -9,63 | 0,12 | -9,63 | 1,0368 | -0,0015 | |||
| GLP / Global Partners LP - Limited Partnership | 0,00 | -59,11 | 0,10 | -59,77 | 0,8787 | -1,0898 | |||
| SUN / Sunoco LP - Limited Partnership | 0,00 | -64,66 | 0,10 | -67,56 | 0,8285 | -1,4698 | |||
| CQP / Cheniere Energy Partners, L.P. - Limited Partnership | 0,00 | -58,00 | 0,09 | -64,37 | 0,7473 | -1,1496 | |||
| GEL / Genesis Energy, L.P. - Limited Partnership | 0,00 | -100,00 | 0,00 | -100,00 | -3,2208 | ||||
| DK / Delek US Holdings, Inc. | 0,00 | -100,00 | 0,00 | -100,00 | -1,5462 |