Statistiques de base
| Propriétaires institutionnels | 157 total, 152 long only, 0 short only, 5 long/short - change of -4,85% MRQ |
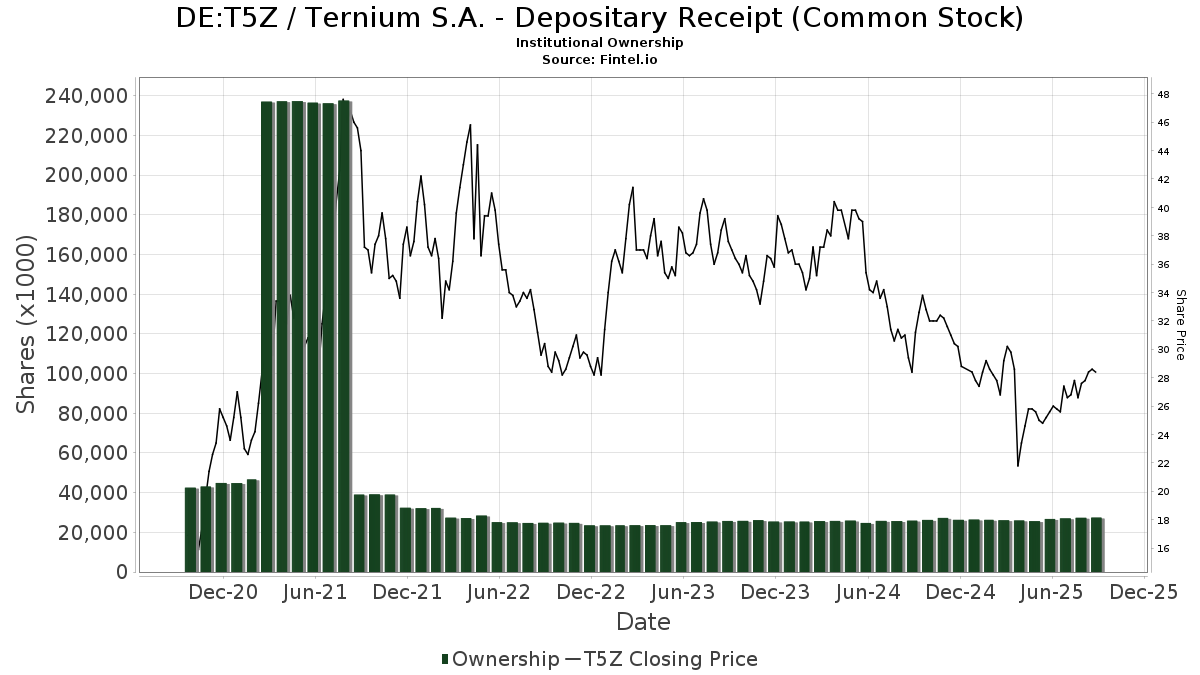
| Prix de l'action | 29,40 |
| Allocation moyenne du portefeuille | 0.3250 % - change of 1,11% MRQ |
| Actions institutionnelles (Long) | 27 418 114 (ex 13D/G) - change of 0,69MM shares 2,57% MRQ |
| Valeur institutionnelle (Long) | $ 628 276 USD ($1000) |
Participation institutionnels et actionnaires
Ternium S.A. - Depositary Receipt (Common Stock) (DE:T5Z) détient 157 des propriétaires institutionnels et des actionnaires qui ont déposé des formulaires 13D/G ou 13F auprès de la Securities Exchange Commission (SEC). Ces institutions détiennent un total de 27,418,114 actions. Les principaux actionnaires incluent Lazard Asset Management Llc, Donald Smith & Co., Inc., Ninety One UK Ltd, Schroder Investment Management Group, VASVX - Vanguard Selected Value Fund Investor Shares, Ninety One North America, Inc., Acadian Asset Management Llc, Contrarian Capital Management, L.l.c., LZOEX - Lazard Emerging Markets Equity Portfolio Open Shares, and Oaktree Capital Management Lp .
Ternium S.A. - Depositary Receipt (Common Stock) (DB:T5Z) la structure de l'actionnariat institutionnel indique les positions actuelles des institutions et des fonds dans l'entreprise, ainsi que les derniers changements dans le volume des positions. Les principaux actionnaires peuvent être des investisseurs individuels, des fonds communs de placement, des fonds spéculatifs ou des institutions. L'annexe 13D indique que l'investisseur détient (ou a détenu) plus de 5 % de l'entreprise et qu'il a l'intention (ou a eu l'intention) de poursuivre activement un changement de stratégie commerciale. L'annexe 13G indique un investissement passif de plus de 5 %.
The share price as of September 8, 2025 is 29,40 / share. Previously, on September 9, 2024, the share price was 29,00 / share. This represents an increase of 1,38% over that period.
Indice de confiance des fonds
L'indice de confiance des fonds (anciennement score d'accumulation de participation) trouve les actions qui sont les plus achetées par les fonds. Il est le résultat d'un modèle quantitatif sophistiqué à plusieurs facteurs qui identifie les entreprises avec les niveaux les plus élevés d'accumulation institutionnelle. Le modèle de notation utilise une combinaison de l'augmentation totale des propriétaires déclarés, des variations des allocations de portefeuille chez ces propriétaires et d'autres indicateurs. Le chiffre varie de 0 à 100, les chiffres plus élevés indiquant un niveau d'accumulation plus élevé par rapport aux autres entreprises, 50 étant la moyenne.
Fréquence de mise à jour : Quotidienne
Déclarations 13F et NPORT
Les détails des déclarations 13F sont gratuits. Les détails des déclarations NP nécessitent une adhésion premium. Les lignes vertes indiquent de nouvelles positions. Les lignes rouges indiquent des positions clôturées. Cliquez sur l'icône du lien pour voir l'historique complet des transactions.
Mettre à niveau
pour débloquer des données premium et les exporter vers Excel ![]() .
.
| Date de dépôt | Source | Investisseur | Type | Prix moyen (Est) |
Actions | Δ Actions (%) |
Valeur déclarée (1000 $) |
Δ Valeur (%) |
Allocation de portefeuille (%) |
|
|---|---|---|---|---|---|---|---|---|---|---|
| 2025-07-21 | 13F | Qrg Capital Management, Inc. | 0 | -100,00 | 0 | |||||
| 2025-07-31 | 13F | State of New Jersey Common Pension Fund D | 92 528 | 0,00 | 2 785 | -3,40 | ||||
| 2025-07-30 | NP | IPAV - Global X Infrastructure Development ex-U.S. ETF | 259 | 62,89 | 7 | 75,00 | ||||
| 2025-03-27 | NP | HERIX - Hartford Emerging Markets Equity Fund Class I | 14 841 | 0,00 | 445 | -12,06 | ||||
| 2025-07-24 | 13F | Ronald Blue Trust, Inc. | 1 912 | -10,74 | 58 | -13,64 | ||||
| 2025-08-14 | 13F | Deprince Race & Zollo Inc | 139 739 | 4 206 | ||||||
| 2025-08-05 | 13F | Key FInancial Inc | 600 | 0,00 | 18 | 0,00 | ||||
| 2025-08-13 | 13F | Northern Trust Corp | 0 | -100,00 | 0 | |||||
| 2025-08-11 | 13F | Bell Investment Advisors, Inc | 52 | -53,57 | 2 | -66,67 | ||||
| 2025-08-12 | 13F | Edmond De Rothschild Holding S.a. | 900 | 0,00 | 27 | -3,57 | ||||
| 2025-05-15 | 13F | Woodline Partners LP | 0 | -100,00 | 0 | |||||
| 2025-08-19 | 13F | State of Wyoming | 3 954 | 119 | ||||||
| 2025-07-30 | NP | AUERX - Auer Growth Fund | 18 000 | 0,00 | 493 | -5,38 | ||||
| 2025-08-04 | 13F | Hantz Financial Services, Inc. | 6 998 | 1 360,96 | 0 | |||||
| 2025-08-14 | 13F | Two Sigma Advisers, Lp | 0 | -100,00 | 0 | |||||
| 2025-06-18 | NP | RMYAX - Multi-Strategy Income Fund Class A | 1 540 | 0,00 | 44 | -4,35 | ||||
| 2025-08-25 | NP | PRINCIPAL VARIABLE CONTRACTS FUNDS INC - International Emerging Markets Account Class 1 | 2 835 | 35,65 | 85 | 30,77 | ||||
| 2025-08-14 | 13F | Vident Advisory, LLC | 13 899 | 13,22 | 418 | 9,42 | ||||
| 2025-08-14 | 13F | Canada Pension Plan Investment Board | 120 249 | 0,00 | 3 619 | -3,39 | ||||
| 2025-05-09 | 13F | Commonwealth Equity Services, Llc | 0 | -100,00 | 0 | |||||
| 2025-08-06 | 13F | Savant Capital, LLC | 0 | -100,00 | 0 | |||||
| 2025-08-08 | 13F | Geode Capital Management, Llc | 0 | -100,00 | 0 | |||||
| 2025-05-12 | 13F | FIL Ltd | 0 | -100,00 | 0 | -100,00 | ||||
| 2025-06-18 | NP | REMSX - Emerging Markets Fund Class S | 24 795 | 0,00 | 716 | -3,77 | ||||
| 2025-08-14 | 13F | Citadel Advisors Llc | Call | 30 800 | 124,82 | 927 | 117,61 | |||
| 2025-08-13 | 13F | Towle & Co | 24 794 | 4,69 | 746 | 1,22 | ||||
| 2025-08-13 | 13F | Northwestern Mutual Wealth Management Co | 393 | 12 | ||||||
| 2025-03-31 | NP | FZILX - Fidelity ZERO International Index Fund This fund is a listed as child fund of Fmr Llc and if that institution has disclosed ownership in this security, then these positions will not be double counted when calculating total shares and total value | 6 978 | 0,00 | 209 | -12,18 | ||||
| 2025-06-23 | NP | PEAPX - International Emerging Markets Fund R-3 | 83 046 | 0,00 | 2 397 | -3,81 | ||||
| 2025-08-07 | 13F | Dalton Investments LLC | 23 584 | 0,00 | 710 | -3,41 | ||||
| 2025-07-07 | 13F | Thurston, Springer, Miller, Herd & Titak, Inc. | 118 | 0,00 | 4 | 0,00 | ||||
| 2025-08-07 | 13F | Campbell & CO Investment Adviser LLC | 9 515 | -50,25 | 286 | -51,93 | ||||
| 2025-08-12 | 13F | Cornerstone Select Advisors, LLC | 0 | -100,00 | 0 | |||||
| 2025-08-08 | 13F | Cetera Investment Advisers | 9 358 | -3,24 | 282 | -6,64 | ||||
| 2025-08-08 | 13F | SBI Securities Co., Ltd. | 3 567 | 8,35 | 107 | 4,90 | ||||
| 2025-07-08 | 13F | Northwest & Ethical Investments L.P. | 0 | -100,00 | 0 | -100,00 | ||||
| 2025-07-31 | 13F | MQS Management LLC | 0 | -100,00 | 0 | |||||
| 2025-08-27 | 13F/A | Squarepoint Ops LLC | 0 | -100,00 | 0 | -100,00 | ||||
| 2025-07-18 | 13F | Robeco Institutional Asset Management B.V. | 403 293 | 5,22 | 12 139 | 1,64 | ||||
| 2025-07-28 | NP | IUS - Invesco RAFI(TM) Strategic US ETF This fund is a listed as child fund of Invesco Ltd. and if that institution has disclosed ownership in this security, then these positions will not be double counted when calculating total shares and total value | 14 053 | 0,60 | 385 | -4,71 | ||||
| 2025-08-13 | 13F | WealthTrust Axiom LLC | 22 350 | -5,50 | 673 | -8,70 | ||||
| 2025-03-31 | NP | APITX - Yorktown Growth Fund Class L Shares | 8 275 | 0,00 | 248 | -12,06 | ||||
| 2025-08-12 | 13F | XTX Topco Ltd | 0 | -100,00 | 0 | |||||
| 2025-08-13 | 13F | Russell Investments Group, Ltd. | 576 869 | -14,34 | 17 455 | -16,78 | ||||
| 2025-08-14 | 13F | Aquatic Capital Management LLC | 29 675 | 246,55 | 893 | 235,71 | ||||
| 2025-05-15 | 13F | PointState Capital LP | 0 | -100,00 | 0 | |||||
| 2025-08-12 | 13F | Legal & General Group Plc | 475 | 0,00 | 14 | 0,00 | ||||
| 2025-08-12 | 13F | BlackRock, Inc. | 502 446 | 5,36 | 15 124 | 1,78 | ||||
| 2025-08-13 | 13F | Natixis | 227 | 0,00 | 7 | -14,29 | ||||
| 2025-03-20 | NP | GSEQX - Goldman Sachs Multi-Manager Global Equity Fund Class R6 Shares | 2 982 | 0,00 | 89 | -11,88 | ||||
| 2025-08-11 | 13F | Empirical Finance, LLC | 61 431 | 1 849 | ||||||
| 2025-08-11 | 13F | Cape Ann Asset Management Ltd | 897 049 | -0,69 | 27 001 | -4,06 | ||||
| 2025-04-24 | 13F | Allspring Global Investments Holdings, LLC | 0 | -100,00 | 0 | -100,00 | ||||
| 2025-08-06 | 13F | Oldfield Partners LLP | 138 602 | -21,26 | 4 172 | -23,96 | ||||
| 2025-08-13 | 13F | Oaktree Capital Management Lp | 919 709 | 13,18 | 27 683 | 9,33 | ||||
| 2025-08-27 | NP | SMCF - Themes US Small Cap Cash Flow Champions ETF | 643 | -11,19 | 19 | -13,64 | ||||
| 2025-07-30 | NP | FSAMX - Strategic Advisers Emerging Markets Fund This fund is a listed as child fund of Fmr Llc and if that institution has disclosed ownership in this security, then these positions will not be double counted when calculating total shares and total value | 50 330 | -21,69 | 1 378 | -25,75 | ||||
| 2025-08-14 | 13F | UBS Group AG | 50 618 | 152,18 | 1 524 | 143,68 | ||||
| 2025-08-14 | 13F | Citadel Advisors Llc | Put | 0 | -100,00 | 0 | ||||
| 2025-09-04 | 13F/A | Advisor Group Holdings, Inc. | 3 988 | -4,04 | 120 | -6,98 | ||||
| 2025-08-12 | 13F | LPL Financial LLC | 21 073 | -27,86 | 634 | -30,33 | ||||
| 2025-05-15 | 13F | D. E. Shaw & Co., Inc. | Put | 0 | -100,00 | 0 | -100,00 | |||
| 2025-05-15 | 13F | D. E. Shaw & Co., Inc. | Call | 0 | -100,00 | 0 | -100,00 | |||
| 2025-07-24 | 13F | Standard Life Aberdeen plc | 8 570 | 258 | ||||||
| 2025-07-18 | 13F | Ninety One North America, Inc. | 1 023 049 | 23,43 | 30 794 | 19,23 | ||||
| 2025-08-12 | 13F | Coldstream Capital Management Inc | 0 | -100,00 | 0 | |||||
| 2025-08-18 | 13F/A | National Bank Of Canada /fi/ | 4 | 0,00 | 0 | |||||
| 2025-08-14 | 13F | Van Eck Associates Corp | 105 266 | -1,13 | 3 | 0,00 | ||||
| 2025-08-04 | 13F | Yorktown Management & Research Co Inc | 0 | -100,00 | 0 | |||||
| 2025-07-18 | 13F | Ninety One UK Ltd | 2 407 110 | 5,18 | 72 454 | 1,60 | ||||
| 2025-08-13 | 13F | Donald Smith & Co., Inc. | 3 412 385 | 10,08 | 102 713 | 6,34 | ||||
| 2025-06-26 | NP | HFSSX - Hartford Schroders International Contrarian Value Fund Class SDR | 50 949 | 50,31 | 1 470 | 44,69 | ||||
| 2025-08-13 | 13F/A | StoneX Group Inc. | 5 039 | -0,87 | 230 | 4,07 | ||||
| 2025-08-14 | 13F | MIRAE ASSET GLOBAL ETFS HOLDINGS Ltd. | 453 | 184,91 | 14 | 225,00 | ||||
| 2025-07-25 | 13F | Atria Wealth Solutions, Inc. | 7 000 | 0,00 | 221 | 0,92 | ||||
| 2025-06-25 | NP | CCNR - ALPS | CoreCommodity Natural Resources ETF | 24 628 | 711 | ||||||
| 2025-08-13 | 13F | Kilter Group LLC | 39 | 1 | ||||||
| 2025-08-12 | 13F | Proequities, Inc. | Put | 0 | 0 | |||||
| 2025-08-12 | 13F | Proequities, Inc. | Call | 0 | 0 | |||||
| 2025-08-12 | 13F | Proequities, Inc. | 0 | 0 | ||||||
| 2025-08-14 | 13F | Lazard Asset Management Llc | 5 358 772 | 4,64 | 161 | 1,26 | ||||
| 2025-08-15 | 13F | Caxton Associates Llp | 17 819 | 2,79 | 536 | -0,74 | ||||
| 2025-08-14 | 13F | Fmr Llc | 176 | -57,07 | 5 | -58,33 | ||||
| 2025-08-14 | 13F | Royal Bank Of Canada | 26 106 | -3,19 | 786 | -6,43 | ||||
| 2025-08-15 | 13F | Tower Research Capital LLC (TRC) | 171 | 5 600,00 | 5 | |||||
| 2025-08-13 | 13F | Mackenzie Financial Corp | 120 229 | 63,51 | 3 619 | 57,92 | ||||
| 2025-07-28 | NP | ZEMRX - American Beacon Ninety One Emerging Markets Equity Fund R6 Class | 87 070 | -0,57 | 2 384 | -5,77 | ||||
| 2025-08-14 | 13F | Wells Fargo & Company/mn | 75 781 | -0,98 | 2 281 | -4,32 | ||||
| 2025-08-12 | 13F | Eisler Capital Management Ltd. | 19 018 | 574 | ||||||
| 2025-05-15 | 13F | Balyasny Asset Management Llc | 0 | -100,00 | 0 | -100,00 | ||||
| 2025-06-26 | NP | Mexico Fund Inc | 120 000 | 0,00 | 3 463 | -3,81 | ||||
| 2025-06-26 | NP | AEMGX - Acadian Emerging Markets Portfolio Investor Class Shares | 54 891 | -13,64 | 1 584 | -16,89 | ||||
| 2025-08-21 | NP | LAZARD RETIREMENT SERIES INC - Lazard Retirement Emerging Markets Equity Portfolio Service Shares | 77 454 | -1,88 | 2 331 | -5,21 | ||||
| 2025-08-12 | 13F/A | Boston Partners | 20 994 | 0,00 | 632 | -3,52 | ||||
| 2025-05-06 | 13F | Bank Julius Baer & Co. Ltd, Zurich | 0 | -100,00 | 0 | |||||
| 2025-08-14 | 13F | State Street Corp | 405 144 | 42,93 | 12 195 | 38,07 | ||||
| 2025-08-11 | 13F | Principal Securities, Inc. | 0 | -100,00 | 0 | |||||
| 2025-08-14 | 13F | Raymond James Financial Inc | 7 097 | 214 | ||||||
| 2025-08-13 | 13F | Pictet Asset Management Holding SA | 0 | -100,00 | 0 | |||||
| 2025-08-07 | 13F | Allworth Financial LP | 4 | 0 | ||||||
| 2025-08-08 | 13F | Larson Financial Group LLC | 9 | -82,35 | 0 | -100,00 | ||||
| 2025-08-12 | 13F | Rhumbline Advisers | 1 354 | 0,00 | 41 | -4,76 | ||||
| 2025-06-27 | NP | EAEMX - Parametric Emerging Markets Fund Investor Class | 3 000 | 0,00 | 87 | -4,44 | ||||
| 2025-05-15 | 13F | Ancora Advisors, LLC | 0 | -100,00 | 0 | -100,00 | ||||
| 2025-08-05 | 13F | Simplex Trading, Llc | Call | 3 900 | -79,79 | 0 | ||||
| 2025-08-13 | 13F | Victory Capital Management Inc | 45 584 | 0,00 | 1 372 | -3,38 | ||||
| 2025-08-13 | 13F | EverSource Wealth Advisors, LLC | 485 | 135,44 | 15 | 133,33 | ||||
| 2025-08-14 | 13F | Headlands Technologies LLC | 685 | 591,92 | 21 | 566,67 | ||||
| 2025-08-07 | 13F | Acadian Asset Management Llc | 1 014 799 | -18,03 | 31 | -21,05 | ||||
| 2025-05-14 | 13F | Group One Trading, L.p. | 0 | -100,00 | 0 | -100,00 | ||||
| 2025-06-18 | NP | RAZAX - Multi-Asset Growth Strategy Fund Class A | 4 404 | 0,00 | 127 | -3,79 | ||||
| 2025-07-14 | 13F | GAMMA Investing LLC | 758 | -60,38 | 23 | -62,71 | ||||
| 2025-08-11 | 13F | Empowered Funds, LLC | 61 431 | 1 849 | ||||||
| 2025-08-14 | 13F | Bank Of America Corp /de/ | 32 635 | -35,90 | 982 | -38,08 | ||||
| 2025-08-18 | 13F | Rexford Capital Inc | 4 020 | 121 | ||||||
| 2025-03-31 | NP | ZEMIX - Ninety One Emerging Markets Equity Fund I Shares | 87 570 | -2,41 | 2 627 | -14,15 | ||||
| 2025-08-15 | 13F/A | Symphony Financial, Ltd. Co. | 12 258 | 393 | ||||||
| 2025-05-12 | 13F | Simplex Trading, Llc | 0 | -100,00 | 0 | |||||
| 2025-08-26 | NP | EQ ADVISORS TRUST - EQ/Lazard Emerging Markets Equity Portfolio Class IB | 114 290 | -1,51 | 3 440 | -4,84 | ||||
| 2025-05-15 | 13F | Qube Research & Technologies Ltd | 0 | -100,00 | 0 | |||||
| 2025-08-05 | 13F | Huntington National Bank | 106 | -6,19 | 3 | 0,00 | ||||
| 2025-07-11 | 13F | Arrow Investment Advisors, LLC | 7 345 | 221 | ||||||
| 2025-08-13 | 13F | Oaktree Fund Advisors, LLC | 51 529 | 3,41 | 1 551 | -0,06 | ||||
| 2025-05-27 | NP | VARIABLE INSURANCE PRODUCTS FUND II - International Index Portfolio Initial Class | 1 033 | 7,94 | 32 | 18,52 | ||||
| 2025-08-07 | 13F | Bearing Point Capital, Llc | 17 000 | 7,59 | 512 | 3,86 | ||||
| 2025-08-25 | NP | EITEX - Parametric Tax-Managed Emerging Markets Fund Institutional Class | 7 422 | 0,00 | 223 | -3,46 | ||||
| 2025-08-14 | 13F | Group One Trading, L.p. | Put | 600 | -60,00 | 18 | -60,87 | |||
| 2025-08-14 | 13F | Group One Trading, L.p. | Call | 500 | -93,75 | 15 | -93,98 | |||
| 2025-08-20 | NP | REMG - Emerging Markets Equity Active ETF | 1 610 | 48 | ||||||
| 2025-07-07 | 13F | Investors Research Corp | 17 300 | 166,15 | 521 | 157,43 | ||||
| 2025-08-14 | 13F | Silvercrest Asset Management Group Llc | 52 752 | 51,88 | 1 588 | 46,67 | ||||
| 2025-07-28 | NP | TEMUX - Emerging Markets Equity Fund | 21 284 | 0,48 | 583 | -4,75 | ||||
| 2025-07-17 | 13F | Sound Income Strategies, LLC | 840 | 0,00 | 25 | -3,85 | ||||
| 2025-08-13 | 13F | Amundi | 509 268 | 3,92 | 16 312 | 12,10 | ||||
| 2025-06-26 | NP | DVYE - iShares Emerging Markets Dividend ETF | 223 443 | 6 449 | ||||||
| 2025-08-08 | 13F | Banco Bilbao Vizcaya Argentaria, S.a. | 8 571 | 0,00 | 258 | -3,75 | ||||
| 2025-07-28 | 13F | Allianz Asset Management GmbH | 35 292 | -4,64 | 1 062 | -7,97 | ||||
| 2025-05-15 | 13F | Macquarie Group Ltd | 0 | -100,00 | 0 | |||||
| 2025-08-14 | 13F | Goldman Sachs Group Inc | 50 763 | 9,35 | 1 528 | 5,60 | ||||
| 2025-08-11 | 13F | Citigroup Inc | 3 574 | -63,85 | 108 | -65,26 | ||||
| 2025-07-25 | NP | USEMX - Emerging Markets Fund Shares | 45 797 | 5,79 | 1 254 | 0,24 | ||||
| 2025-08-05 | 13F | Simplex Trading, Llc | Put | 1 300 | 62,50 | 0 | ||||
| 2025-08-14 | 13F | Wellington Management Group Llp | 0 | -100,00 | 0 | |||||
| 2025-03-27 | NP | EQIAX - Wells Fargo Emerging Markets Equity Income Fund Class A | 55 128 | -3,77 | 1 654 | -15,40 | ||||
| 2025-08-14 | 13F | Militia Capital Partners, LP | 36 084 | 16,09 | 1 086 | 12,19 | ||||
| 2025-08-12 | 13F | Jpmorgan Chase & Co | 518 | -0,19 | 16 | -6,25 | ||||
| 2025-08-21 | NP | LZOEX - Lazard Emerging Markets Equity Portfolio Open Shares | 939 276 | 6,80 | 28 272 | 3,17 | ||||
| 2025-08-11 | 13F | TD Waterhouse Canada Inc. | 0 | -100,00 | 0 | |||||
| 2025-08-15 | 13F | Morgan Stanley | 208 382 | -10,58 | 6 272 | -13,62 | ||||
| 2025-08-14 | 13F/A | Skopos Labs, Inc. | 10 036 | 397,32 | 302 | 387,10 | ||||
| 2025-08-14 | 13F | Ubs Asset Management Americas Inc | 0 | -100,00 | 0 | |||||
| 2025-08-13 | 13F | Jones Financial Companies Lllp | 338 | 9,74 | 10 | 11,11 | ||||
| 2025-07-11 | 13F | Farther Finance Advisors, LLC | 42 | -77,54 | 1 | -80,00 | ||||
| 2025-07-15 | 13F | Public Employees Retirement System Of Ohio | 99 868 | -15,19 | 3 006 | -18,07 | ||||
| 2025-08-28 | NP | XCNY - SPDR S&P Emerging Markets ex-China ETF | 100 | 0,00 | 3 | 0,00 | ||||
| 2025-08-14 | 13F/A | Barclays Plc | 1 | -99,98 | 0 | |||||
| 2025-08-13 | 13F | Walleye Trading LLC | Call | 7 500 | 0,00 | 226 | -3,43 | |||
| 2025-08-21 | NP | SLX - VanEck Vectors Steel ETF | 105 266 | -1,13 | 3 169 | -4,49 | ||||
| 2025-08-08 | 13F | Mitsubishi UFJ Trust & Banking Corp | 4 945 | -32,38 | 149 | -34,80 | ||||
| 2025-08-13 | 13F | Walleye Trading LLC | Put | 100 | -80,00 | 3 | -80,00 | |||
| 2025-08-12 | 13F | Advisors Asset Management, Inc. | 0 | -100,00 | 0 | |||||
| 2025-08-13 | 13F | Employees Retirement System of Texas | 6 823 | -56,79 | 0 | |||||
| 2025-07-29 | 13F | Activest Wealth Management | 315 | 6,06 | 9 | 0,00 | ||||
| 2025-08-28 | NP | NDOW - Anydrus Advantage ETF | 2 976 | 90 | ||||||
| 2025-08-08 | 13F | Pnc Financial Services Group, Inc. | 10 | -80,00 | 0 | -100,00 | ||||
| 2025-08-12 | 13F | Prudential Plc | 680 185 | -9,73 | 20 474 | -12,80 | ||||
| 2025-08-14 | 13F | Verition Fund Management LLC | 0 | -100,00 | 0 | |||||
| 2025-08-13 | 13F | Arrowstreet Capital, Limited Partnership | 0 | -100,00 | 0 | |||||
| 2025-08-08 | 13F | Principal Financial Group Inc | 129 297 | 35,41 | 3 892 | 30,79 | ||||
| 2025-08-27 | NP | TPDAX - Timothy Plan Defensive Strategies Fund Class A | 1 095 | 0,00 | 33 | -5,88 | ||||
| 2025-05-02 | 13F | Concord Wealth Partners | 0 | -100,00 | 0 | |||||
| 2025-08-14 | 13F | Jane Street Group, Llc | Call | 11 100 | 334 | |||||
| 2025-08-14 | 13F | Jane Street Group, Llc | Put | 17 800 | 536 | |||||
| 2025-08-15 | 13F | WealthCollab, LLC | 178 | 0,00 | 5 | 0,00 | ||||
| 2025-08-14 | 13F | CoreCommodity Management, LLC | 35 444 | -1,30 | 1 067 | -4,74 | ||||
| 2025-08-14 | 13F | GWM Advisors LLC | 1 200 | 0,00 | 36 | -2,70 | ||||
| 2025-07-30 | 13F | Whittier Trust Co | 180 | 5 | ||||||
| 2025-08-14 | 13F | Millennium Management Llc | 38 975 | -69,27 | 1 173 | -70,31 | ||||
| 2025-03-27 | NP | RTNAX - Tax-Managed International Equity Fund Class A | 41 955 | 0,00 | 1 259 | -12,09 | ||||
| 2025-08-12 | 13F | O'shaughnessy Asset Management, Llc | 13 058 | -8,98 | 393 | -12,08 | ||||
| 2025-07-29 | NP | BPLSX - Boston Partners Long/Short Equity Fund INSTITUTIONAL | 10 217 | 4,31 | 280 | -1,06 | ||||
| 2025-08-06 | 13F | First Horizon Advisors, Inc. | 24 | 1 | ||||||
| 2025-08-26 | NP | OEQAX - Oaktree Emerging Markets Equity Fund Class A | 51 529 | 3,41 | 1 551 | -0,06 | ||||
| 2025-08-12 | 13F | Atlas Capital Advisors Llc | 1 195 | 0,00 | 36 | -5,41 | ||||
| 2025-08-14 | 13F | Susquehanna International Group, Llp | Call | 30 900 | 930 | |||||
| 2025-08-14 | 13F | Susquehanna International Group, Llp | Put | 10 800 | -83,31 | 325 | -83,88 | |||
| 2025-07-15 | 13F | Mather Group, Llc. | 0 | -100,00 | 0 | |||||
| 2025-08-13 | 13F | Renaissance Technologies Llc | 247 900 | -2,56 | 7 462 | -5,88 | ||||
| 2025-07-24 | 13F | Us Bancorp \de\ | 0 | -100,00 | 0 | |||||
| 2025-08-13 | 13F | Jump Financial, LLC | 0 | -100,00 | 0 | |||||
| 2025-06-30 | NP | VASVX - Vanguard Selected Value Fund Investor Shares | 1 180 696 | 0,00 | 34 075 | -3,80 | ||||
| 2025-05-09 | 13F | R Squared Ltd | 0 | -100,00 | 0 | |||||
| 2025-08-14 | 13F | Wiley Bros.-aintree Capital, Llc | 9 325 | 282 | ||||||
| 2025-07-08 | 13F | Lingohr & Partner Asset Management GmbH | 0 | -100,00 | 0 | |||||
| 2025-06-26 | NP | GYLD - Arrow Dow Jones Global Yield ETF | 5 123 | 148 | ||||||
| 2025-08-13 | 13F | Schroder Investment Management Group | 2 177 525 | 11,03 | 65 544 | 7,25 | ||||
| 2025-08-14 | 13F | Sei Investments Co | 25 884 | -46,93 | 779 | -48,72 | ||||
| 2025-08-14 | 13F | Voloridge Investment Management, Llc | 49 856 | -15,30 | 1 501 | -18,21 | ||||
| 2025-05-05 | 13F | Eagle Bay Advisors LLC | 0 | -100,00 | 0 | -100,00 | ||||
| 2025-06-26 | NP | MSTFX - Morningstar International Equity Fund | 17 336 | 15,91 | 500 | 11,61 | ||||
| 2025-08-13 | 13F | Contrarian Capital Management, L.l.c. | 992 413 | 0,00 | 29 872 | -3,40 | ||||
| 2025-08-14 | 13F | Susquehanna International Group, Llp | 0 | -100,00 | 0 | |||||
| 2025-08-14 | 13F | Numerai GP LLC | 11 471 | -11,87 | 345 | -14,81 | ||||
| 2025-08-28 | NP | EDIV - SPDR(R) S&P(R) Emerging Markets Dividend ETF | 260 444 | 17,66 | 7 839 | 13,66 | ||||
| 2025-08-01 | 13F | Envestnet Asset Management Inc | 34 780 | -8,29 | 1 047 | -11,43 | ||||
| 2025-08-14 | 13F | CoreCap Advisors, LLC | 77 | 0,00 | 2 | 0,00 | ||||
| 2025-08-13 | 13F | Invesco Ltd. | 22 257 | 58,38 | 670 | 53,09 | ||||
| 2025-07-30 | NP | ORR - Militia Long/Short Equity ETF | 58 221 | 1 594 |