Statistiques de base
| Valeur du portefeuille | $ 607 536 944 |
| Positions actuelles | 139 |
Dernières positions, performances, ASG (à partir des dépôts 13F, 13D)
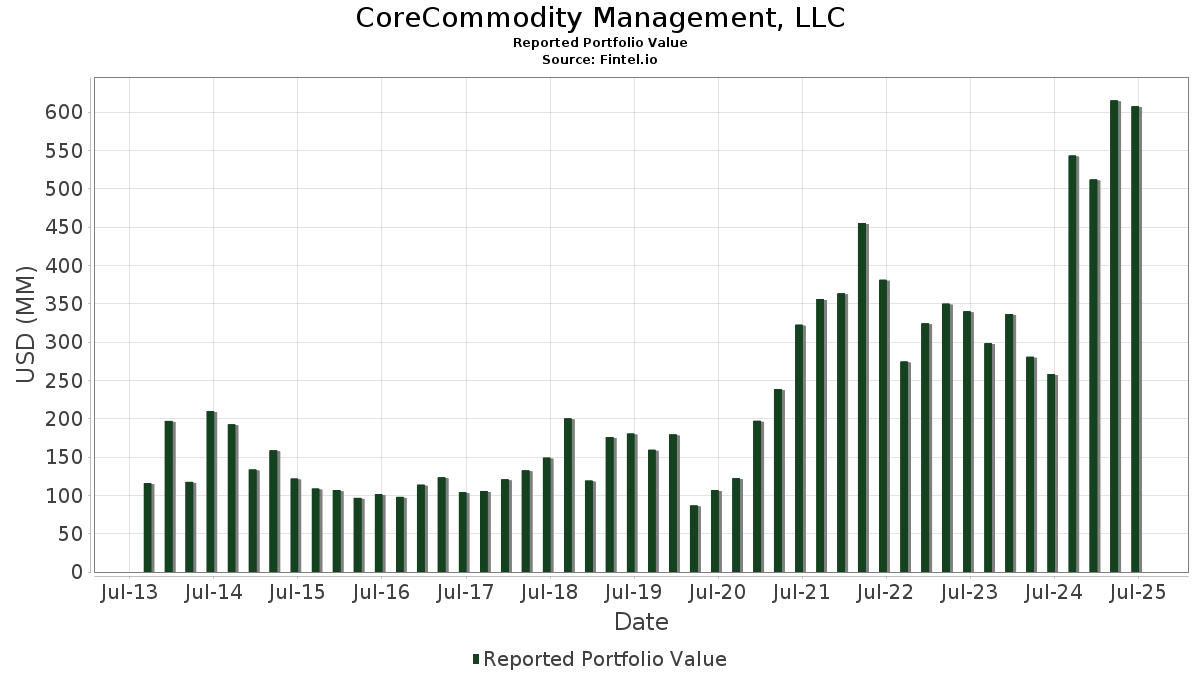
CoreCommodity Management, LLC a déclaré un total de 139 positions dans ses derniers dépôts auprès de la SEC. La valeur la plus récente du portefeuille est calculée à 607 536 944 USD. Les actifs sous gestion réels (ASG) sont cette valeur plus les liquidités (qui ne sont pas divulguées). Les principales positions de CoreCommodity Management, LLC sont Financial Investors Trust - ALPS | CoreCommodity Natural Resources ETF (US:CCNR) , Hudbay Minerals Inc. (US:HBM) , Teck Resources Limited (US:TECK) , Murphy Oil Corporation (US:MUR) , and Array Technologies, Inc. (US:ARRY) . Les nouvelles positions de CoreCommodity Management, LLC incluent Barrick Mining Corporation (DE:ABR0) , .
Meilleures augmentations ce trimestre
Nous utilisons la variation de l'allocation du portefeuille car il s'agit de l'indicateur le plus significatif. Les changements peuvent être dus à des transactions ou à des variations de prix des actions.
| Titre | Actions (en millions) |
Valeur ($ en millions) |
% du portefeuille | ΔPortefeuille % |
|---|---|---|---|---|
| 0,85 | 9,03 | 1,4782 | 0,8508 | |
| 0,10 | 4,74 | 0,7751 | 0,7751 | |
| 1,01 | 5,95 | 0,9738 | 0,5831 | |
| 0,76 | 3,21 | 0,5253 | 0,5076 | |
| 0,05 | 3,52 | 0,5762 | 0,4307 | |
| 0,18 | 7,25 | 1,1867 | 0,3857 | |
| 0,17 | 5,23 | 0,8606 | 0,3710 | |
| 0,90 | 5,41 | 0,8906 | 0,3500 | |
| 0,02 | 3,71 | 0,6108 | 0,3368 | |
| 0,24 | 5,11 | 0,8410 | 0,3348 |
Principales baisses ce trimestre
Nous utilisons la variation de l'allocation du portefeuille car il s'agit de l'indicateur le plus significatif. Les changements peuvent être dus à des transactions ou à des variations de prix des actions.
| Titre | Actions (en millions) |
Valeur ($ en millions) |
% du portefeuille | ΔPortefeuille % |
|---|---|---|---|---|
| 0,00 | 0,77 | 0,1260 | -0,8041 | |
| 0,06 | 3,67 | 0,5999 | -0,5103 | |
| 0,04 | 4,83 | 0,7907 | -0,4304 | |
| 0,01 | 1,07 | 0,1746 | -0,4072 | |
| 0,03 | 1,15 | 0,1880 | -0,3849 | |
| 0,18 | 0,66 | 0,1086 | -0,3066 | |
| 0,04 | 0,38 | 0,0626 | -0,3020 | |
| 0,02 | 0,89 | 0,1458 | -0,2969 | |
| 0,00 | 2,27 | 0,3733 | -0,2935 | |
| 0,11 | 2,32 | 0,3791 | -0,2909 |
Déclarations 13F et dépôts de fonds
Ce formulaire a été déposé le 2025-08-14 pour la période de déclaration 2025-06-30. Cliquez sur l'icône du lien pour voir l'historique complet des transactions.
Mettre à niveau pour débloquer les données premium et exporter vers Excel ![]() .
.
| Titre | Type | Prix moyen de l'action | Actions (en millions) |
ΔActions (%) |
ΔActions (%) |
Valeur ($ en millions) |
Portefeuille (%) |
ΔPortefeuille (%) |
|
|---|---|---|---|---|---|---|---|---|---|
| CCNR / Financial Investors Trust - ALPS | CoreCommodity Natural Resources ETF | 13,33 | -8,07 | 347,78 | -1,02 | 56,9010 | -0,2258 | |||
| HBM / Hudbay Minerals Inc. | 0,85 | 67,44 | 9,03 | 134,10 | 1,4782 | 0,8508 | |||
| TECK / Teck Resources Limited | 0,18 | 32,82 | 7,25 | 47,21 | 1,1867 | 0,3857 | |||
| MUR / Murphy Oil Corporation | 0,28 | 53,41 | 6,41 | 21,54 | 1,0487 | 0,1913 | |||
| ARRY / Array Technologies, Inc. | 1,01 | 104,45 | 5,95 | 147,75 | 0,9738 | 0,5831 | |||
| HL / Hecla Mining Company | 0,90 | 51,05 | 5,41 | 62,76 | 0,8906 | 0,3500 | |||
| CNH / CNH Industrial N.V. | 0,17 | -32,33 | 5,23 | 73,63 | 0,8606 | 0,3710 | |||
| CTVA / Corteva, Inc. | 0,07 | -1,12 | 5,14 | 17,10 | 0,8404 | 0,1273 | |||
| JKS / JinkoSolar Holding Co., Ltd. - Depositary Receipt (Common Stock) | 0,24 | 44,16 | 5,11 | 64,12 | 0,8410 | 0,3348 | |||
| SCCO / Southern Copper Corporation | 0,05 | -7,37 | 5,08 | 0,28 | 0,8312 | 0,0075 | |||
| DAR / Darling Ingredients Inc. | 0,13 | 24,65 | 4,98 | 51,43 | 0,8151 | 0,2801 | |||
| AEM / Agnico Eagle Mines Limited | 0,04 | -41,35 | 4,83 | -35,65 | 0,7907 | -0,4304 | |||
| MTDR / Matador Resources Company | 0,10 | 4,74 | 0,7751 | 0,7751 | |||||
| DVN / Devon Energy Corporation | 0,14 | 37,72 | 4,54 | 17,12 | 0,7422 | 0,1126 | |||
| COP / ConocoPhillips | 0,05 | 23,99 | 4,48 | 5,96 | 0,7380 | 0,0500 | |||
| AA / Alcoa Corporation | 0,14 | 73,05 | 4,18 | 67,47 | 0,6831 | 0,2777 | |||
| TSN / Tyson Foods, Inc. | 0,07 | -4,11 | 4,12 | -15,95 | 0,6745 | -0,1228 | |||
| ADM / Archer-Daniels-Midland Company | 0,08 | 2,26 | 4,07 | 12,43 | 0,6700 | 0,0814 | |||
| DQ / Daqo New Energy Corp. - Depositary Receipt (Common Stock) | 0,26 | -0,64 | 3,91 | -16,77 | 0,6393 | -0,1239 | |||
| BTE / Baytex Energy Corp. | 2,16 | 50,78 | 3,86 | 21,74 | 0,6323 | 0,1162 | |||
| EOG / EOG Resources, Inc. | 0,03 | 58,36 | 3,74 | 47,69 | 0,6117 | 0,2002 | |||
| FSLR / First Solar, Inc. | 0,02 | 68,18 | 3,71 | 120,18 | 0,6108 | 0,3368 | |||
| CENX / Century Aluminum Company | 0,20 | 47,10 | 3,67 | 42,85 | 0,6012 | 0,1829 | |||
| NEM / Newmont Corporation | 0,06 | -55,51 | 3,67 | -46,31 | 0,5999 | -0,5103 | |||
| WFG / West Fraser Timber Co. Ltd. | 0,05 | 312,79 | 3,52 | 293,85 | 0,5762 | 0,4307 | |||
| PPC / Pilgrim's Pride Corporation | 0,08 | -12,53 | 3,48 | -27,82 | 0,5689 | -0,2143 | |||
| CTRA / Coterra Energy Inc. | 0,13 | 9,14 | 3,33 | -4,14 | 0,5454 | -0,0200 | |||
| INGR / Ingredion Incorporated | 0,02 | -21,91 | 3,25 | -21,67 | 0,5316 | -0,1428 | |||
| SHLS / Shoals Technologies Group, Inc. | 0,76 | 2 196,19 | 3,21 | 2 844,95 | 0,5253 | 0,5076 | |||
| HCC / Warrior Met Coal, Inc. | 0,07 | 28,29 | 3,05 | 23,23 | 0,4990 | 0,0966 | |||
| SU / Suncor Energy Inc. | 0,08 | 111,19 | 3,05 | 104,29 | 0,4988 | 0,2561 | |||
| BVN / Compañía de Minas Buenaventura S.A.A. - Depositary Receipt (Common Stock) | 0,18 | -15,85 | 3,02 | -11,60 | 0,4949 | -0,0614 | |||
| CVE / Cenovus Energy Inc. | 0,21 | 197,93 | 2,92 | 191,22 | 0,4775 | 0,3145 | |||
| SM / SM Energy Company | 0,12 | 56,81 | 2,90 | 29,39 | 0,4741 | 0,1099 | |||
| HP / Helmerich & Payne, Inc. | 0,19 | 44,74 | 2,88 | -16,02 | 0,4720 | -0,0863 | |||
| CIVI / Civitas Resources, Inc. | 0,10 | 57,68 | 2,88 | 24,37 | 0,4717 | 0,0948 | |||
| LBRT / Liberty Energy Inc. | 0,25 | -4,48 | 2,88 | -30,73 | 0,4714 | -0,2048 | |||
| TALO / Talos Energy Inc. | 0,34 | 99,74 | 2,88 | 74,24 | 0,4705 | 0,2022 | |||
| PTEN / Patterson-UTI Energy, Inc. | 0,46 | 36,59 | 2,73 | -1,48 | 0,4469 | -0,0038 | |||
| PR / Permian Resources Corporation | 0,20 | 230,85 | 2,70 | 225,45 | 0,4441 | 0,3093 | |||
| CRC / California Resources Corporation | 0,06 | 112,01 | 2,62 | 120,37 | 0,4284 | 0,2351 | |||
| PUMP / ProPetro Holding Corp. | 0,43 | 153,46 | 2,56 | 105,94 | 0,4195 | 0,2170 | |||
| FMC / FMC Corporation | 0,06 | -1,05 | 2,54 | -2,08 | 0,4180 | -0,0037 | |||
| TDW / Tidewater Inc. | 0,05 | 0,67 | 2,53 | 9,87 | 0,4137 | 0,0395 | |||
| MGY / Magnolia Oil & Gas Corporation | 0,11 | -5,18 | 2,50 | -15,63 | 0,4098 | -0,0728 | |||
| VET / Vermilion Energy Inc. | 0,33 | 30,62 | 2,42 | 17,88 | 0,3958 | 0,0621 | |||
| CHRD / Chord Energy Corporation | 0,02 | 2,01 | 2,34 | -12,34 | 0,3835 | -0,0513 | |||
| EGO / Eldorado Gold Corporation | 0,11 | -53,51 | 2,32 | -43,80 | 0,3791 | -0,2909 | |||
| DE / Deere & Company | 0,00 | -48,96 | 2,27 | -44,72 | 0,3733 | -0,2935 | |||
| CGAU / Centerra Gold Inc. | 0,31 | -38,86 | 2,22 | -30,52 | 0,3640 | -0,1565 | |||
| HAL / Halliburton Company | 0,11 | 11,26 | 2,22 | -10,61 | 0,3648 | -0,0384 | |||
| HRL / Hormel Foods Corporation | 0,07 | -11,78 | 2,21 | -13,75 | 0,3645 | -0,0529 | |||
| OII / Oceaneering International, Inc. | 0,10 | 30,59 | 2,03 | 24,07 | 0,3324 | 0,0662 | |||
| CHX / ChampionX Corporation | 0,08 | -14,32 | 1,98 | -28,60 | 0,3240 | -0,1268 | |||
| CALM / Cal-Maine Foods, Inc. | 0,02 | -8,74 | 1,82 | 0,00 | 0,2996 | 0,0037 | |||
| STR / Sitio Royalties Corp. | 0,09 | 1,73 | 0,2835 | 0,2835 | |||||
| AWR / American States Water Company | 0,02 | -2,05 | 1,73 | -4,59 | 0,2841 | -0,0099 | |||
| CNQ / Canadian Natural Resources Limited | 0,05 | -6,09 | 1,65 | -4,23 | 0,2707 | -0,0101 | |||
| CWT / California Water Service Group | 0,04 | -9,57 | 1,64 | -15,11 | 0,2675 | -0,0457 | |||
| XPRO / Expro Group Holdings N.V. | 0,19 | 147,54 | 1,62 | 113,98 | 0,2655 | 0,1422 | |||
| KGCRF / Kinross Gold Corporation - Equity Right | 0,10 | 858,50 | 1,56 | 1 090,84 | 0,2568 | 0,2355 | |||
| HLX / Helix Energy Solutions Group, Inc. | 0,24 | -2,45 | 1,52 | -26,77 | 0,2495 | -0,0889 | |||
| IAG / IAMGOLD Corporation | 0,20 | 1 723,51 | 1,49 | 2 060,87 | 0,2441 | 0,2328 | |||
| WTTR / Select Water Solutions, Inc. | 0,17 | 49,19 | 1,49 | 22,81 | 0,2432 | 0,0463 | |||
| SEI / Solaris Energy Infrastructure, Inc. | 0,05 | 1,46 | 0,2383 | 0,2383 | |||||
| HTO / H2O America | 0,03 | -2,19 | 1,43 | -7,09 | 0,2339 | -0,0162 | |||
| DNOW / DNOW Inc. | 0,09 | -13,09 | 1,39 | -24,53 | 0,2281 | -0,0723 | |||
| PAASF / Pan American Silver Corp. - Equity Right | 0,05 | 9,17 | 1,39 | 20,05 | 0,2273 | 0,0391 | |||
| ERO / Ero Copper Corp. | 0,08 | 0,44 | 1,33 | 39,96 | 0,2178 | 0,0631 | |||
| AMR / Alpha Metallurgical Resources, Inc. | 0,01 | -1,48 | 1,21 | -11,57 | 0,1978 | -0,0244 | |||
| RES / RPC, Inc. | 0,25 | -42,94 | 1,18 | -50,95 | 0,1935 | -0,1984 | |||
| EOSE / Eos Energy Enterprises, Inc. | 0,23 | 27,30 | 1,18 | 72,66 | 0,1944 | 0,0830 | |||
| NE / Noble Corporation plc | 0,04 | -22,08 | 1,17 | -12,75 | 0,1916 | -0,0265 | |||
| VNOM / Viper Energy, Inc. | 0,03 | 1,17 | 0,1914 | 0,1914 | |||||
| FCX / Freeport-McMoRan Inc. | 0,03 | -71,52 | 1,15 | -67,40 | 0,1880 | -0,3849 | |||
| SD / SandRidge Energy, Inc. | 0,10 | -18,84 | 1,12 | -23,10 | 0,1825 | -0,0533 | |||
| PCH / PotlatchDeltic Corporation | 0,03 | -25,98 | 1,10 | -37,11 | 0,1793 | -0,1038 | |||
| VLTO / Veralto Corporation | 0,01 | -71,22 | 1,07 | -70,21 | 0,1746 | -0,4072 | |||
| TX / Ternium S.A. - Depositary Receipt (Common Stock) | 0,04 | -1,30 | 1,07 | -4,74 | 0,1746 | -0,0074 | |||
| FDP / Fresh Del Monte Produce Inc. | 0,03 | -1,32 | 1,05 | 3,77 | 0,1713 | 0,0073 | |||
| NOG / Northern Oil and Gas, Inc. | 0,03 | 73,51 | 0,99 | 62,83 | 0,1620 | 0,0631 | |||
| DOLE / Dole plc | 0,07 | -1,33 | 0,97 | -4,54 | 0,1585 | -0,0064 | |||
| NTR / Nutrien Ltd. | 0,02 | -55,44 | 0,96 | -47,74 | 0,1573 | -0,1418 | |||
| ADECOAGRO S A / (LO0849106) | 0,10 | 0,95 | 0,0000 | ||||||
| FLNG / FLEX LNG Ltd. | 0,04 | -1,39 | 0,93 | -5,75 | 0,1539 | -0,0073 | |||
| TWI / Titan International, Inc. | 0,09 | -24,74 | 0,91 | -7,89 | 0,1491 | -0,0117 | |||
| WTRG / Essential Utilities, Inc. | 0,02 | -65,16 | 0,89 | -67,27 | 0,1458 | -0,2969 | |||
| RNW / ReNew Energy Global Plc | 0,12 | 335,59 | 0,84 | 410,98 | 0,1372 | 0,1106 | |||
| NXE / NexGen Energy Ltd. | 0,11 | -65,29 | 0,79 | -46,39 | 0,1300 | -0,1108 | |||
| ARIS / Aris Water Solutions, Inc. | 0,03 | 4,88 | 0,79 | -22,62 | 0,1289 | -0,0365 | |||
| EFXT / Enerflex Ltd. | 0,10 | -1,18 | 0,77 | 0,92 | 0,1261 | 0,0018 | |||
| RGLD / Royal Gold, Inc. | 0,00 | -87,62 | 0,77 | -86,54 | 0,1260 | -0,8041 | |||
| ABR0 / Barrick Mining Corporation | 0,04 | 0,76 | 0,1259 | 0,1259 | |||||
| NPKI / NPK International Inc. | 0,09 | -1,68 | 0,75 | 43,89 | 0,1235 | 0,0383 | |||
| CLB / Core Laboratories Inc. | 0,06 | -1,34 | 0,75 | -24,24 | 0,1223 | -0,0380 | |||
| SLB / Schlumberger Limited | 0,02 | -41,24 | 0,68 | -52,48 | 0,1119 | -0,1207 | |||
| PDS / Precision Drilling Corporation | 0,01 | -1,25 | 0,67 | 0,60 | 0,1100 | 0,0012 | |||
| BTG / B2Gold Corp. | 0,18 | -79,48 | 0,66 | -74,03 | 0,1086 | -0,3066 | |||
| BSM / Black Stone Minerals, L.P. - Limited Partnership | 0,05 | -3,22 | 0,65 | -17,09 | 0,1064 | -0,0211 | |||
| NOV / NOV Inc. | 0,05 | -1,82 | 0,61 | -19,76 | 0,0990 | -0,0237 | |||
| ICL / ICL Group Ltd | 0,09 | -5,82 | 0,60 | 13,80 | 0,0986 | 0,0126 | |||
| KGS / Kodiak Gas Services, Inc. | 0,02 | -30,38 | 0,60 | -36,08 | 0,0978 | -0,0541 | |||
| MOS / The Mosaic Company | 0,02 | -67,83 | 0,58 | -56,60 | 0,0954 | -0,1215 | |||
| AR / Antero Resources Corporation | 0,01 | 0,56 | 0,0909 | 0,0909 | |||||
| REX / REX American Resources Corporation | 0,01 | -5,60 | 0,54 | 22,52 | 0,0890 | 0,0167 | |||
| ATI / ATI Inc. | 0,01 | -85,10 | 0,52 | -75,28 | 0,0853 | -0,2575 | |||
| CF / CF Industries Holdings, Inc. | 0,01 | -7,49 | 0,52 | 9,11 | 0,0848 | 0,0079 | |||
| SXC / SunCoke Energy, Inc. | 0,05 | -1,31 | 0,47 | -7,74 | 0,0761 | -0,0060 | |||
| ENPH / Enphase Energy, Inc. | 0,01 | 43,95 | 0,46 | -7,97 | 0,0756 | -0,0061 | |||
| FANG / Diamondback Energy, Inc. | 0,00 | 0,45 | 0,0742 | 0,0742 | |||||
| BHP / BHP Group Limited - Depositary Receipt (Common Stock) | 0,01 | 43,50 | 0,44 | 42,31 | 0,0731 | 0,0223 | |||
| XOM / Exxon Mobil Corporation | 0,00 | -5,33 | 0,44 | -14,34 | 0,0715 | -0,0113 | |||
| METC / Ramaco Resources, Inc. | 0,03 | -74,63 | 0,42 | -59,52 | 0,0693 | -0,1007 | |||
| AGCO / AGCO Corporation | 0,00 | -72,97 | 0,39 | -69,88 | 0,0645 | -0,1482 | |||
| CDE / Coeur Mining, Inc. | 0,04 | -88,67 | 0,38 | -83,05 | 0,0626 | -0,3020 | |||
| CMP / Compass Minerals International, Inc. | 0,02 | -60,78 | 0,37 | -15,23 | 0,0611 | -0,0105 | |||
| RIO / Rio Tinto Group - Depositary Receipt (Common Stock) | 0,01 | 28,48 | 0,34 | 25,00 | 0,0557 | 0,0113 | |||
| CVX / Chevron Corporation | 0,00 | -3,52 | 0,34 | -17,40 | 0,0552 | -0,0112 | |||
| MTUS / Metallus Inc. | 0,02 | -4,55 | 0,33 | 10,17 | 0,0532 | 0,0052 | |||
| OXY / Occidental Petroleum Corporation | 0,01 | -73,78 | 0,32 | -77,75 | 0,0519 | -0,1790 | |||
| NFG / National Fuel Gas Company | 0,00 | -44,87 | 0,32 | -41,12 | 0,0517 | -0,0354 | |||
| RYN / Rayonier Inc. | 0,01 | 0,00 | 0,31 | -20,51 | 0,0512 | -0,0124 | |||
| BKR / Baker Hughes Company | 0,01 | -39,15 | 0,31 | -47,00 | 0,0507 | -0,0442 | |||
| GFI / Gold Fields Limited - Depositary Receipt (Common Stock) | 0,01 | -86,41 | 0,29 | -85,44 | 0,0476 | -0,2753 | |||
| EQT / EQT Corporation | 0,00 | -1,65 | 0,29 | 7,09 | 0,0471 | 0,0035 | |||
| MP / MP Materials Corp. | 0,01 | -84,02 | 0,29 | -78,23 | 0,0468 | -0,1669 | |||
| CNX / CNX Resources Corporation | 0,01 | -4,50 | 0,27 | 2,24 | 0,0451 | 0,0015 | |||
| HES / Hess Corporation | 0,00 | -3,71 | 0,27 | -16,46 | 0,0441 | -0,0084 | |||
| EGY / VAALCO Energy, Inc. | 0,07 | -80,74 | 0,26 | -81,52 | 0,0420 | -0,1824 | |||
| ALB / Albemarle Corporation | 0,00 | -1,33 | 0,25 | -14,33 | 0,0412 | -0,0065 | |||
| CSIQ / Canadian Solar Inc. | 0,02 | -4,44 | 0,23 | 21,81 | 0,0378 | 0,0072 | |||
| APA / APA Corporation | 0,01 | -64,79 | 0,23 | -69,38 | 0,0370 | -0,0831 | |||
| VALE / Vale S.A. - Depositary Receipt (Common Stock) | 0,02 | 38,97 | 0,22 | 35,37 | 0,0364 | 0,0096 | |||
| CRGY / Crescent Energy Company | 0,02 | -7,22 | 0,20 | -28,99 | 0,0322 | -0,0129 | |||
| CLF / Cleveland-Cliffs Inc. | 0,02 | -1,15 | 0,15 | -8,98 | 0,0250 | -0,0022 | |||
| PBR / Petróleo Brasileiro S.A. - Petrobras - Depositary Receipt (Common Stock) | 0,01 | 0,00 | 0,15 | -12,79 | 0,0247 | -0,0034 | |||
| HPK / HighPeak Energy, Inc. | 0,01 | 2,08 | 0,13 | -21,21 | 0,0214 | -0,0055 | |||
| FLNC / Fluence Energy, Inc. | 0,01 | 0,00 | 0,07 | 39,58 | 0,0110 | 0,0031 | |||
| GGB / Gerdau S.A. - Depositary Receipt (Common Stock) | 0,02 | 0,00 | 0,07 | 3,13 | 0,0108 | 0,0004 | |||
| GPRE / Green Plains Inc. | 0,00 | -100,00 | 0,00 | 0,0000 | |||||
| AGRO / Adecoagro S.A. | 0,00 | -100,00 | 0,00 | 0,0000 | |||||
| VRN / Veren Inc. | 0,00 | -100,00 | 0,00 | 0,0000 | |||||
| IMO / Imperial Oil Limited | 0,00 | -100,00 | 0,00 | 0,0000 | |||||
| GPOR / Gulfport Energy Corporation | 0,00 | -100,00 | 0,00 | 0,0000 | |||||
| STLD / Steel Dynamics, Inc. | 0,00 | -100,00 | 0,00 | 0,0000 | |||||
| KOS / Kosmos Energy Ltd. | 0,00 | -100,00 | 0,00 | 0,0000 | |||||
| BG / Bunge Global SA | 0,00 | -100,00 | 0,00 | 0,0000 | |||||
| X / United States Steel Corporation | 0,00 | -100,00 | 0,00 | 0,0000 | |||||
| UEC / Uranium Energy Corp. | 0,00 | -100,00 | 0,00 | 0,0000 | |||||
| WPM / Wheaton Precious Metals Corp. | 0,00 | -100,00 | 0,00 | 0,0000 | |||||
| FNV / Franco-Nevada Corporation | 0,00 | -100,00 | 0,00 | 0,0000 | |||||
| AESI / Atlas Energy Solutions Inc. | 0,00 | -100,00 | 0,00 | 0,0000 | |||||
| NBR / Nabors Industries Ltd. | 0,00 | -100,00 | 0,00 | 0,0000 | |||||
| GOLD / Barrick Mining Corporation | 0,00 | -100,00 | 0,00 | 0,0000 | |||||
| GPRK / GeoPark Limited | 0,00 | -100,00 | 0,00 | 0,0000 | |||||
| GEVO / Gevo, Inc. | 0,00 | -100,00 | 0,00 | 0,0000 | |||||
| SBS / Companhia de Saneamento Básico do Estado de São Paulo - SABESP - Depositary Receipt (Common Stock) | 0,00 | -100,00 | 0,00 | 0,0000 |