Statistiques de base
| Propriétaires institutionnels | 160 total, 160 long only, 0 short only, 0 long/short - change of 1,91% MRQ |
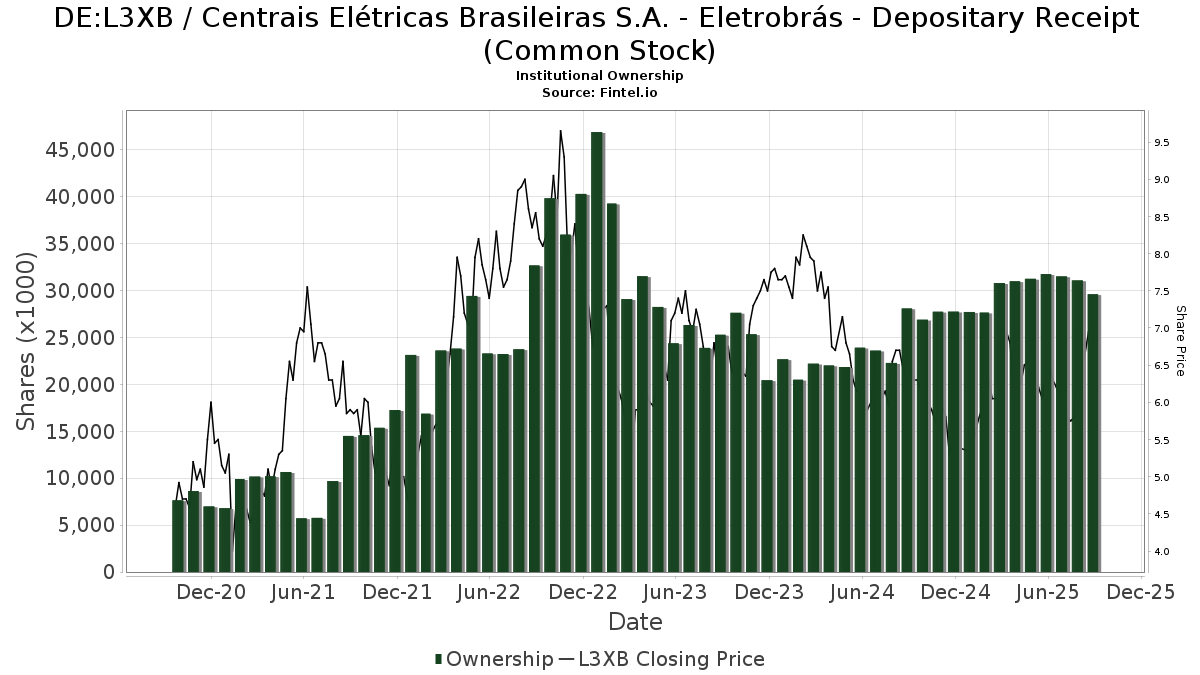
| Prix de l'action | 6,95 |
| Allocation moyenne du portefeuille | 0.1523 % - change of -1,92% MRQ |
| Actions institutionnelles (Long) | 29 603 677 (ex 13D/G) - change of -1,75MM shares -5,58% MRQ |
| Valeur institutionnelle (Long) | $ 215 105 USD ($1000) |
Participation institutionnels et actionnaires
Centrais Elétricas Brasileiras S.A. - Eletrobrás - Depositary Receipt (Common Stock) (DE:L3XB) détient 160 des propriétaires institutionnels et des actionnaires qui ont déposé des formulaires 13D/G ou 13F auprès de la Securities Exchange Commission (SEC). Ces institutions détiennent un total de 29,603,677 actions. Les principaux actionnaires incluent State Street Corp, BlackRock, Inc., IGF - iShares Global Infrastructure ETF, UBS Group AG, Millennium Management Llc, SPEM - SPDR(R) Portfolio Emerging Markets ETF, Vanguard Group Inc, KOMP - SPDR S&P Kensho New Economies Composite ETF, American Century Companies Inc, and Morgan Stanley .
Centrais Elétricas Brasileiras S.A. - Eletrobrás - Depositary Receipt (Common Stock) (DB:L3XB) la structure de l'actionnariat institutionnel indique les positions actuelles des institutions et des fonds dans l'entreprise, ainsi que les derniers changements dans le volume des positions. Les principaux actionnaires peuvent être des investisseurs individuels, des fonds communs de placement, des fonds spéculatifs ou des institutions. L'annexe 13D indique que l'investisseur détient (ou a détenu) plus de 5 % de l'entreprise et qu'il a l'intention (ou a eu l'intention) de poursuivre activement un changement de stratégie commerciale. L'annexe 13G indique un investissement passif de plus de 5 %.
The share price as of September 5, 2025 is 6,95 / share. Previously, on September 9, 2024, the share price was 6,50 / share. This represents an increase of 6,92% over that period.
Indice de confiance des fonds
L'indice de confiance des fonds (anciennement score d'accumulation de participation) trouve les actions qui sont les plus achetées par les fonds. Il est le résultat d'un modèle quantitatif sophistiqué à plusieurs facteurs qui identifie les entreprises avec les niveaux les plus élevés d'accumulation institutionnelle. Le modèle de notation utilise une combinaison de l'augmentation totale des propriétaires déclarés, des variations des allocations de portefeuille chez ces propriétaires et d'autres indicateurs. Le chiffre varie de 0 à 100, les chiffres plus élevés indiquant un niveau d'accumulation plus élevé par rapport aux autres entreprises, 50 étant la moyenne.
Fréquence de mise à jour : Quotidienne
Déclarations 13F et NPORT
Les détails des déclarations 13F sont gratuits. Les détails des déclarations NP nécessitent une adhésion premium. Les lignes vertes indiquent de nouvelles positions. Les lignes rouges indiquent des positions clôturées. Cliquez sur l'icône du lien pour voir l'historique complet des transactions.
Mettre à niveau
pour débloquer des données premium et les exporter vers Excel ![]() .
.
| Date de dépôt | Source | Investisseur | Type | Prix moyen (Est) |
Actions | Δ Actions (%) |
Valeur déclarée (1000 $) |
Δ Valeur (%) |
Allocation de portefeuille (%) |
|
|---|---|---|---|---|---|---|---|---|---|---|
| 2025-07-25 | 13F | Yousif Capital Management, Llc | 32 133 | 4,78 | 239 | 9,68 | ||||
| 2025-08-14 | 13F | Aquatic Capital Management LLC | 63 470 | 40,76 | 472 | 47,19 | ||||
| 2025-08-13 | 13F | Quantbot Technologies LP | 0 | -100,00 | 0 | |||||
| 2025-08-28 | NP | SPEM - SPDR(R) Portfolio Emerging Markets ETF | 1 540 850 | 8,36 | 11 449 | 13,39 | ||||
| 2025-08-14 | 13F | Bank Of America Corp /de/ | 99 179 | -27,84 | 737 | -24,51 | ||||
| 2025-08-12 | 13F | Clear Street Markets Llc | 0 | -100,00 | 0 | |||||
| 2025-08-12 | 13F | Barings Llc | 674 385 | -15,25 | 5 011 | -11,31 | ||||
| 2025-07-24 | 13F | Jfs Wealth Advisors, Llc | 246 | 0,00 | 2 | 0,00 | ||||
| 2025-08-11 | 13F | Principal Securities, Inc. | 0 | -100,00 | 0 | |||||
| 2025-08-13 | 13F | Northern Trust Corp | 867 325 | 6,80 | 6 444 | 11,76 | ||||
| 2025-08-13 | 13F | First Trust Advisors Lp | 14 865 | 18,83 | 110 | 25,00 | ||||
| 2025-08-14 | 13F | MIRAE ASSET GLOBAL ETFS HOLDINGS Ltd. | 24 418 | 42,46 | 181 | 49,59 | ||||
| 2025-08-12 | 13F | Dimensional Fund Advisors Lp | 313 359 | 61,18 | 2 328 | 68,70 | ||||
| 2025-08-25 | 13F/A | Neuberger Berman Group LLC | 24 829 | 52,50 | 184 | 338,10 | ||||
| 2025-05-09 | 13F | R Squared Ltd | 0 | -100,00 | 0 | |||||
| 2025-08-14 | 13F | Cubist Systematic Strategies, LLC | 126 492 | -77,57 | 940 | -76,54 | ||||
| 2025-08-13 | 13F | Renaissance Technologies Llc | 298 800 | 210,60 | 2 220 | 225,04 | ||||
| 2025-07-14 | 13F | GAMMA Investing LLC | 7 318 | 59,26 | 54 | 68,75 | ||||
| 2025-08-14 | 13F | Aqr Capital Management Llc | 57 611 | -35,38 | 428 | -32,28 | ||||
| 2025-08-07 | 13F | Vise Technologies, Inc. | 10 017 | 74 | ||||||
| 2025-06-23 | NP | UBPIX - Ultralatin America Profund Investor Class | 18 106 | -6,18 | 139 | 16,81 | ||||
| 2025-08-12 | 13F | SPX Equities Gestao de Recursos Ltda | 670 083 | 12,80 | 4 979 | 18,05 | ||||
| 2025-08-14 | 13F | Two Sigma Investments, Lp | 268 144 | -4,17 | 1 992 | 0,30 | ||||
| 2025-08-12 | 13F | LPL Financial LLC | 85 842 | 638 | ||||||
| 2025-08-13 | 13F | EverSource Wealth Advisors, LLC | 3 060 | 2 560,87 | 23 | |||||
| 2025-07-24 | 13F | Us Bancorp \de\ | 13 252 | 17,33 | 98 | 22,50 | ||||
| 2025-08-07 | 13F | Profund Advisors Llc | 40 650 | -3,86 | 302 | 0,67 | ||||
| 2025-08-13 | 13F | Russell Investments Group, Ltd. | 131 820 | 36,64 | 979 | 43,13 | ||||
| 2025-04-11 | 13F | First Affirmative Financial Network | 45 691 | 16,27 | 324 | 44,64 | ||||
| 2025-08-06 | 13F | Agf Management Ltd | 0 | -100,00 | 0 | |||||
| 2025-07-28 | NP | AVXC - Avantis Emerging Markets ex-China Equity ETF | 33 231 | 137,67 | 244 | 167,03 | ||||
| 2025-05-14 | 13F | Walleye Capital LLC | 0 | -100,00 | 0 | |||||
| 2025-08-13 | 13F | West Family Investments, Inc. | 13 312 | 99 | ||||||
| 2025-08-14 | 13F | Two Sigma Advisers, Lp | 21 800 | -11,02 | 162 | -6,94 | ||||
| 2025-07-28 | 13F | Frazier Financial Advisors, LLC | 0 | -100,00 | 0 | |||||
| 2025-08-05 | 13F | Key FInancial Inc | 1 010 | 0,00 | 8 | 0,00 | ||||
| 2025-08-07 | 13F | Allworth Financial LP | 59 | 63,89 | 0 | |||||
| 2025-08-14 | 13F | Brevan Howard Capital Management LP | 130 000 | 956 | ||||||
| 2025-08-07 | 13F | Parkside Financial Bank & Trust | 178 | 1 | ||||||
| 2025-06-26 | NP | DFEM - Dimensional Emerging Markets Core Equity 2 ETF | 25 630 | 37,57 | 197 | 71,30 | ||||
| 2025-08-06 | 13F | Metis Global Partners, LLC | 48 580 | 19,55 | 361 | 25,00 | ||||
| 2025-08-14 | 13F | Macquarie Group Ltd | 989 541 | 0,00 | 7 352 | 4,64 | ||||
| 2025-08-01 | 13F | Envestnet Asset Management Inc | 10 233 | -22,86 | 76 | -19,15 | ||||
| 2025-07-30 | 13F | D.a. Davidson & Co. | 13 500 | 100 | ||||||
| 2025-08-14 | 13F | Jane Street Group, Llc | 0 | -100,00 | 0 | |||||
| 2025-08-07 | 13F | Connor, Clark & Lunn Investment Management Ltd. | 0 | -100,00 | 0 | |||||
| 2025-08-14 | 13F | VPR Management LLC | 100 104 | 0,00 | 744 | 4,65 | ||||
| 2025-08-05 | 13F | NewSquare Capital LLC | 205 | 21,30 | 2 | 0,00 | ||||
| 2025-07-16 | 13F | Highline Wealth Partners Llc | 781 | 25,76 | 6 | 25,00 | ||||
| 2025-08-14 | 13F | Millennium Management Llc | 1 819 819 | 143,71 | 13 521 | 155,07 | ||||
| 2025-08-28 | NP | CNRG - SPDR S&P Kensho Clean Power ETF This fund is a listed as child fund of State Street Corp and if that institution has disclosed ownership in this security, then these positions will not be double counted when calculating total shares and total value | 382 737 | 2,59 | 2 844 | 7,36 | ||||
| 2025-08-12 | 13F | American Century Companies Inc | 1 107 818 | 62,10 | 8 231 | 69,64 | ||||
| 2025-08-12 | 13F | Jpmorgan Chase & Co | 6 652 | 16,48 | 49 | 22,50 | ||||
| 2025-08-26 | NP | IGF - iShares Global Infrastructure ETF | 2 107 523 | 13,28 | 15 659 | 18,54 | ||||
| 2025-07-14 | 13F | Kapitalo Investimentos Ltda | 327 535 | -44,37 | 2 434 | -41,79 | ||||
| 2025-08-13 | 13F | Marshall Wace, Llp | 0 | -100,00 | 0 | |||||
| 2025-08-11 | 13F | Brown Brothers Harriman & Co | 348 | 3 | ||||||
| 2025-08-14 | 13F | Raymond James Financial Inc | 3 596 | 27 | ||||||
| 2025-07-23 | 13F | High Note Wealth, LLC | 19 | 0,00 | 0 | |||||
| 2025-08-07 | 13F | Sierra Ocean, Llc | 543 | 7,74 | 4 | 33,33 | ||||
| 2025-08-13 | 13F | Quadrant Capital Group Llc | 30 423 | 212,90 | 226 | 227,54 | ||||
| 2025-08-29 | NP | LIVR - Intelligent Livermore ETF | 23 657 | 176 | ||||||
| 2025-08-14 | 13F | Balyasny Asset Management Llc | 0 | -100,00 | 0 | |||||
| 2025-08-14 | 13F | Mariner, LLC | 109 377 | 159,62 | 813 | 171,57 | ||||
| 2025-07-28 | NP | AVEEX - Avantis Emerging Markets Equity Fund Institutional Class This fund is a listed as child fund of American Century Companies Inc and if that institution has disclosed ownership in this security, then these positions will not be double counted when calculating total shares and total value | 55 225 | 0,00 | 405 | 12,22 | ||||
| 2025-08-14 | 13F | State Street Corp | 3 785 310 | 33,41 | 28 125 | 39,61 | ||||
| 2025-08-12 | 13F | MAI Capital Management | 1 163 | 9 | ||||||
| 2025-08-28 | NP | KOMP - SPDR S&P Kensho New Economies Composite ETF This fund is a listed as child fund of State Street Corp and if that institution has disclosed ownership in this security, then these positions will not be double counted when calculating total shares and total value | 1 193 156 | 217,27 | 8 865 | 232,02 | ||||
| 2025-08-14 | 13F | Vident Advisory, LLC | 62 657 | 12,34 | 466 | 17,72 | ||||
| 2025-08-14 | 13F | Citadel Advisors Llc | 195 435 | -49,12 | 1 452 | -46,74 | ||||
| 2025-08-11 | 13F | Vanguard Group Inc | 1 321 891 | 0,00 | 9 822 | 4,65 | ||||
| 2025-07-29 | NP | RBB FUND, INC. - Aquarius International Fund | 6 734 | 0,00 | 49 | 13,95 | ||||
| 2025-06-26 | NP | DFAE - Dimensional Emerging Core Equity Market ETF | 122 200 | 51,61 | 941 | 88,76 | ||||
| 2025-08-13 | 13F | PineBridge Investments, L.P. | 301 493 | 14,21 | 2 240 | 19,53 | ||||
| 2025-08-14 | 13F | Hrt Financial Lp | 0 | -100,00 | 0 | |||||
| 2025-08-08 | 13F | Pnc Financial Services Group, Inc. | 15 957 | 22,70 | 119 | 28,26 | ||||
| 2025-08-12 | 13F | Pathstone Holdings, LLC | 14 915 | 3,22 | 111 | 7,84 | ||||
| 2025-08-12 | 13F | BlackRock, Inc. | 3 345 371 | 15,18 | 24 856 | 20,53 | ||||
| 2025-08-05 | 13F | Huntington National Bank | 1 | 0,00 | 0 | |||||
| 2025-08-08 | 13F | Beck Bode, LLC | 0 | -100,00 | 0 | |||||
| 2025-06-18 | NP | RTXAX - Tax-Managed Real Assets Fund Class A | 96 470 | 0,00 | 743 | 24,29 | ||||
| 2025-08-12 | 13F | XTX Topco Ltd | 21 938 | -74,66 | 163 | -73,62 | ||||
| 2025-07-28 | NP | AVEM - Avantis Emerging Markets Equity ETF This fund is a listed as child fund of American Century Companies Inc and if that institution has disclosed ownership in this security, then these positions will not be double counted when calculating total shares and total value | 916 596 | 60,85 | 6 719 | 80,83 | ||||
| 2025-08-14 | 13F | Barometer Capital Management Inc. | 14 325 | 106 | ||||||
| 2025-08-11 | 13F | Bell Investment Advisors, Inc | 89 | 0,00 | 1 | |||||
| 2025-08-13 | 13F | Mackenzie Financial Corp | 15 083 | 15,04 | 112 | 20,43 | ||||
| 2025-07-30 | NP | BRAZ - Global X Brazil Active ETF | 24 418 | 39,81 | 179 | 57,52 | ||||
| 2025-08-08 | 13F | Principal Financial Group Inc | 92 759 | 689 | ||||||
| 2025-08-12 | 13F | O'shaughnessy Asset Management, Llc | 98 382 | 12,46 | 731 | 17,55 | ||||
| 2025-08-08 | 13F | SG Americas Securities, LLC | 10 690 | -2,32 | 0 | |||||
| 2025-07-28 | NP | AVSE - Avantis Responsible Emerging Markets Equity ETF | 9 818 | -5,70 | 72 | 5,97 | ||||
| 2025-07-24 | 13F | IFP Advisors, Inc | 146 | 0,00 | 1 | 0,00 | ||||
| 2025-08-08 | 13F | SBI Securities Co., Ltd. | 696 | 0,00 | 5 | 25,00 | ||||
| 2025-07-31 | 13F | Sumitomo Mitsui Trust Holdings, Inc. | 72 300 | 0,00 | 537 | 4,68 | ||||
| 2025-08-13 | 13F | Cerity Partners LLC | 0 | -100,00 | 0 | |||||
| 2025-08-14 | 13F | Van Eck Associates Corp | 477 335 | -5,32 | 4 | 0,00 | ||||
| 2025-08-08 | 13F | Crossmark Global Holdings, Inc. | 138 107 | -0,06 | 1 026 | 4,59 | ||||
| 2025-08-12 | 13F | Global Retirement Partners, LLC | 3 774 | 28 | ||||||
| 2025-07-21 | 13F | Mirae Asset Global Investments Co., Ltd. | 49 879 | -80,46 | 371 | -79,88 | ||||
| 2025-08-04 | 13F | Assetmark, Inc | 122 | -58,50 | 1 | -100,00 | ||||
| 2025-08-08 | 13F | Larson Financial Group LLC | 541 | 4 | ||||||
| 2025-08-08 | 13F | Cetera Investment Advisers | 0 | -100,00 | 0 | |||||
| 2025-08-13 | 13F | Twin Peaks Wealth Advisors, LLC | 1 150 | 10 | ||||||
| 2025-08-06 | 13F | True Wealth Design, LLC | 54 | -12,90 | 0 | |||||
| 2025-08-14 | 13F | Schonfeld Strategic Advisors LLC | 0 | -100,00 | 0 | |||||
| 2025-08-11 | 13F | Frank, Rimerman Advisors LLC | 24 199 | 180 | ||||||
| 2025-04-21 | 13F | Nelson, Van Denburg & Campbell Wealth Management Group, LLC | 0 | -100,00 | 0 | |||||
| 2025-08-15 | 13F | Morgan Stanley | 1 041 850 | -30,99 | 7 741 | -27,79 | ||||
| 2025-09-04 | 13F/A | Advisor Group Holdings, Inc. | 14 009 | 4,85 | 104 | 10,64 | ||||
| 2025-05-15 | 13F | Main Management ETF Advisors, LLC | 0 | -100,00 | 0 | |||||
| 2025-08-14 | 13F | Two Sigma Securities, Llc | 37 423 | 278 | ||||||
| 2025-08-13 | 13F | Guggenheim Capital Llc | 110 333 | 29,49 | 820 | 35,60 | ||||
| 2025-08-14 | 13F | Ameriprise Financial Inc | 33 257 | 21,61 | 247 | 27,32 | ||||
| 2025-08-20 | NP | REMG - Emerging Markets Equity Active ETF | 17 675 | 131 | ||||||
| 2025-08-14 | 13F | Jain Global LLC | 0 | -100,00 | 0 | |||||
| 2025-08-26 | NP | Profunds - Profund Vp Emerging Markets | 15 578 | 1,99 | 116 | 6,48 | ||||
| 2025-08-14 | 13F | Wells Fargo & Company/mn | 1 | -99,39 | 0 | -100,00 | ||||
| 2025-08-14 | 13F | UBS Group AG | 1 998 426 | -63,19 | 14 848 | -61,48 | ||||
| 2025-07-25 | 13F | Cwm, Llc | 4 271 | 19,44 | 0 | |||||
| 2025-08-14 | 13F | Engineers Gate Manager LP | 98 576 | 37,89 | 732 | 44,38 | ||||
| 2025-07-22 | 13F | Gsa Capital Partners Llp | 19 171 | 0 | ||||||
| 2025-08-14 | 13F/A | Skopos Labs, Inc. | 16 315 | 65,38 | 121 | 72,86 | ||||
| 2025-08-13 | 13F | Wealthquest Corp | 0 | -100,00 | 0 | -100,00 | ||||
| 2025-07-30 | 13F | Drive Wealth Management, Llc | 10 043 | 75 | ||||||
| 2025-08-14 | 13F | Bnp Paribas Arbitrage, Sa | 38 810 | 7,53 | 288 | 12,50 | ||||
| 2025-08-25 | NP | GRID - First Trust NASDAQ Clean Edge Smart Grid Infrastructure Index Fund This fund is a listed as child fund of First Trust Advisors Lp and if that institution has disclosed ownership in this security, then these positions will not be double counted when calculating total shares and total value | 8 393 | 19,15 | 62 | 24,00 | ||||
| 2025-08-13 | 13F | Northwestern Mutual Wealth Management Co | 2 332 | 17 | ||||||
| 2025-07-25 | NP | DEMAX - Delaware Emerging Markets Fund Class A | 989 541 | 0,00 | 7 253 | 12,43 | ||||
| 2025-05-05 | 13F | Lindbrook Capital, Llc | 393 | 97,49 | 3 | 100,00 | ||||
| 2025-08-04 | 13F | Spire Wealth Management | 554 | 0,00 | 4 | 33,33 | ||||
| 2025-08-12 | 13F | Coldstream Capital Management Inc | 0 | -100,00 | 0 | |||||
| 2025-08-14 | 13F | Atomi Financial Group, Inc. | 50 145 | -5,11 | 373 | -0,80 | ||||
| 2025-08-12 | 13F | Deutsche Bank Ag\ | 4 383 | 29,94 | 33 | 39,13 | ||||
| 2025-07-23 | 13F | InTrack Investment Management Inc | 108 776 | 808 | ||||||
| 2025-08-14 | 13F | Quantinno Capital Management LP | 70 120 | 136,56 | 521 | 147,62 | ||||
| 2025-08-08 | 13F | Creative Planning | 62 171 | 11,96 | 462 | 17,01 | ||||
| 2025-08-08 | 13F | North of South Capital LLP | 219 652 | 0,00 | 1 632 | 4,68 | ||||
| 2025-07-08 | 13F | Parallel Advisors, LLC | 1 352 | -20,42 | 10 | -16,67 | ||||
| 2025-08-12 | 13F | Aigen Investment Management, Lp | 11 371 | 84 | ||||||
| 2025-06-26 | NP | DEXC - Dimensional Emerging Markets ex China Core Equity ETF | 11 600 | 20,83 | 89 | 50,85 | ||||
| 2025-07-30 | NP | APIE - ActivePassive International Equity ETF | 37 042 | -0,29 | 272 | 27,83 | ||||
| 2025-08-14 | 13F/A | Barclays Plc | 2 500 | 0,00 | 0 | |||||
| 2025-07-16 | 13F | Signaturefd, Llc | 7 034 | -0,07 | 52 | 6,12 | ||||
| 2025-08-12 | 13F | Proequities, Inc. | 0 | 0 | ||||||
| 2025-08-14 | 13F | Federation des caisses Desjardins du Quebec | 342 | 714,29 | 3 | |||||
| 2025-07-18 | 13F | Deltec Asset Management Llc | 145 500 | 0,00 | 1 081 | 4,65 | ||||
| 2025-08-14 | 13F | Goldman Sachs Group Inc | 674 095 | 2,34 | 5 009 | 7,10 | ||||
| 2025-08-14 | 13F | Royal Bank Of Canada | 4 977 | -83,79 | 37 | -83,11 | ||||
| 2025-08-14 | 13F | Susquehanna International Group, Llp | 19 123 | 142 | ||||||
| 2025-08-26 | NP | EMIF - iShares Emerging Markets Infrastructure ETF | 49 185 | -31,37 | 365 | -28,15 | ||||
| 2025-08-14 | 13F | Stifel Financial Corp | 33 673 | -11,30 | 250 | -7,06 | ||||
| 2025-08-12 | 13F | Trexquant Investment LP | 0 | -100,00 | 0 | |||||
| 2025-08-12 | 13F | Rhumbline Advisers | 19 590 | 22,63 | 146 | 28,32 | ||||
| 2025-08-15 | 13F | Tower Research Capital LLC (TRC) | 0 | -100,00 | 0 | |||||
| 2025-08-13 | 13F | Hsbc Holdings Plc | 482 797 | 10,10 | 3 587 | 15,23 | ||||
| 2025-08-21 | NP | HAP - VanEck Vectors Natural Resources ETF | 97 179 | -0,39 | 722 | 4,34 | ||||
| 2025-04-29 | 13F | Generali Investments CEE, investicni spolecnost, a.s. | 0 | -100,00 | 0 | |||||
| 2025-06-26 | NP | DFAX - Dimensional World ex U.S. Core Equity 2 ETF | 37 570 | 0,00 | 289 | 24,57 | ||||
| 2025-08-14 | 13F | Ieq Capital, Llc | 13 526 | 100 | ||||||
| 2025-08-13 | 13F | GQG Partners LLC | 21 089 | 157 | ||||||
| 2025-07-25 | 13F | Sequoia Financial Advisors, LLC | 17 500 | 0,66 | 130 | 5,69 | ||||
| 2025-08-25 | NP | SISLX - Shelton International Select Equity Fund Investor Class | 32 582 | 0,00 | 242 | 4,76 | ||||
| 2025-05-05 | 13F | Creekmur Asset Management LLC | 0 | -100,00 | 0 | |||||
| 2025-08-11 | 13F | Citigroup Inc | 31 964 | 4,98 | 237 | 9,72 | ||||
| 2025-06-26 | NP | DFSE - Dimensional Emerging Markets Sustainability Core 1 ETF | 3 400 | 25,93 | 26 | 62,50 | ||||
| 2025-08-11 | 13F | EntryPoint Capital, LLC | 27 171 | -25,97 | 202 | -22,69 | ||||
| 2025-08-14 | 13F | Point72 (DIFC) Ltd | 0 | -100,00 | 0 | |||||
| 2025-08-11 | 13F | Empowered Funds, LLC | 23 657 | 176 | ||||||
| 2025-08-15 | 13F | CI Private Wealth, LLC | 59 612 | 0,59 | 443 | 5,24 | ||||
| 2025-08-28 | NP | GII - SPDR(R) S&P GLOBAL INFRASTRUCTURE ETF | 153 879 | 1,96 | 1 143 | 6,72 | ||||
| 2025-08-04 | 13F | Hantz Financial Services, Inc. | 12 198 | 957,94 | 0 | |||||
| 2025-06-26 | NP | SNTKX - Steward International Enhanced Index Fund Class A | 81 639 | 0,00 | 629 | 24,36 | ||||
| 2025-08-13 | 13F | Amundi | 349 464 | -9,20 | 2 600 | -7,83 | ||||
| 2025-08-13 | 13F | Shelton Capital Management | 55 437 | -0,41 | 412 | 4,05 | ||||
| 2025-08-14 | 13F | Boston Private Wealth Llc | 0 | -100,00 | 0 | |||||
| 2025-08-13 | 13F | Invesco Ltd. | 60 486 | 140,58 | 449 | 152,25 | ||||
| 2025-08-14 | 13F | Fmr Llc | 77 659 | -8,25 | 577 | -3,83 | ||||
| 2025-07-24 | 13F | Ronald Blue Trust, Inc. | 3 653 | 3,57 | 27 | 8,00 | ||||
| 2025-07-14 | 13F | Abound Wealth Management | 34 | 0,00 | 0 | |||||
| 2025-07-28 | NP | NSI - National Security Emerging Markets Index ETF | 2 265 | 38,53 | 17 | 60,00 | ||||
| 2025-08-21 | NP | SMOG - VanEck Vectors Low Carbon Energy ETF | 405 140 | -6,13 | 3 010 | -1,76 | ||||
| 2025-08-27 | NP | RYWTX - Emerging Markets 2x Strategy Fund Class A | 4 855 | 127,40 | 36 | 140,00 | ||||
| 2025-08-13 | 13F | Natixis Advisors, L.p. | 45 125 | 12,47 | 0 | |||||
| 2025-07-11 | 13F | Farther Finance Advisors, LLC | 1 220 | 33,92 | 9 | 50,00 | ||||
| 2025-06-23 | NP | UUPIX - Ultraemerging Markets Profund Investor Class | 4 096 | 19,07 | 32 | 47,62 | ||||
| 2025-08-14 | 13F | Point72 Asset Management, L.P. | 458 930 | 38,82 | 3 410 | 45,25 | ||||
| 2025-05-15 | 13F | Point72 Asia (Singapore) Pte. Ltd. | 0 | -100,00 | 0 | |||||
| 2025-07-24 | 13F | Lester Murray Antman dba SimplyRich | 70 179 | -3,65 | 1 | |||||
| 2025-07-15 | 13F | Fifth Third Bancorp | 90 | 0,00 | 1 |
Other Listings
| US:EBR | 8,46 $US |