Statistiques de base
| Propriétaires institutionnels | 218 total, 217 long only, 0 short only, 1 long/short - change of 14,74% MRQ |
| Allocation moyenne du portefeuille | 0.0718 % - change of -6,05% MRQ |
| Actions institutionnelles (Long) | 18 966 222 (ex 13D/G) - change of 1,00MM shares 5,54% MRQ |
| Valeur institutionnelle (Long) | $ 844 166 USD ($1000) |
Participation institutionnels et actionnaires
Chunghwa Telecom Co., Ltd. - Depositary Receipt (Common Stock) (US:CHT) détient 218 des propriétaires institutionnels et des actionnaires qui ont déposé des formulaires 13D/G ou 13F auprès de la Securities Exchange Commission (SEC). Ces institutions détiennent un total de 18,966,222 actions. Les principaux actionnaires incluent Renaissance Technologies Llc, BlackRock, Inc., Vanguard Group Inc, Morgan Stanley, Connor, Clark & Lunn Investment Management Ltd., VEIEX - Vanguard Emerging Markets Stock Index Fund Investor Shares, Northern Trust Corp, Schroder Investment Management Group, Td Asset Management Inc, and Acadian Asset Management Llc .
Chunghwa Telecom Co., Ltd. - Depositary Receipt (Common Stock) (NYSE:CHT) la structure de l'actionnariat institutionnel indique les positions actuelles des institutions et des fonds dans l'entreprise, ainsi que les derniers changements dans le volume des positions. Les principaux actionnaires peuvent être des investisseurs individuels, des fonds communs de placement, des fonds spéculatifs ou des institutions. L'annexe 13D indique que l'investisseur détient (ou a détenu) plus de 5 % de l'entreprise et qu'il a l'intention (ou a eu l'intention) de poursuivre activement un changement de stratégie commerciale. L'annexe 13G indique un investissement passif de plus de 5 %.
The share price as of September 5, 2025 is 44,18 / share. Previously, on September 9, 2024, the share price was 38,75 / share. This represents an increase of 14,01% over that period.

Indice de confiance des fonds
L'indice de confiance des fonds (anciennement score d'accumulation de participation) trouve les actions qui sont les plus achetées par les fonds. Il est le résultat d'un modèle quantitatif sophistiqué à plusieurs facteurs qui identifie les entreprises avec les niveaux les plus élevés d'accumulation institutionnelle. Le modèle de notation utilise une combinaison de l'augmentation totale des propriétaires déclarés, des variations des allocations de portefeuille chez ces propriétaires et d'autres indicateurs. Le chiffre varie de 0 à 100, les chiffres plus élevés indiquant un niveau d'accumulation plus élevé par rapport aux autres entreprises, 50 étant la moyenne.
Fréquence de mise à jour : Quotidienne
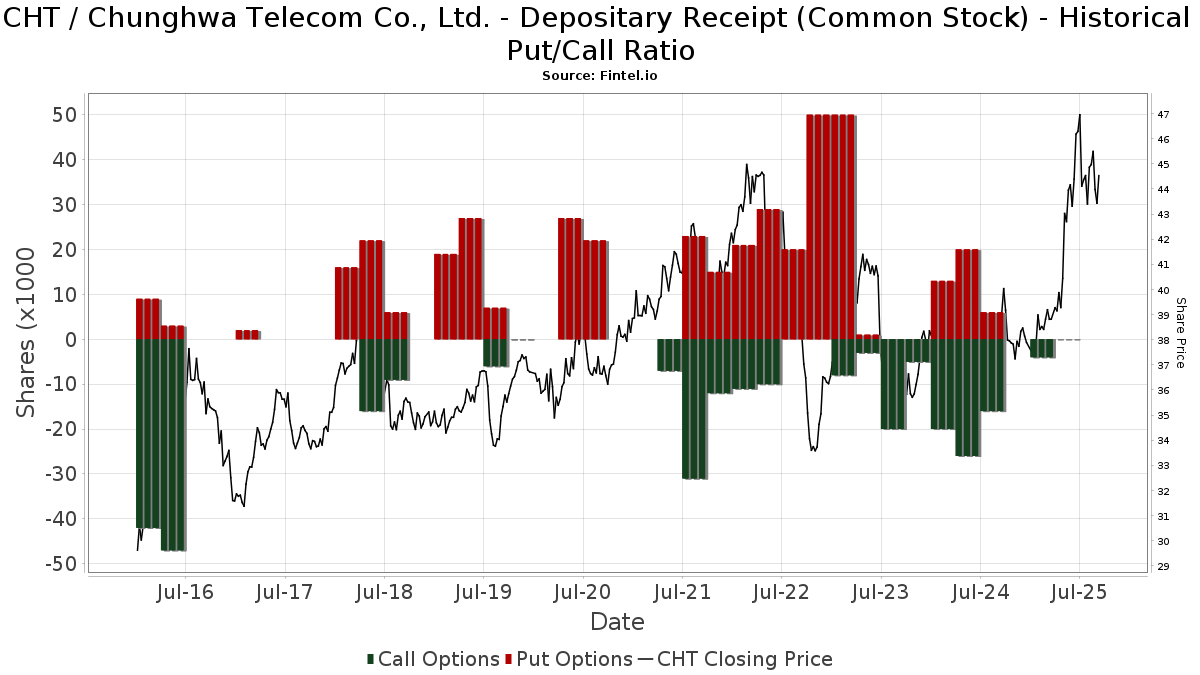
Ratio put/call institutionnel
En plus de signaler les actions et les dettes standard, les institutions ayant plus de 100 millions d'actifs sous gestion doivent également divulguer leurs positions en options de vente et d'achat. Étant donné que les options de vente indiquent généralement une confiance négative, et les options d'achat indiquent une confiance positive, nous pouvons avoir une idée de la confiance institutionnelle globale en traçant le ratio des ventes à découvert par rapport aux achats d'options. Le graphique à droite trace l'historique du ratio des ventes à découvert/achats d'options pour cet instrument.
L'utilisation du ratio put/call comme indicateur de la confiance des investisseurs permet de pallier à l'une des principales lacunes de l'utilisation de la participation institutionnelle totale, à savoir qu'une part importante des actifs sous gestion est investie passivement pour suivre les indices. Les fonds gérés passivement n'achètent généralement pas d'options, de sorte que l'indicateur du ratio put/call suit de plus près la confiance des fonds gérés activement.
Déclarations 13F et NPORT
Les détails des déclarations 13F sont gratuits. Les détails des déclarations NP nécessitent une adhésion premium. Les lignes vertes indiquent de nouvelles positions. Les lignes rouges indiquent des positions clôturées. Cliquez sur l'icône du lien pour voir l'historique complet des transactions.
Mettre à niveau
pour débloquer des données premium et les exporter vers Excel ![]() .
.
| Date de dépôt | Source | Investisseur | Type | Prix moyen (Est) |
Actions | Δ Actions (%) |
Valeur déclarée (1000 $) |
Δ Valeur (%) |
Allocation de portefeuille (%) |
|
|---|---|---|---|---|---|---|---|---|---|---|
| 2025-07-29 | 13F | Private Trust Co Na | 25 | -68,35 | 1 | -66,67 | ||||
| 2025-06-30 | NP | VEU - Vanguard FTSE All-World ex-US Index Fund ETF Shares | 381 442 | 0,00 | 15 426 | 4,12 | ||||
| 2025-06-23 | NP | UUPIX - Ultraemerging Markets Profund Investor Class | 1 590 | 10,88 | 64 | 16,36 | ||||
| 2025-07-25 | 13F | Yousif Capital Management, Llc | 12 229 | 3,08 | 570 | 22,37 | ||||
| 2025-06-26 | NP | DFA INVESTMENT DIMENSIONS GROUP INC - World ex U.S. Core Equity Portfolio Institutional Class Shares | 3 400 | 0,00 | 137 | 3,79 | ||||
| 2025-08-26 | NP | Profunds - Profund Vp Emerging Markets | 6 484 | 9,27 | 302 | 30,17 | ||||
| 2025-07-29 | 13F | Hoese & Co LLP | 250 | 12 | ||||||
| 2025-07-28 | NP | AVXC - Avantis Emerging Markets ex-China Equity ETF | 5 393 | 4,17 | 234 | 16,42 | ||||
| 2025-08-12 | 13F | Rhumbline Advisers | 230 188 | -12,93 | 10 729 | 3,50 | ||||
| 2025-08-08 | 13F | Geode Capital Management, Llc | 0 | -100,00 | 0 | |||||
| 2025-06-26 | NP | DFAE - Dimensional Emerging Core Equity Market ETF | 88 000 | 6,02 | 3 559 | 10,39 | ||||
| 2025-06-26 | NP | TWAAX - Thrivent International Allocation Fund Class A | 1 302 | -40,60 | 53 | -38,82 | ||||
| 2025-08-05 | 13F | Key FInancial Inc | 227 | 0,00 | 11 | 25,00 | ||||
| 2025-08-14 | 13F | GWM Advisors LLC | 163 | -3,55 | 8 | 16,67 | ||||
| 2025-05-13 | 13F | Mondrian Investment Partners LTD | 201 153 | -15,00 | 7 887 | -14,19 | ||||
| 2025-08-07 | 13F | Resources Investment Advisors, LLC. | 7 767 | 0,26 | 362 | 19,47 | ||||
| 2025-08-08 | 13F | Creative Planning | 317 369 | 18,02 | 14 793 | 40,29 | ||||
| 2025-04-11 | 13F | First Affirmative Financial Network | 32 108 | 3,06 | 1 259 | 7,25 | ||||
| 2025-08-04 | 13F | Hantz Financial Services, Inc. | 840 | 1 083,10 | 0 | |||||
| 2025-07-25 | 13F | Sequoia Financial Advisors, LLC | 44 077 | 47,31 | 2 054 | 75,11 | ||||
| 2025-07-30 | 13F | Whittier Trust Co | 334 | 70,41 | 16 | 114,29 | ||||
| 2025-08-01 | 13F | Bessemer Group Inc | 11 515 | 0,88 | 1 | |||||
| 2025-08-07 | 13F | Profund Advisors Llc | 8 898 | 16,18 | 415 | 38,00 | ||||
| 2025-08-14 | 13F | Syon Capital Llc | 4 906 | 229 | ||||||
| 2025-08-13 | 13F | First Trust Advisors Lp | 22 371 | -2,68 | 1 043 | 15,65 | ||||
| 2025-08-13 | 13F | West Family Investments, Inc. | 47 872 | -0,29 | 2 231 | 18,54 | ||||
| 2025-07-18 | 13F | Robeco Institutional Asset Management B.V. | 136 807 | 0,00 | 6 377 | 18,87 | ||||
| 2025-06-26 | NP | DFEM - Dimensional Emerging Markets Core Equity 2 ETF | 38 188 | 0,00 | 1 544 | 4,11 | ||||
| 2025-08-11 | 13F | Morling Financial Advisors, LLC | 0 | -100,00 | 0 | |||||
| 2025-07-24 | 13F | Jfs Wealth Advisors, Llc | 267 | -30,65 | 12 | -20,00 | ||||
| 2025-07-30 | 13F | Whittier Trust Co Of Nevada Inc | 5 883 | -18,10 | 274 | -2,49 | ||||
| 2025-08-18 | 13F/A | National Bank Of Canada /fi/ | 210 | 388,37 | 10 | 800,00 | ||||
| 2025-07-29 | NP | RBB FUND, INC. - Aquarius International Fund | 4 171 | 0,00 | 181 | 11,73 | ||||
| 2025-07-14 | 13F | GAMMA Investing LLC | 9 530 | 85,19 | 444 | 120,90 | ||||
| 2025-05-08 | 13F | Waldron Private Wealth LLC | 0 | -100,00 | 0 | |||||
| 2025-08-13 | 13F | Northwestern Mutual Wealth Management Co | 347 | 16 | ||||||
| 2025-08-13 | 13F | Kayne Anderson Rudnick Investment Management Llc | 14 562 | 0,17 | 679 | 19,16 | ||||
| 2025-08-27 | 13F/A | Brinker Capital Investments, LLC | 56 012 | 21,54 | 2 611 | 44,44 | ||||
| 2025-08-29 | NP | MPLAX - Praxis International Index Fund Class A | 139 043 | -7,55 | 6 481 | 9,89 | ||||
| 2025-08-07 | 13F | Sierra Ocean, Llc | 1 132 | 4,62 | 53 | 23,81 | ||||
| 2025-08-14 | 13F | Citadel Advisors Llc | Call | 0 | -100,00 | 0 | ||||
| 2025-08-08 | 13F | D'Orazio & Associates, Inc. | 6 720 | 11,85 | 313 | 33,19 | ||||
| 2025-08-12 | 13F | Pathstone Holdings, LLC | 43 898 | -0,49 | 2 046 | 18,33 | ||||
| 2025-08-14 | 13F | Smartleaf Asset Management LLC | 1 133 | 53 | ||||||
| 2025-08-08 | 13F | Pnc Financial Services Group, Inc. | 18 656 | 15,19 | 870 | 36,85 | ||||
| 2025-06-26 | NP | Thrivent Core Funds - Thrivent Core Emerging Markets Equity Fund | 9 576 | -29,76 | 387 | -26,84 | ||||
| 2025-08-11 | 13F | Bell Investment Advisors, Inc | 455 | -20,87 | 21 | -4,55 | ||||
| 2025-07-25 | 13F | JustInvest LLC | 118 456 | 17,76 | 5 521 | 39,98 | ||||
| 2025-08-14 | 13F | Glenmede Investment Management, LP | 4 516 | 210 | ||||||
| 2025-08-14 | 13F | Mml Investors Services, Llc | 11 615 | 5,74 | 1 | |||||
| 2025-08-18 | 13F | Geneos Wealth Management Inc. | 144 | 29,73 | 7 | 50,00 | ||||
| 2025-08-11 | 13F | Vanguard Group Inc | 2 115 089 | -0,46 | 98 584 | 18,32 | ||||
| 2025-06-27 | NP | HAOSX - Harbor Overseas Fund Institutional Class | 8 076 | 327 | ||||||
| 2025-06-26 | NP | DAADX - Emerging Markets ex China Core Equity Portfolio Institutional Class | 18 891 | 0,00 | 764 | 4,09 | ||||
| 2025-08-12 | 13F | Dimensional Fund Advisors Lp | 452 982 | 4,04 | 21 124 | 23,72 | ||||
| 2025-07-16 | 13F | Kathmere Capital Management, LLC | 43 304 | 7,98 | 2 018 | 28,37 | ||||
| 2025-08-07 | 13F | Parkside Financial Bank & Trust | 296 | 957,14 | 14 | 1 200,00 | ||||
| 2025-06-26 | NP | DFAX - Dimensional World ex U.S. Core Equity 2 ETF | 7 515 | 0,00 | 304 | 4,12 | ||||
| 2025-07-25 | 13F | Hazlett, Burt & Watson, Inc. | 250 | 0,00 | 0 | |||||
| 2025-07-28 | NP | AVEEX - Avantis Emerging Markets Equity Fund Institutional Class This fund is a listed as child fund of American Century Companies Inc and if that institution has disclosed ownership in this security, then these positions will not be double counted when calculating total shares and total value | 25 406 | 0,00 | 1 105 | 11,85 | ||||
| 2025-05-15 | 13F | Aquatic Capital Management LLC | 0 | -100,00 | 0 | |||||
| 2025-08-13 | 13F | GeoWealth Management, LLC | 1 925 | -0,10 | 90 | 18,67 | ||||
| 2025-08-14 | 13F | Goldman Sachs Group Inc | 256 261 | 33,33 | 11 944 | 58,49 | ||||
| 2025-08-14 | 13F | Modern Wealth Management, LLC | 5 016 | -23,38 | 234 | -8,98 | ||||
| 2025-08-12 | 13F | Jpmorgan Chase & Co | 540 | -99,18 | 25 | -99,04 | ||||
| 2025-08-14 | 13F | Evergreen Capital Management Llc | 14 577 | 679 | ||||||
| 2025-06-26 | NP | SNTKX - Steward International Enhanced Index Fund Class A | 44 597 | 0,00 | 1 804 | 4,10 | ||||
| 2025-08-11 | 13F | United Capital Financial Advisers, Llc | 7 740 | -9,63 | 361 | 7,46 | ||||
| 2025-07-31 | 13F | R Squared Ltd | 0 | -100,00 | 0 | |||||
| 2025-08-06 | 13F | Texas Yale Capital Corp. | 9 000 | 0,00 | 419 | 19,03 | ||||
| 2025-07-15 | 13F | Ballentine Partners, LLC | 41 561 | 9,80 | 1 937 | 30,53 | ||||
| 2025-08-05 | 13F | Simplex Trading, Llc | Put | 100 | 0 | |||||
| 2025-08-05 | 13F | Simplex Trading, Llc | 56 | 0 | ||||||
| 2025-05-01 | 13F | Bleakley Financial Group, LLC | 0 | -100,00 | 0 | -100,00 | ||||
| 2025-07-30 | 13F | Drive Wealth Management, Llc | 8 634 | 402 | ||||||
| 2025-08-14 | 13F | Verition Fund Management LLC | 7 338 | -25,46 | 342 | -11,17 | ||||
| 2025-08-14 | 13F | Atomi Financial Group, Inc. | 9 551 | 16,18 | 445 | 38,20 | ||||
| 2025-06-26 | NP | DFA INVESTMENT DIMENSIONS GROUP INC - Emerging Markets Social Core Equity Portfolio Shares | 12 202 | 0,00 | 493 | 4,23 | ||||
| 2025-08-14 | 13F | Xponance, Inc. | 5 899 | 13,16 | 275 | 34,31 | ||||
| 2025-06-30 | NP | VT - Vanguard Total World Stock Index Fund ETF Shares | 81 784 | 0,00 | 3 307 | 4,12 | ||||
| 2025-08-14 | 13F | Vident Advisory, LLC | 109 845 | 43,69 | 5 120 | 70,80 | ||||
| 2025-06-30 | NP | VEIEX - Vanguard Emerging Markets Stock Index Fund Investor Shares | 1 176 664 | -6,03 | 47 584 | -2,15 | ||||
| 2025-08-12 | 13F | American Century Companies Inc | 329 461 | 17,59 | 15 356 | 39,78 | ||||
| 2025-08-13 | 13F | Guggenheim Capital Llc | 43 040 | 3,59 | 2 006 | 23,14 | ||||
| 2025-08-12 | 13F | SRS Capital Advisors, Inc. | 729 | 34 | ||||||
| 2025-08-14 | 13F | Boston Private Wealth Llc | 0 | -100,00 | 0 | |||||
| 2025-07-14 | 13F | Foster Group, Inc. | 11 443 | -9,85 | 533 | 7,24 | ||||
| 2025-07-25 | 13F | Cwm, Llc | 2 910 | -2,94 | 0 | |||||
| 2025-08-12 | 13F | Steward Partners Investment Advisory, Llc | 144 | 0,00 | 7 | 20,00 | ||||
| 2025-06-26 | NP | DEXC - Dimensional Emerging Markets ex China Core Equity ETF | 5 900 | 20,41 | 239 | 25,26 | ||||
| 2025-05-01 | 13F | Schechter Investment Advisors, LLC | 9 081 | -31,38 | 356 | -28,51 | ||||
| 2025-05-13 | 13F | Thrivent Financial For Lutherans | 0 | -100,00 | 0 | |||||
| 2025-05-15 | 13F | Glenmede Trust Co Na | 0 | -100,00 | 0 | |||||
| 2025-07-21 | 13F | Mirae Asset Global Investments Co., Ltd. | 172 | 8 | ||||||
| 2025-08-11 | 13F | Brown Brothers Harriman & Co | 306 | 14 | ||||||
| 2025-04-21 | 13F | Nelson, Van Denburg & Campbell Wealth Management Group, LLC | 0 | -100,00 | 0 | |||||
| 2025-08-07 | 13F | Connor, Clark & Lunn Investment Management Ltd. | 1 253 331 | 12,23 | 58 418 | 33,41 | ||||
| 2025-08-06 | 13F | Savant Capital, LLC | 29 691 | 1 384 | ||||||
| 2025-08-14 | 13F | Millennium Management Llc | 6 570 | 306 | ||||||
| 2025-05-14 | 13F | Van Hulzen Asset Management, LLC | 0 | -100,00 | 0 | |||||
| 2025-08-14 | 13F | Bank Of America Corp /de/ | 310 705 | 9,59 | 14 482 | 30,26 | ||||
| 2025-08-25 | 13F | Fulcrum Equity Management | 5 374 | 250 | ||||||
| 2025-08-04 | 13F | Capital Performance Advisors Llp | 6 558 | 306 | ||||||
| 2025-08-12 | 13F | XTX Topco Ltd | 0 | -100,00 | 0 | |||||
| 2025-08-14 | 13F | Royal Bank Of Canada | 1 308 | -37,95 | 61 | -26,51 | ||||
| 2025-07-24 | 13F | IFP Advisors, Inc | 103 | 0,00 | 5 | 0,00 | ||||
| 2025-08-14 | 13F/A | Skopos Labs, Inc. | 4 591 | 1 006,27 | 214 | 1 231,25 | ||||
| 2025-08-13 | 13F | Townsquare Capital Llc | 0 | -100,00 | 0 | |||||
| 2025-07-09 | 13F | Aaron Wealth Advisors LLC | 5 564 | 259 | ||||||
| 2025-08-13 | 13F | Schroder Investment Management Group | 675 278 | 2,70 | 31 475 | 21,89 | ||||
| 2025-08-12 | 13F | Proequities, Inc. | Put | 0 | 0 | |||||
| 2025-06-26 | NP | Dfa Investment Trust Co - The Emerging Markets Series This fund is a listed as child fund of Dimensional Fund Advisors Lp and if that institution has disclosed ownership in this security, then these positions will not be double counted when calculating total shares and total value | 111 161 | 0,00 | 4 495 | 4,12 | ||||
| 2025-08-12 | 13F | Proequities, Inc. | Call | 0 | 0 | |||||
| 2025-08-15 | 13F | WealthCollab, LLC | 291 | 0,00 | 14 | 18,18 | ||||
| 2025-08-12 | 13F | Proequities, Inc. | 0 | 0 | ||||||
| 2025-07-14 | 13F | Abound Wealth Management | 32 | -13,51 | 1 | 0,00 | ||||
| 2025-07-23 | 13F | High Note Wealth, LLC | 5 | 0,00 | 0 | |||||
| 2025-08-27 | 13F/A | Squarepoint Ops LLC | 0 | -100,00 | 0 | -100,00 | ||||
| 2025-08-14 | 13F | Driehaus Capital Management Llc | 36 471 | 0,00 | 1 700 | 18,81 | ||||
| 2025-08-12 | 13F | Global Retirement Partners, LLC | 246 | 11 | ||||||
| 2025-08-14 | 13F | Ieq Capital, Llc | 28 423 | 338,90 | 1 325 | 423,32 | ||||
| 2025-07-08 | 13F | Gallacher Capital Management LLC | 9 283 | -7,34 | 433 | 10,20 | ||||
| 2025-07-21 | 13F | Ameritas Advisory Services, LLC | 531 | 25 | ||||||
| 2025-07-18 | 13F | Deltec Asset Management Llc | 10 398 | 0,00 | 485 | 18,92 | ||||
| 2025-08-14 | 13F | D. E. Shaw & Co., Inc. | 0 | -100,00 | 0 | |||||
| 2025-08-27 | NP | THRIVENT SERIES FUND INC - Thrivent International Allocation Portfolio Class A | 5 226 | 116,94 | 244 | 158,51 | ||||
| 2025-07-16 | 13F | Highline Wealth Partners Llc | 158 | 20,61 | 7 | 40,00 | ||||
| 2025-08-06 | 13F | True Wealth Design, LLC | 49 | -41,67 | 2 | -33,33 | ||||
| 2025-08-14 | 13F | Riggs Asset Managment Co. Inc. | 93 | 4 | ||||||
| 2025-08-12 | 13F | Putnam Fl Investment Management Co | 7 477 | 349 | ||||||
| 2025-08-07 | 13F | Vise Technologies, Inc. | 5 500 | 256 | ||||||
| 2025-07-11 | 13F | Farther Finance Advisors, LLC | 522 | -11,97 | 24 | 4,35 | ||||
| 2025-08-12 | 13F | CIBC Private Wealth Group, LLC | 352 | 5,39 | 16 | 33,33 | ||||
| 2025-08-14 | 13F | Citadel Advisors Llc | Put | 0 | -100,00 | 0 | ||||
| 2025-08-14 | 13F | DZ BANK AG Deutsche Zentral Genossenschafts Bank, Frankfurt am Main | 145 000 | 0,00 | 6 758 | 18,87 | ||||
| 2025-05-15 | 13F | CAPROCK Group, Inc. | 11 305 | -1,96 | 443 | 2,07 | ||||
| 2025-08-12 | 13F | Legal & General Group Plc | 1 240 | 0,00 | 58 | 18,75 | ||||
| 2025-08-05 | 13F | Westside Investment Management, Inc. | 719 | 34 | ||||||
| 2025-07-14 | 13F | UMA Financial Services, Inc. | 568 | 11,59 | 26 | 36,84 | ||||
| 2025-07-29 | NP | SGLIX - SGI Global Equity Fund Class I Shares | 5 391 | -62,95 | 234 | -57,76 | ||||
| 2025-07-16 | 13F | Augustine Asset Management Inc | 17 696 | 0,00 | 825 | 18,90 | ||||
| 2025-08-14 | 13F | Wellington Management Group Llp | 39 488 | 1 841 | ||||||
| 2025-07-28 | NP | AVEM - Avantis Emerging Markets Equity ETF This fund is a listed as child fund of American Century Companies Inc and if that institution has disclosed ownership in this security, then these positions will not be double counted when calculating total shares and total value | 290 559 | 21,06 | 12 634 | 35,39 | ||||
| 2025-08-14 | 13F | Sei Investments Co | 61 030 | 13,30 | 2 844 | 34,66 | ||||
| 2025-08-29 | NP | John Hancock Hedged Equity & Income Fund | 15 087 | 703 | ||||||
| 2025-06-27 | NP | SPWO - SP Funds S&P World (ex-US) ETF | 3 573 | 41,73 | 144 | 48,45 | ||||
| 2025-08-14 | 13F | State Street Corp | 74 522 | 1,08 | 3 473 | 20,17 | ||||
| 2025-08-07 | 13F | Acadian Asset Management Llc | 572 484 | 22,96 | 27 | 44,44 | ||||
| 2025-08-01 | 13F | GoalVest Advisory LLC | 4 | 0,00 | 0 | |||||
| 2025-08-13 | 13F | Cerity Partners LLC | 71 794 | -9,54 | 3 346 | 7,55 | ||||
| 2025-08-11 | 13F | Citigroup Inc | 13 940 | 5,30 | 650 | 25,05 | ||||
| 2025-07-28 | 13F | Td Asset Management Inc | 653 104 | -20,05 | 30 441 | -4,96 | ||||
| 2025-08-14 | 13F | Mariner, LLC | 28 899 | 8,15 | 1 347 | 28,65 | ||||
| 2025-05-09 | 13F | Allianz Se | 0 | -100,00 | 0 | -100,00 | ||||
| 2025-07-24 | 13F | Ronald Blue Trust, Inc. | 20 557 | 5,68 | 958 | 25,72 | ||||
| 2025-08-08 | 13F | Larson Financial Group LLC | 2 040 | 304,76 | 95 | 400,00 | ||||
| 2025-08-14 | 13F | Bnp Paribas Arbitrage, Sa | 13 161 | 548,96 | 613 | 675,95 | ||||
| 2025-07-28 | NP | NSI - National Security Emerging Markets Index ETF | 6 051 | 38,44 | 263 | 55,62 | ||||
| 2025-09-04 | 13F/A | Advisor Group Holdings, Inc. | 4 195 | 664,12 | 195 | 828,57 | ||||
| 2025-07-24 | 13F | PDS Planning, Inc | 16 095 | -10,36 | 750 | 6,53 | ||||
| 2025-08-25 | 13F/A | Neuberger Berman Group LLC | 79 238 | 21,10 | 3 702 | 44,63 | ||||
| 2025-08-12 | 13F | Advisors Asset Management, Inc. | 3 711 | 57,71 | 173 | 86,96 | ||||
| 2025-07-17 | 13F | V-Square Quantitative Management LLC | 4 065 | 0,00 | 189 | 18,87 | ||||
| 2025-08-13 | 13F | Northern Trust Corp | 706 378 | 4,62 | 32 924 | 24,37 | ||||
| 2025-08-28 | NP | CWI - SPDR(R) MSCI ACWI EX-US ETF | 47 194 | 0,35 | 2 200 | 19,25 | ||||
| 2025-08-05 | 13F | NewSquare Capital LLC | 829 | 17,26 | 39 | 40,74 | ||||
| 2025-08-14 | 13F | Principal Street Partners, LLC | 6 174 | 288 | ||||||
| 2025-08-07 | 13F | Campbell & CO Investment Adviser LLC | 26 908 | 1 254 | ||||||
| 2025-08-13 | 13F | EverSource Wealth Advisors, LLC | 9 141 | 127,56 | 426 | 171,34 | ||||
| 2025-08-07 | 13F | Allworth Financial LP | 2 370 | 125,93 | 110 | 168,29 | ||||
| 2025-07-08 | 13F | Northwest & Ethical Investments L.P. | 0 | -100,00 | 0 | |||||
| 2025-08-14 | 13F | Quantinno Capital Management LP | 129 440 | 142,61 | 6 033 | 188,52 | ||||
| 2025-07-21 | 13F | Ascent Group, LLC | 24 568 | 56,30 | 1 145 | 85,88 | ||||
| 2025-08-14 | 13F | Wells Fargo & Company/mn | 2 924 | -24,15 | 136 | -9,93 | ||||
| 2025-08-27 | NP | THRIVENT SERIES FUND INC - Thrivent Partner Emerging Markets Equity Portfolio Class A | 2 214 | 107,11 | 103 | 151,22 | ||||
| 2025-08-15 | 13F | Tower Research Capital LLC (TRC) | 48 | -52,00 | 2 | -33,33 | ||||
| 2025-08-28 | NP | SPGM - SPDR(R) Portfolio MSCI Global Stock Market ETF | 21 889 | 2,96 | 1 020 | 22,45 | ||||
| 2025-08-12 | 13F | Summit Global Investments | 12 999 | 1 | ||||||
| 2025-08-14 | 13F | Citadel Advisors Llc | 31 941 | 31,98 | 1 489 | 56,96 | ||||
| 2025-06-30 | NP | VGTSX - Vanguard Total International Stock Index Fund Investor Shares | 277 613 | 0,00 | 11 227 | 4,12 | ||||
| 2025-08-12 | 13F | Coldstream Capital Management Inc | 0 | -100,00 | 0 | |||||
| 2025-07-15 | 13F | Public Employees Retirement System Of Ohio | 143 425 | 7,00 | 6 685 | 27,21 | ||||
| 2025-05-15 | 13F/A | Orion Portfolio Solutions, LLC | 46 087 | -11,31 | 1 807 | -7,62 | ||||
| 2025-07-23 | 13F | Venturi Wealth Management, LLC | 5 201 | 242 | ||||||
| 2025-08-12 | 13F | O'shaughnessy Asset Management, Llc | 107 480 | 10,28 | 5 010 | 31,09 | ||||
| 2025-08-13 | 13F | Quadrant Capital Group Llc | 48 845 | -15,70 | 2 277 | 0,22 | ||||
| 2025-07-25 | 13F | Allspring Global Investments Holdings, LLC | 0 | -100,00 | 0 | |||||
| 2025-07-29 | 13F | Wealthstream Advisors, Inc. | 5 073 | 236 | ||||||
| 2025-08-14 | 13F | Two Sigma Advisers, Lp | 0 | -100,00 | 0 | |||||
| 2025-05-15 | 13F | WPG Advisers, LLC | 0 | -100,00 | 0 | |||||
| 2025-08-14 | 13F | UBS Group AG | 46 894 | 11,63 | 2 186 | 32,67 | ||||
| 2025-06-30 | NP | VMNVX - Vanguard Global Minimum Volatility Fund Admiral Shares | 114 346 | 0,00 | 4 624 | 4,12 | ||||
| 2025-07-24 | 13F | Us Bancorp \de\ | 40 869 | 5,85 | 1 905 | 25,84 | ||||
| 2025-07-18 | 13F | BSW Wealth Partners | 4 777 | -7,67 | 223 | 9,90 | ||||
| 2025-08-13 | 13F | Hsbc Holdings Plc | 6 238 | 291 | ||||||
| 2025-08-15 | 13F | CI Private Wealth, LLC | 30 459 | -0,87 | 1 420 | 17,86 | ||||
| 2025-08-12 | 13F | Deutsche Bank Ag\ | 29 521 | 0,00 | 1 376 | 18,84 | ||||
| 2025-05-05 | 13F | Lindbrook Capital, Llc | 5 585 | 6,24 | 219 | 10,66 | ||||
| 2025-08-13 | 13F | Jones Financial Companies Lllp | 431 | 331,00 | 20 | 566,67 | ||||
| 2025-08-14 | 13F/A | Barclays Plc | 818 | 0 | ||||||
| 2025-08-13 | 13F | Natixis Advisors, L.p. | 39 098 | -10,50 | 2 | 0,00 | ||||
| 2025-08-13 | 13F | Bare Financial Services, Inc | 215 | 10 | ||||||
| 2025-07-18 | 13F | Generali Investments CEE, investicni spolecnost, a.s. | 16 929 | 0,00 | 789 | 19,00 | ||||
| 2025-08-14 | 13F | Mercer Global Advisors Inc /adv | 7 430 | -1,72 | 346 | 16,89 | ||||
| 2025-07-14 | 13F | AdvisorNet Financial, Inc | 142 | 0,00 | 7 | 20,00 | ||||
| 2025-08-13 | 13F | Invesco Ltd. | 10 318 | -1,00 | 481 | 17,65 | ||||
| 2025-08-11 | 13F | HighTower Advisors, LLC | 4 425 | 206 | ||||||
| 2025-06-30 | NP | AIM INTERNATIONAL MUTUAL FUNDS (INVESCO INTERNATIONAL MUTUAL FUNDS) - Invesco Oppenheimer Global Multi-Asset Growth Fund Class R6 | 6 350 | 109,09 | 257 | 118,80 | ||||
| 2025-08-13 | 13F | Marshall Wace, Llp | 43 434 | 14,20 | 2 024 | 35,75 | ||||
| 2025-08-14 | 13F | Fmr Llc | 47 835 | 43,29 | 2 230 | 70,41 | ||||
| 2025-08-14 | 13F | Wetherby Asset Management Inc | 31 651 | -4,26 | 1 475 | 18,57 | ||||
| 2025-07-28 | NP | AVSE - Avantis Responsible Emerging Markets Equity ETF | 1 559 | 13,13 | 68 | 26,42 | ||||
| 2025-06-26 | NP | HFIGX - Hartford Schroders Diversified Growth Fund Class I | 3 827 | 17,68 | 155 | 22,22 | ||||
| 2025-07-30 | 13F | Ethic Inc. | 53 719 | -18,24 | 2 518 | -2,59 | ||||
| 2025-04-21 | 13F | Catalina Capital Group, LLC | 0 | -100,00 | 0 | |||||
| 2025-08-08 | 13F | SBI Securities Co., Ltd. | 312 | -0,32 | 15 | 16,67 | ||||
| 2025-07-30 | 13F | Cullen/frost Bankers, Inc. | 0 | -100,00 | 0 | |||||
| 2025-08-12 | 13F | BlackRock, Inc. | 2 679 481 | 7,03 | 124 891 | 27,23 | ||||
| 2025-05-05 | 13F | Transce3nd, LLC | 0 | -100,00 | 0 | |||||
| 2025-08-12 | 13F | Atlas Capital Advisors Llc | 199 | 0,00 | 9 | 28,57 | ||||
| 2025-07-28 | 13F | Rosenberg Matthew Hamilton | 397 | 0,00 | 19 | 20,00 | ||||
| 2025-08-12 | 13F | MAI Capital Management | 3 899 | 16 145,83 | 182 | |||||
| 2025-08-14 | 13F | Ameriprise Financial Inc | 217 162 | -18,68 | 8 441 | -3,04 | ||||
| 2025-08-13 | 13F | Twin Peaks Wealth Advisors, LLC | 269 | 12 | ||||||
| 2025-04-22 | 13F | Mizuho Securities Co. Ltd. | 0 | -100,00 | 0 | -100,00 | ||||
| 2025-07-28 | 13F | Morningstar Investment Management LLC | 68 000 | 0 | ||||||
| 2025-08-15 | 13F | Morgan Stanley | 1 300 893 | 6,70 | 60 635 | 26,84 | ||||
| 2025-04-23 | 13F | Continuum Advisory, LLC | 0 | -100,00 | 0 | -100,00 | ||||
| 2025-07-08 | 13F | Parallel Advisors, LLC | 23 624 | 2,80 | 1 101 | 22,20 | ||||
| 2025-08-14 | 13F | Aqr Capital Management Llc | 23 675 | 211,06 | 1 103 | 270,13 | ||||
| 2025-08-13 | 13F | Renaissance Technologies Llc | 2 894 055 | -5,52 | 134 892 | 12,31 | ||||
| 2025-08-27 | NP | RYWTX - Emerging Markets 2x Strategy Fund Class A | 2 021 | 143,79 | 94 | 193,75 | ||||
| 2025-08-15 | 13F | Binnacle Investments Inc | 302 | 0,00 | 14 | 27,27 | ||||
| 2025-08-13 | 13F | Arrowstreet Capital, Limited Partnership | 297 704 | 411,11 | 13 876 | 507,75 | ||||
| 2025-07-22 | 13F | Simplicity Wealth,LLC | 9 294 | 433 | ||||||
| 2025-06-26 | NP | DFCEX - Emerging Markets Core Equity Portfolio - Institutional Class This fund is a listed as child fund of Dimensional Fund Advisors Lp and if that institution has disclosed ownership in this security, then these positions will not be double counted when calculating total shares and total value | 64 400 | 0,00 | 2 604 | 4,12 | ||||
| 2025-08-05 | 13F | Bridgewater Advisors Inc. | 9 038 | 6,69 | 394 | 16,57 | ||||
| 2025-08-13 | 13F | Russell Investments Group, Ltd. | 32 | 1 | ||||||
| 2025-06-26 | NP | DFSE - Dimensional Emerging Markets Sustainability Core 1 ETF | 4 613 | 17,89 | 187 | 23,18 | ||||
| 2025-07-09 | 13F | Sivia Capital Partners, LLC | 7 752 | -16,94 | 361 | -1,10 | ||||
| 2025-08-11 | 13F | Principal Securities, Inc. | 0 | -100,00 | 0 | |||||
| 2025-08-05 | 13F | Bank Of Montreal /can/ | 35 830 | -0,87 | 1 670 | 17,85 | ||||
| 2025-07-28 | 13F | BRYN MAWR TRUST Co | 78 | 0,00 | 4 | 0,00 | ||||
| 2025-07-24 | 13F | Lester Murray Antman dba SimplyRich | 14 902 | 0,00 | 1 | |||||
| 2025-07-16 | 13F | Signaturefd, Llc | 35 457 | -1,99 | 1 653 | 16,50 | ||||
| 2025-08-04 | 13F | Assetmark, Inc | 63 | 3 | ||||||
| 2025-08-04 | 13F | Simon Quick Advisors, Llc | 7 740 | 361 | ||||||
| 2025-08-05 | 13F | Tsfg, Llc | 98 | 0,00 | 0 | |||||
| 2025-07-29 | 13F | Harbor Asset Planning, Inc. | 167 | 8 | ||||||
| 2025-08-14 | 13F | Axa S.a. | 13 024 | 0,00 | 607 | 19,02 | ||||
| 2025-04-22 | NP | APIE - ActivePassive International Equity ETF | 0 | -100,00 | 0 | -100,00 | ||||
| 2025-08-08 | 13F | Crossmark Global Holdings, Inc. | 63 974 | -29,12 | 2 982 | -15,77 |
Other Listings
| DE:CHWD | 37,40 € |