Statistiques de base
| Propriétaires institutionnels | 94 total, 94 long only, 0 short only, 0 long/short - change of -5,05% MRQ |
| Prix de l'action | 4,50 |
| Allocation moyenne du portefeuille | 0.2274 % - change of 4,58% MRQ |
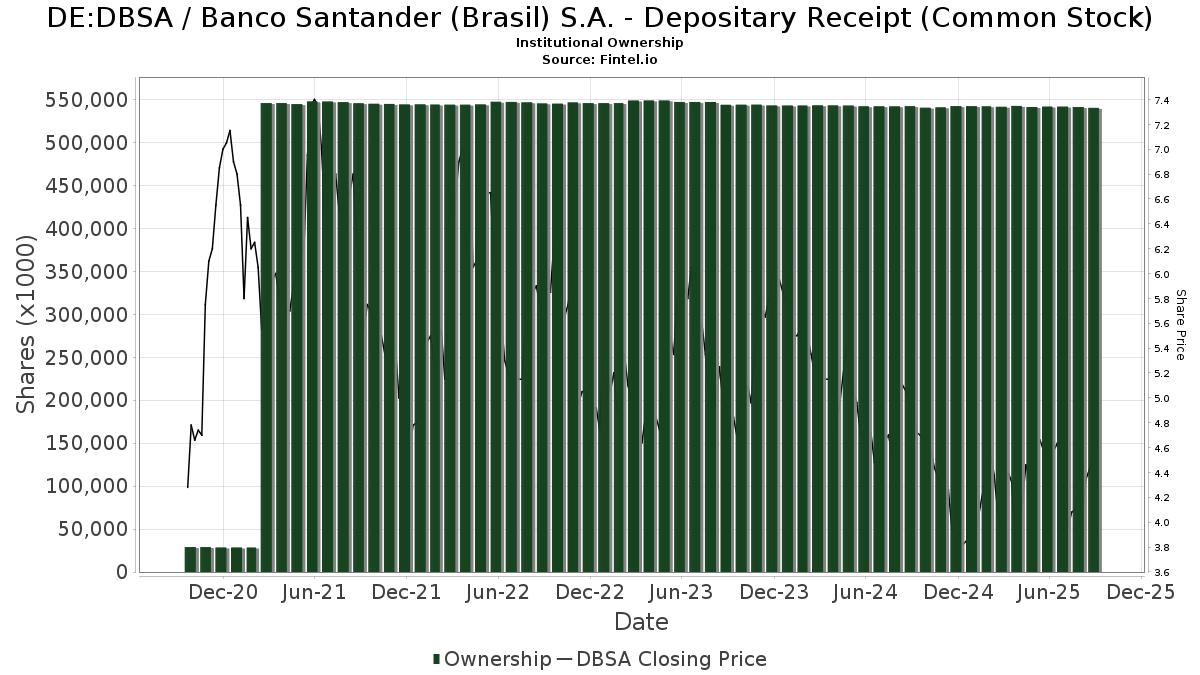
| Actions institutionnelles (Long) | 540 309 402 (ex 13D/G) - change of -1,44MM shares -0,27% MRQ |
| Valeur institutionnelle (Long) | $ 2 942 782 USD ($1000) |
Participation institutionnels et actionnaires
Banco Santander (Brasil) S.A. - Depositary Receipt (Common Stock) (DE:DBSA) détient 94 des propriétaires institutionnels et des actionnaires qui ont déposé des formulaires 13D/G ou 13F auprès de la Securities Exchange Commission (SEC). Ces institutions détiennent un total de 540,309,402 actions. Les principaux actionnaires incluent Banco Santander, S.A., Macquarie Group Ltd, Vanguard Group Inc, VEIEX - Vanguard Emerging Markets Stock Index Fund Investor Shares, DEMAX - Delaware Emerging Markets Fund Class A, Arrowstreet Capital, Limited Partnership, FRDM - Freedom 100 Emerging Markets ETF, BlackRock, Inc., Morgan Stanley, and Wellington Management Group Llp .
Banco Santander (Brasil) S.A. - Depositary Receipt (Common Stock) (DB:DBSA) la structure de l'actionnariat institutionnel indique les positions actuelles des institutions et des fonds dans l'entreprise, ainsi que les derniers changements dans le volume des positions. Les principaux actionnaires peuvent être des investisseurs individuels, des fonds communs de placement, des fonds spéculatifs ou des institutions. L'annexe 13D indique que l'investisseur détient (ou a détenu) plus de 5 % de l'entreprise et qu'il a l'intention (ou a eu l'intention) de poursuivre activement un changement de stratégie commerciale. L'annexe 13G indique un investissement passif de plus de 5 %.
The share price as of September 9, 2025 is 4,50 / share. Previously, on September 10, 2024, the share price was 5,10 / share. This represents a decline of 11,76% over that period.
Indice de confiance des fonds
L'indice de confiance des fonds (anciennement score d'accumulation de participation) trouve les actions qui sont les plus achetées par les fonds. Il est le résultat d'un modèle quantitatif sophistiqué à plusieurs facteurs qui identifie les entreprises avec les niveaux les plus élevés d'accumulation institutionnelle. Le modèle de notation utilise une combinaison de l'augmentation totale des propriétaires déclarés, des variations des allocations de portefeuille chez ces propriétaires et d'autres indicateurs. Le chiffre varie de 0 à 100, les chiffres plus élevés indiquant un niveau d'accumulation plus élevé par rapport aux autres entreprises, 50 étant la moyenne.
Fréquence de mise à jour : Quotidienne
Déclarations 13F et NPORT
Les détails des déclarations 13F sont gratuits. Les détails des déclarations NP nécessitent une adhésion premium. Les lignes vertes indiquent de nouvelles positions. Les lignes rouges indiquent des positions clôturées. Cliquez sur l'icône du lien pour voir l'historique complet des transactions.
Mettre à niveau
pour débloquer des données premium et les exporter vers Excel ![]() .
.
| Date de dépôt | Source | Investisseur | Type | Prix moyen (Est) |
Actions | Δ Actions (%) |
Valeur déclarée (1000 $) |
Δ Valeur (%) |
Allocation de portefeuille (%) |
|
|---|---|---|---|---|---|---|---|---|---|---|
| 2025-08-04 | 13F | Spire Wealth Management | 2 046 | 0,00 | 11 | 22,22 | ||||
| 2025-08-14 | 13F | Aqr Capital Management Llc | 16 121 | 88 | ||||||
| 2025-08-14 | 13F | Verition Fund Management LLC | 71 540 | 390 | ||||||
| 2025-07-07 | 13F | Northwest & Ethical Investments L.P. | 0 | -100,00 | 0 | -100,00 | ||||
| 2025-08-14 | 13F | Two Sigma Investments, Lp | 118 202 | -71,62 | 644 | -67,18 | ||||
| 2025-07-28 | NP | AVSE - Avantis Responsible Emerging Markets Equity ETF | 9 393 | 68,12 | 49 | 100,00 | ||||
| 2025-08-14 | 13F | Engineers Gate Manager LP | 18 910 | 40,91 | 103 | 63,49 | ||||
| 2025-08-13 | 13F | EverSource Wealth Advisors, LLC | 2 789 | 4 792,98 | 15 | |||||
| 2025-08-12 | 13F | MAI Capital Management | 927 | 5 | ||||||
| 2025-07-30 | NP | APIE - ActivePassive International Equity ETF | 13 823 | 72 | ||||||
| 2025-08-05 | 13F | Simplex Trading, Llc | Call | 100 | -90,00 | 0 | ||||
| 2025-06-26 | NP | DFAE - Dimensional Emerging Core Equity Market ETF | 7 200 | 0,00 | 38 | 15,63 | ||||
| 2025-08-05 | 13F | NewSquare Capital LLC | 134 | 0,00 | 1 | |||||
| 2025-07-14 | 13F | GAMMA Investing LLC | 20 256 | 27,52 | 110 | 48,65 | ||||
| 2025-05-14 | 13F | EntryPoint Capital, LLC | 0 | -100,00 | 0 | |||||
| 2025-07-24 | 13F | Us Bancorp \de\ | 2 602 | 0,00 | 14 | 16,67 | ||||
| 2025-07-21 | 13F | Mirae Asset Global Investments Co., Ltd. | 13 126 | 8,18 | 72 | 24,56 | ||||
| 2025-08-12 | 13F | SRS Capital Advisors, Inc. | 149 | 0,00 | 1 | |||||
| 2025-08-14 | 13F | Hrt Financial Lp | 0 | -100,00 | 0 | |||||
| 2025-08-12 | 13F | Dimensional Fund Advisors Lp | 112 963 | 56,13 | 616 | 80,88 | ||||
| 2025-08-13 | 13F | Invesco Ltd. | 206 851 | 9,71 | 1 127 | 26,91 | ||||
| 2025-05-15 | 13F | Qube Research & Technologies Ltd | 0 | -100,00 | 0 | |||||
| 2025-08-26 | NP | Delaware Vip Trust - Delaware Vip Emerging Markets Series Standard Class | 153 366 | 0,00 | 836 | 15,65 | ||||
| 2025-08-08 | 13F | SBI Securities Co., Ltd. | 1 587 | -71,07 | 9 | -68,00 | ||||
| 2025-05-14 | 13F | Banco BTG Pactual S.A. | 0 | -100,00 | 0 | -100,00 | ||||
| 2025-08-01 | 13F | Banco Santander, S.A. | 520 218 168 | 0,00 | 2 835 189 | 15,71 | ||||
| 2025-08-14 | 13F | Citadel Advisors Llc | Call | 0 | -100,00 | 0 | ||||
| 2025-05-14 | 13F | Itau Unibanco Holding S.A. | 0 | -100,00 | 0 | |||||
| 2025-05-15 | 13F | Jain Global LLC | 0 | -100,00 | 0 | |||||
| 2025-08-14 | 13F | Two Sigma Securities, Llc | 16 320 | 89 | ||||||
| 2025-06-26 | NP | DFSE - Dimensional Emerging Markets Sustainability Core 1 ETF | 12 532 | 0,00 | 66 | 16,07 | ||||
| 2025-08-01 | 13F | May Hill Capital, LLC | 0 | -100,00 | 0 | |||||
| 2025-08-11 | 13F | Vanguard Group Inc | 3 101 965 | 0,00 | 16 906 | 15,71 | ||||
| 2025-08-14 | 13F/A | Skopos Labs, Inc. | 7 958 | -47,42 | 43 | -39,44 | ||||
| 2025-07-30 | 13F | Drive Wealth Management, Llc | 14 270 | 8,92 | 78 | 26,23 | ||||
| 2025-06-25 | NP | IEMGX - Voya Multi-Manager Emerging Markets Equity Fund Class I | 51 776 | -11,46 | 272 | 3,42 | ||||
| 2025-08-15 | 13F | Morgan Stanley | 848 263 | 684,12 | 4 623 | 808,25 | ||||
| 2025-08-08 | 13F | Pnc Financial Services Group, Inc. | 229 | -67,88 | 1 | -66,67 | ||||
| 2025-07-31 | 13F | R Squared Ltd | 21 000 | -14,60 | 114 | -0,87 | ||||
| 2025-08-11 | 13F | Principal Securities, Inc. | 0 | -100,00 | 0 | |||||
| 2025-08-13 | 13F | Quadrant Capital Group Llc | 0 | -100,00 | 0 | |||||
| 2025-08-13 | 13F | Northern Trust Corp | 23 987 | 13,65 | 131 | 31,31 | ||||
| 2025-08-12 | 13F | Deutsche Bank Ag\ | 260 000 | 0,00 | 1 417 | 15,77 | ||||
| 2025-08-14 | 13F | VPR Management LLC | 157 930 | 0,00 | 861 | 15,75 | ||||
| 2025-05-13 | 13F | Russell Investments Group, Ltd. | 0 | -100,00 | 0 | |||||
| 2025-08-14 | 13F | Vident Advisory, LLC | 0 | -100,00 | 0 | |||||
| 2025-08-14 | 13F | Bnp Paribas Arbitrage, Sa | 57 974 | 3 302,23 | 316 | 3 837,50 | ||||
| 2025-08-14 | 13F | Millennium Management Llc | 11 781 | 64 | ||||||
| 2025-06-26 | NP | DFEM - Dimensional Emerging Markets Core Equity 2 ETF | 3 112 | 0,00 | 16 | 14,29 | ||||
| 2025-08-12 | 13F | Jpmorgan Chase & Co | 642 | -99,81 | 4 | -99,81 | ||||
| 2025-08-13 | 13F | Marshall Wace, Llp | 0 | -100,00 | 0 | |||||
| 2025-08-06 | 13F | Savant Capital, LLC | 22 507 | 123 | ||||||
| 2025-08-29 | NP | MPLAX - Praxis International Index Fund Class A | 65 143 | 0,00 | 355 | 16,01 | ||||
| 2025-07-25 | NP | DEMAX - Delaware Emerging Markets Fund Class A | 2 751 128 | 0,00 | 14 306 | 19,27 | ||||
| 2025-08-07 | 13F | Connor, Clark & Lunn Investment Management Ltd. | 12 759 | 70 | ||||||
| 2025-08-14 | 13F | Mariner, LLC | 118 671 | 43,58 | 647 | 66,07 | ||||
| 2025-08-14 | 13F/A | Barclays Plc | 45 798 | 0 | ||||||
| 2025-07-24 | 13F | Jfs Wealth Advisors, Llc | 521 | 25,85 | 3 | 100,00 | ||||
| 2025-08-13 | 13F | Townsquare Capital Llc | 0 | -100,00 | 0 | |||||
| 2025-06-25 | NP | VVIFX - Voya VACS Series EME Fund | 64 528 | 0,00 | 339 | 16,49 | ||||
| 2025-07-08 | 13F | Parallel Advisors, LLC | 0 | -100,00 | 0 | |||||
| 2025-08-06 | 13F | Prospera Financial Services Inc | 127 365 | -2,35 | 694 | 13,03 | ||||
| 2025-08-13 | 13F | Guggenheim Capital Llc | 14 835 | -1,39 | 81 | 14,29 | ||||
| 2025-08-13 | 13F/A | StoneX Group Inc. | 0 | -100,00 | 0 | -100,00 | ||||
| 2025-07-28 | NP | AVEM - Avantis Emerging Markets Equity ETF This fund is a listed as child fund of American Century Companies Inc and if that institution has disclosed ownership in this security, then these positions will not be double counted when calculating total shares and total value | 678 222 | 24,58 | 3 527 | 48,59 | ||||
| 2025-08-14 | 13F | Goldman Sachs Group Inc | 201 989 | -16,52 | 1 101 | -3,42 | ||||
| 2025-07-28 | NP | AVXC - Avantis Emerging Markets ex-China Equity ETF | 7 129 | 37,49 | 37 | 68,18 | ||||
| 2025-07-15 | 13F | Public Employees Retirement System Of Ohio | 11 617 | 48,86 | 63 | 75,00 | ||||
| 2025-08-13 | 13F | Jump Financial, LLC | 41 907 | -43,62 | 228 | -34,86 | ||||
| 2025-08-15 | 13F | Tower Research Capital LLC (TRC) | 453 | -91,73 | 2 | -92,00 | ||||
| 2025-08-14 | 13F | Schonfeld Strategic Advisors LLC | 0 | -100,00 | 0 | |||||
| 2025-08-11 | 13F | Bell Investment Advisors, Inc | 2 568 | 43,95 | 14 | 62,50 | ||||
| 2025-08-12 | 13F | Rhumbline Advisers | 15 917 | 819,00 | 87 | 975,00 | ||||
| 2025-08-13 | 13F | Arrowstreet Capital, Limited Partnership | 2 526 757 | 5,06 | 13 771 | 21,57 | ||||
| 2025-08-14 | 13F | Bank Of America Corp /de/ | 291 643 | 50,51 | 1 589 | 74,23 | ||||
| 2025-07-28 | NP | AVEEX - Avantis Emerging Markets Equity Fund Institutional Class This fund is a listed as child fund of American Century Companies Inc and if that institution has disclosed ownership in this security, then these positions will not be double counted when calculating total shares and total value | 28 959 | 0,00 | 151 | 19,05 | ||||
| 2025-08-14 | 13F | Group One Trading, L.p. | 0 | -100,00 | 0 | |||||
| 2025-08-12 | 13F | O'shaughnessy Asset Management, Llc | 23 200 | 126 | ||||||
| 2025-08-14 | 13F | Sei Investments Co | 24 222 | 0,00 | 132 | 15,79 | ||||
| 2025-08-14 | 13F | Group One Trading, L.p. | Call | 0 | -100,00 | 0 | ||||
| 2025-08-12 | 13F | BlackRock, Inc. | 910 754 | 10,96 | 4 964 | 28,41 | ||||
| 2025-05-05 | 13F | Lindbrook Capital, Llc | 2 963 | 370,32 | 14 | 550,00 | ||||
| 2025-08-14 | 13F | Cubist Systematic Strategies, LLC | 0 | -100,00 | 0 | |||||
| 2025-08-14 | 13F | State Street Corp | 12 700 | 0,00 | 69 | 16,95 | ||||
| 2025-08-13 | 13F | Provida Pension Fund Administrator | 0 | -100,00 | 0 | -100,00 | ||||
| 2025-08-13 | 13F | Northwestern Mutual Wealth Management Co | 960 | 5 | ||||||
| 2025-08-14 | 13F | Wells Fargo & Company/mn | 4 725 | -31,85 | 26 | -21,87 | ||||
| 2025-08-04 | 13F | Hantz Financial Services, Inc. | 6 997 | 553,93 | 0 | |||||
| 2025-04-25 | NP | VCGEX - Emerging Economies Fund | 104 334 | 3,53 | 455 | 8,35 | ||||
| 2025-06-26 | NP | DEXC - Dimensional Emerging Markets ex China Core Equity ETF | 26 100 | 44,20 | 137 | 69,14 | ||||
| 2025-08-12 | 13F | Longfellow Investment Management Co Llc | 0 | -100,00 | 0 | |||||
| 2025-08-12 | 13F | American Century Companies Inc | 744 630 | 21,22 | 4 058 | 40,27 | ||||
| 2025-08-14 | 13F | Alliancebernstein L.p. | 163 947 | 894 | ||||||
| 2025-05-07 | 13F | LPL Financial LLC | 0 | -100,00 | 0 | |||||
| 2025-08-14 | 13F | Point72 Asset Management, L.P. | 261 860 | 120,42 | 1 427 | 155,28 | ||||
| 2025-06-30 | NP | VEIEX - Vanguard Emerging Markets Stock Index Fund Investor Shares | 3 101 965 | 0,00 | 16 316 | 16,63 | ||||
| 2025-08-14 | 13F | UBS Group AG | 118 100 | 147,72 | 644 | 187,05 | ||||
| 2025-05-14 | 13F | Hsbc Holdings Plc | 0 | -100,00 | 0 | |||||
| 2025-08-14 | 13F | Macquarie Group Ltd | 3 561 512 | -0,49 | 19 410 | 15,14 | ||||
| 2025-05-06 | 13F | Advisors Preferred, LLC | 0 | -100,00 | 0 | |||||
| 2025-07-18 | 13F | Robeco Institutional Asset Management B.V. | 0 | -100,00 | 0 | |||||
| 2025-08-12 | 13F | SPX Equities Gestao de Recursos Ltda | 0 | -100,00 | 0 | |||||
| 2025-08-04 | 13F | Assetmark, Inc | 14 | 0 | ||||||
| 2025-05-15 | 13F | Citadel Advisors Llc | Put | 0 | -100,00 | 0 | -100,00 | |||
| 2025-08-13 | 13F | Cerity Partners LLC | 16 354 | -46,58 | 89 | -38,19 | ||||
| 2025-08-13 | 13F | Renaissance Technologies Llc | 0 | -100,00 | 0 | |||||
| 2025-07-22 | 13F | Checchi Capital Advisers, LLC | 14 796 | 0,00 | 81 | 15,94 | ||||
| 2025-04-30 | 13F | Allworth Financial LP | 0 | -100,00 | 0 | |||||
| 2025-06-26 | NP | DFEV - Dimensional Emerging Markets Value ETF | 600 | 0,00 | 3 | 50,00 | ||||
| 2025-08-11 | 13F | Cordatus Wealth Management LLC | 126 733 | -2,36 | 1 | |||||
| 2025-08-14 | 13F | Jane Street Group, Llc | 0 | -100,00 | 0 | |||||
| 2025-08-14 | 13F | Citadel Advisors Llc | 19 934 | -89,88 | 109 | -88,35 | ||||
| 2025-08-29 | NP | FRDM - Freedom 100 Emerging Markets ETF | 1 276 577 | 16,76 | 6 957 | 35,11 | ||||
| 2025-08-14 | 13F | Headlands Technologies LLC | 232 | -27,27 | 1 | 0,00 | ||||
| 2025-08-14 | 13F | Aquatic Capital Management LLC | 84 539 | 82,86 | 461 | 111,98 | ||||
| 2025-07-11 | 13F | Farther Finance Advisors, LLC | 325 | 0,93 | 2 | 0,00 | ||||
| 2025-07-14 | 13F | UMA Financial Services, Inc. | 252 | 0,00 | 1 | 0,00 | ||||
| 2025-07-16 | 13F | Signaturefd, Llc | 10 140 | 2,71 | 55 | 19,57 | ||||
| 2025-08-14 | 13F | Wellington Management Group Llp | 749 206 | -53,35 | 4 083 | -46,02 | ||||
| 2025-07-31 | 13F | Caitong International Asset Management Co., Ltd | 733 | -2,79 | 4 | 0,00 | ||||
| 2025-08-14 | 13F | Two Sigma Advisers, Lp | 39 600 | -85,56 | 216 | -83,35 | ||||
| 2025-08-07 | 13F | Vise Technologies, Inc. | 17 253 | 94 | ||||||
| 2025-08-14 | 13F | Susquehanna International Group, Llp | 0 | -100,00 | 0 | |||||
| 2025-08-08 | 13F | Larson Financial Group LLC | 506 | 3 | ||||||
| 2025-05-21 | 13F | Acadian Asset Management Llc | 0 | -100,00 | 0 | -100,00 | ||||
| 2025-05-29 | 13F/A | Legal & General Group Plc | 76 800 | 0,00 | 380 | -13,47 | ||||
| 2025-08-12 | 13F | Proequities, Inc. | Put | 0 | 0 | |||||
| 2025-08-12 | 13F | Proequities, Inc. | Call | 0 | 0 | |||||
| 2025-08-12 | 13F | Proequities, Inc. | 0 | 0 | ||||||
| 2025-07-28 | NP | NSI - National Security Emerging Markets Index ETF | 3 017 | 38,59 | 16 | 66,67 | ||||
| 2025-09-04 | 13F/A | Advisor Group Holdings, Inc. | 1 660 | 9 | ||||||
| 2025-08-12 | 13F | XTX Topco Ltd | 0 | -100,00 | 0 |