Statistiques de base
| Propriétaires institutionnels | 154 total, 150 long only, 0 short only, 4 long/short - change of % MRQ |
| Allocation moyenne du portefeuille | 0.3997 % - change of % MRQ |
| Actions institutionnelles (Long) | 54 166 064 (ex 13D/G) |
| Valeur institutionnelle (Long) | $ 152 405 USD ($1000) |
Participation institutionnels et actionnaires
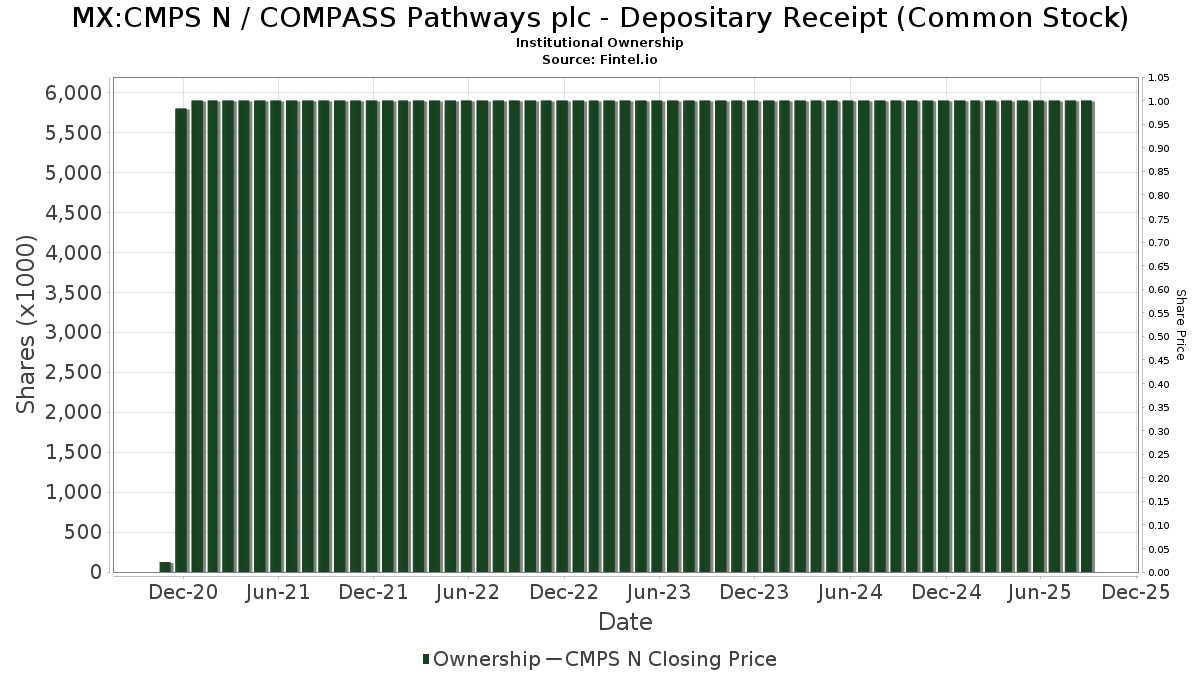
COMPASS Pathways plc - Depositary Receipt (Common Stock) (MX:CMPS N) détient 154 des propriétaires institutionnels et des actionnaires qui ont déposé des formulaires 13D/G ou 13F auprès de la Securities Exchange Commission (SEC). Ces institutions détiennent un total de 54,166,064 actions. Les principaux actionnaires incluent Deep Track Capital, LP, Rtw Investments, Lp, Nantahala Capital Management, LLC, Vivo Capital, LLC, Gmt Capital Corp, PFM Health Sciences, LP, Woodline Partners LP, Millennium Management Llc, UBS Group AG, and ARKG - ARK Genomic Revolution ETF .
COMPASS Pathways plc - Depositary Receipt (Common Stock) (BMV:CMPS N) la structure de l'actionnariat institutionnel indique les positions actuelles des institutions et des fonds dans l'entreprise, ainsi que les derniers changements dans le volume des positions. Les principaux actionnaires peuvent être des investisseurs individuels, des fonds communs de placement, des fonds spéculatifs ou des institutions. L'annexe 13D indique que l'investisseur détient (ou a détenu) plus de 5 % de l'entreprise et qu'il a l'intention (ou a eu l'intention) de poursuivre activement un changement de stratégie commerciale. L'annexe 13G indique un investissement passif de plus de 5 %.
Indice de confiance des fonds
L'indice de confiance des fonds (anciennement score d'accumulation de participation) trouve les actions qui sont les plus achetées par les fonds. Il est le résultat d'un modèle quantitatif sophistiqué à plusieurs facteurs qui identifie les entreprises avec les niveaux les plus élevés d'accumulation institutionnelle. Le modèle de notation utilise une combinaison de l'augmentation totale des propriétaires déclarés, des variations des allocations de portefeuille chez ces propriétaires et d'autres indicateurs. Le chiffre varie de 0 à 100, les chiffres plus élevés indiquant un niveau d'accumulation plus élevé par rapport aux autres entreprises, 50 étant la moyenne.
Fréquence de mise à jour : Quotidienne
Déclarations 13F et NPORT
Les détails des déclarations 13F sont gratuits. Les détails des déclarations NP nécessitent une adhésion premium. Les lignes vertes indiquent de nouvelles positions. Les lignes rouges indiquent des positions clôturées. Cliquez sur l'icône du lien pour voir l'historique complet des transactions.
Mettre à niveau
pour débloquer des données premium et les exporter vers Excel ![]() .
.
| Date de dépôt | Source | Investisseur | Type | Prix moyen (Est) |
Actions | Δ Actions (%) |
Valeur déclarée (1000 $) |
Δ Valeur (%) |
Allocation de portefeuille (%) |
|
|---|---|---|---|---|---|---|---|---|---|---|
| 2025-08-14 | 13F | Toronto Dominion Bank | 500 000 | 1 400 | ||||||
| 2025-08-28 | NP | IBB - iShares Nasdaq Biotechnology ETF | 332 413 | -17,85 | 931 | -19,62 | ||||
| 2025-08-14 | 13F | Schonfeld Strategic Advisors LLC | 186 881 | 523 | ||||||
| 2025-07-25 | 13F | Cwm, Llc | 13 125 | 20,91 | 0 | |||||
| 2025-08-15 | 13F | Tower Research Capital LLC (TRC) | 0 | -100,00 | 0 | -100,00 | ||||
| 2025-04-07 | 13F | AdvisorNet Financial, Inc | 0 | -100,00 | 0 | |||||
| 2025-08-13 | 13F/A | DLD Asset Management, LP | Call | 231 600 | 648 | |||||
| 2025-08-28 | NP | GWX - SPDR(R) S&P(R) International Small Cap ETF | 24 111 | -1,57 | 68 | -4,29 | ||||
| 2025-08-13 | 13F/A | DLD Asset Management, LP | 10 500 | 29 | ||||||
| 2025-08-14 | 13F | Rosalind Advisors, Inc. | 482 651 | -41,38 | 1 351 | -42,61 | ||||
| 2025-08-14 | 13F | Gmt Capital Corp | 1 781 718 | 0,00 | 4 989 | -2,10 | ||||
| 2025-08-13 | 13F | Kennedy Capital Management, Inc. | 0 | -100,00 | 0 | |||||
| 2025-07-29 | 13F | Stableford Capital Ii Llc | 163 941 | 710 | ||||||
| 2025-08-14 | 13F/A | Barclays Plc | 417 644 | -0,76 | 1 | 0,00 | ||||
| 2025-08-14 | 13F | 22nw, Lp | 882 844 | 36,55 | 2 472 | 33,64 | ||||
| 2025-08-11 | 13F | Rothschild Investment Llc | 304 | 1,33 | 1 | |||||
| 2025-08-12 | 13F | BlackRock, Inc. | 377 060 | -8,46 | 1 056 | -10,44 | ||||
| 2025-08-14 | 13F | Jane Street Group, Llc | Call | 17 200 | 59,26 | 48 | 60,00 | |||
| 2025-07-08 | 13F | Parallel Advisors, LLC | 85 | -36,57 | 0 | |||||
| 2025-08-08 | 13F | SBI Securities Co., Ltd. | 658 | 532,69 | 2 | |||||
| 2025-08-14 | 13F | Nantahala Capital Management, LLC | 4 179 930 | 47,74 | 11 704 | 44,64 | ||||
| 2025-08-14 | 13F | Jane Street Group, Llc | 157 677 | 441 | ||||||
| 2025-08-14 | 13F | Tang Capital Management Llc | 1 300 000 | -7,14 | 3 640 | -9,09 | ||||
| 2025-05-15 | 13F | Two Sigma Securities, Llc | 0 | -100,00 | 0 | -100,00 | ||||
| 2025-07-11 | 13F | Adirondack Trust Co | 505 | 0,00 | 1 | 0,00 | ||||
| 2025-05-15 | 13F | Ikarian Capital, LLC | 0 | -100,00 | 0 | -100,00 | ||||
| 2025-07-30 | 13F | LGT Financial Advisors LLC | 14 700 | 0,00 | 41 | -2,38 | ||||
| 2025-07-24 | NP | FNCMX - Fidelity Nasdaq Composite Index Fund This fund is a listed as child fund of Fmr Llc and if that institution has disclosed ownership in this security, then these positions will not be double counted when calculating total shares and total value | 42 169 | 0,00 | 175 | 6,06 | ||||
| 2025-07-14 | 13F | GAMMA Investing LLC | 5 739 | -44,55 | 16 | -44,83 | ||||
| 2025-08-14 | 13F | Boston Private Wealth Llc | 0 | -100,00 | 0 | |||||
| 2025-08-14 | 13F | Group One Trading, L.p. | 117 683 | 143,71 | 330 | 138,41 | ||||
| 2025-08-13 | 13F | Walleye Trading LLC | Call | 284 000 | 13,28 | 795 | 10,88 | |||
| 2025-08-14 | 13F | Deep Track Capital, LP | 8 831 007 | -0,32 | 24 727 | -2,42 | ||||
| 2025-08-14 | 13F | UBS Group AG | 1 678 608 | 60,00 | 4 700 | 56,67 | ||||
| 2025-07-14 | 13F | Pacifica Partners Inc. | 420 | 0,00 | 1 | 0,00 | ||||
| 2025-04-21 | 13F | Nelson, Van Denburg & Campbell Wealth Management Group, LLC | 0 | -100,00 | 0 | |||||
| 2025-05-29 | 13F/A | Legal & General Group Plc | 33 952 | 204 | ||||||
| 2025-06-25 | NP | ARKG - ARK Genomic Revolution ETF | 1 658 908 | -1,59 | 6 602 | -9,13 | ||||
| 2025-07-16 | 13F | Signaturefd, Llc | 1 | 0,00 | 0 | |||||
| 2025-09-02 | 13F | Investors Towarzystwo Funduszy Inwestycyjnych Spolka Akcyjna | 0 | -100,00 | 0 | -100,00 | ||||
| 2025-08-13 | 13F | Hsbc Holdings Plc | 1 075 485 | 3 011 | ||||||
| 2025-08-04 | 13F | Flagship Harbor Advisors, Llc | 28 171 | 95,01 | 79 | 90,24 | ||||
| 2025-08-07 | 13F | Hennion & Walsh Asset Management, Inc. | 160 767 | -4,42 | 450 | -6,44 | ||||
| 2025-08-18 | 13F/A | National Bank Of Canada /fi/ | 98 | 0 | ||||||
| 2025-08-13 | 13F | Walleye Capital LLC | Put | 5 100 | 14 | |||||
| 2025-08-06 | 13F | Ethos Financial Group, LLC | 12 308 | 0,00 | 34 | -2,86 | ||||
| 2025-08-13 | 13F | Colonial Trust Advisors | 2 000 | 0,00 | 6 | 0,00 | ||||
| 2025-08-08 | 13F | Brown University | 214 200 | 0,00 | 600 | -2,12 | ||||
| 2025-08-13 | 13F | Walleye Capital LLC | 851 | 2 | ||||||
| 2025-08-14 | 13F | Woodline Partners LP | 1 755 938 | 0,06 | 4 917 | -2,03 | ||||
| 2025-08-13 | 13F | Walleye Capital LLC | Call | 6 300 | 18 | |||||
| 2025-08-19 | 13F | Anchor Investment Management, LLC | 550 | 0,00 | 2 | 0,00 | ||||
| 2025-05-14 | 13F | Affinity Asset Advisors, LLC | 0 | -100,00 | 0 | |||||
| 2025-07-23 | 13F | Shell Asset Management Co | 0 | -100,00 | 0 | |||||
| 2025-08-08 | 13F | Larson Financial Group LLC | 112 | 0,00 | 0 | |||||
| 2025-08-14 | 13F | Boothbay Fund Management, Llc | 700 000 | 1 023,60 | 1 960 | 1 001,12 | ||||
| 2025-07-24 | 13F | Ronald Blue Trust, Inc. | 150 | -94,64 | 0 | -100,00 | ||||
| 2025-08-14 | 13F | Citadel Advisors Llc | 132 902 | -82,17 | 372 | -82,54 | ||||
| 2025-08-14 | 13F | Laurion Capital Management LP | 0 | -100,00 | 0 | |||||
| 2025-08-14 | 13F | Citadel Advisors Llc | Call | 12 100 | -36,65 | 34 | -38,89 | |||
| 2025-08-14 | 13F | Citadel Advisors Llc | Put | 227 600 | 11,68 | 637 | 9,45 | |||
| 2025-07-29 | 13F | TFC Financial Management | 52 | 0,00 | 0 | |||||
| 2025-08-05 | 13F | Key FInancial Inc | 2 500 | 7 | ||||||
| 2025-08-14 | 13F | Boothbay Fund Management, Llc | Call | 500 000 | 1 400 | |||||
| 2025-08-14 | 13F | Boothbay Fund Management, Llc | Put | 100 000 | 280 | |||||
| 2025-08-12 | 13F | SRS Capital Advisors, Inc. | 240 | 100,00 | 1 | |||||
| 2025-08-13 | 13F | Virtus Investment Advisers, Inc. | 20 804 | -44,11 | 58 | -45,28 | ||||
| 2025-08-27 | 13F/A | Squarepoint Ops LLC | 0 | -100,00 | 0 | -100,00 | ||||
| 2025-08-27 | 13F/A | Squarepoint Ops LLC | Put | 0 | -100,00 | 0 | -100,00 | |||
| 2025-08-13 | 13F | Schroder Investment Management Group | 544 721 | 1 525 | ||||||
| 2025-08-14 | 13F | Shay Capital LLC | 100 000 | -23,96 | 280 | -25,53 | ||||
| 2025-08-08 | 13F | Pnc Financial Services Group, Inc. | 200 | 0,00 | 1 | |||||
| 2025-08-04 | 13F | AdvisorShares Investments LLC | 173 541 | 23,48 | 486 | 23,72 | ||||
| 2025-08-14 | 13F | Driehaus Capital Management Llc | 236 686 | -66,27 | 663 | -67,02 | ||||
| 2025-08-12 | 13F | Proequities, Inc. | 0 | 0 | ||||||
| 2025-08-12 | 13F | XTX Topco Ltd | 78 560 | 220 | ||||||
| 2025-07-30 | 13F | ARK Investment Management LLC | 1 649 221 | -8,62 | 4 618 | -10,54 | ||||
| 2025-08-11 | 13F | Blue Owl Capital Holdings LP | 229 914 | -79,76 | 644 | -80,20 | ||||
| 2025-08-12 | 13F | Pathstone Holdings, LLC | 11 425 | -17,14 | 32 | -20,51 | ||||
| 2025-08-12 | 13F | Close Asset Management Ltd | 3 900 | 0,00 | 0 | |||||
| 2025-08-12 | 13F | Rhumbline Advisers | 3 728 | 276,57 | 10 | 400,00 | ||||
| 2025-07-15 | 13F | North Star Investment Management Corp. | 517 | -84,67 | 1 | -88,89 | ||||
| 2025-08-05 | 13F | GHP Investment Advisors, Inc. | 250 | 0,00 | 1 | |||||
| 2025-08-11 | 13F | Principal Securities, Inc. | 441 | 53,12 | 1 | 0,00 | ||||
| 2025-08-11 | 13F | Alps Advisors Inc | 50 433 | -23,85 | 141 | -25,40 | ||||
| 2025-08-01 | 13F | Davy Global Fund Management Ltd | 23 842 | 67,04 | 67 | 65,00 | ||||
| 2025-08-14 | 13F | Royal Bank Of Canada | 178 200 | 99,23 | 499 | 94,92 | ||||
| 2025-05-09 | 13F | Altium Capital Management LP | 0 | -100,00 | 0 | |||||
| 2025-08-25 | NP | PSIL - AdvisorShares Psychedelics ETF | 173 541 | 23,48 | 486 | 20,95 | ||||
| 2025-07-21 | 13F | Mirae Asset Global Investments Co., Ltd. | 3 514 | 74,57 | 10 | 80,00 | ||||
| 2025-05-14 | 13F | Northwestern Mutual Wealth Management Co | 0 | -100,00 | 0 | |||||
| 2025-08-14 | 13F | Two Sigma Advisers, Lp | 0 | -100,00 | 0 | |||||
| 2025-08-14 | 13F | Bnp Paribas Arbitrage, Sa | 1 445 | 54,88 | 4 | 100,00 | ||||
| 2025-08-11 | 13F | EntryPoint Capital, LLC | 35 936 | -69,46 | 101 | -70,24 | ||||
| 2025-08-08 | 13F | New England Capital Financial Advisors LLC | 404 | 34,67 | 1 | |||||
| 2025-07-15 | 13F | Missouri Trust & Investment Co | 30 | 0,00 | 0 | |||||
| 2025-07-23 | 13F | Prime Capital Investment Advisors, LLC | 0 | -100,00 | 0 | |||||
| 2025-05-15 | 13F | Marshall Wace, Llp | 0 | -100,00 | 0 | |||||
| 2025-07-31 | 13F | Conservest Capital Advisors, Inc. | 20 363 | 32,55 | 57 | 32,56 | ||||
| 2025-07-31 | 13F | Sumitomo Mitsui Trust Holdings, Inc. | 219 651 | -4,55 | 615 | -6,53 | ||||
| 2025-08-14 | 13F | Rtw Investments, Lp | 8 221 929 | 48,46 | 23 021 | 45,34 | ||||
| 2025-06-26 | NP | OWSMX - Old Westbury Small & Mid Cap Strategies Fund | 0 | -100,00 | 0 | -100,00 | ||||
| 2025-08-08 | 13F | BIT Capital GmbH | 0 | -100,00 | 0 | |||||
| 2025-08-15 | 13F | Morgan Stanley | 265 833 | -59,20 | 744 | -60,06 | ||||
| 2025-08-13 | 13F | EverSource Wealth Advisors, LLC | 2 780 | -23,39 | 8 | -30,00 | ||||
| 2025-08-14 | 13F | GWM Advisors LLC | 550 | 0,00 | 2 | 0,00 | ||||
| 2025-08-11 | 13F | TD Waterhouse Canada Inc. | 1 770 | 0,00 | 6 | 25,00 | ||||
| 2025-08-12 | 13F | Steward Partners Investment Advisory, Llc | 1 100 | 0,00 | 3 | 0,00 | ||||
| 2025-08-13 | 13F | Walleye Trading LLC | 0 | -100,00 | 0 | -100,00 | ||||
| 2025-05-15 | 13F | Cubist Systematic Strategies, LLC | 0 | -100,00 | 0 | |||||
| 2025-08-28 | 13F | China Universal Asset Management Co., Ltd. | 18 272 | 46,70 | 51 | 45,71 | ||||
| 2025-08-14 | 13F | Federation des caisses Desjardins du Quebec | 175 | -63,16 | 0 | -100,00 | ||||
| 2025-08-14 | 13F | Susquehanna Fundamental Investments, Llc | 71 877 | -1,84 | 201 | -3,83 | ||||
| 2025-05-08 | 13F | Essential Planning, LLC. | 0 | -100,00 | 0 | |||||
| 2025-07-31 | 13F | Caitong International Asset Management Co., Ltd | 0 | -100,00 | 0 | |||||
| 2025-08-14 | 13F | Polar Asset Management Partners Inc. | 58 006 | -74,76 | 162 | -75,34 | ||||
| 2025-08-14 | 13F | Balyasny Asset Management Llc | 854 840 | 37,99 | 2 394 | 35,12 | ||||
| 2025-08-14 | 13F | Ancora Advisors, LLC | 1 330 | 0,00 | 4 | 0,00 | ||||
| 2025-08-05 | 13F | Simplex Trading, Llc | 183 031 | 276,21 | 1 | |||||
| 2025-07-07 | 13F | Global Wealth Strategies & Associates | 12 | 0 | ||||||
| 2025-08-13 | 13F | Virtus ETF Advisers LLC | 10 223 | -75,48 | 29 | -76,47 | ||||
| 2025-07-28 | NP | BIB - ProShares Ultra Nasdaq Biotechnology | 2 284 | 3,77 | 10 | 12,50 | ||||
| 2025-05-13 | 13F | Simplify Asset Management Inc. | 0 | -100,00 | 0 | |||||
| 2025-05-15 | 13F | Integral Health Asset Management, LLC | 0 | -100,00 | 0 | |||||
| 2025-08-14 | 13F | Vivo Capital, LLC | 3 362 385 | 0,00 | 9 415 | -2,10 | ||||
| 2025-08-14 | 13F | Goldman Sachs Group Inc | 244 893 | 931,30 | 686 | 922,39 | ||||
| 2025-08-14 | 13F | Goldman Sachs Group Inc | Call | 141 800 | 397 | |||||
| 2025-08-14 | 13F | Bank Of America Corp /de/ | 18 481 | 1,23 | 52 | -1,92 | ||||
| 2025-05-02 | 13F | Wealthfront Advisers Llc | 0 | -100,00 | 0 | -100,00 | ||||
| 2025-08-11 | 13F | Anfield Capital Management, LLC | 35 | 0,00 | 0 | |||||
| 2025-08-14 | 13F | Peak6 Llc | 13 395 | -58,01 | 38 | -59,34 | ||||
| 2025-05-15 | 13F | CAPROCK Group, Inc. | 10 223 | 29 | ||||||
| 2025-08-14 | 13F | Vident Advisory, LLC | 11 279 | -65,99 | 32 | -67,02 | ||||
| 2025-07-28 | NP | IBBQ - Invesco Nasdaq Biotechnology ETF This fund is a listed as child fund of Invesco Ltd. and if that institution has disclosed ownership in this security, then these positions will not be double counted when calculating total shares and total value | 2 443 | 26,12 | 10 | 42,86 | ||||
| 2025-07-15 | 13F | Fifth Third Bancorp | 60 | 0,00 | 0 | |||||
| 2025-04-09 | 13F | Green Alpha Advisors, LLC | 0 | -100,00 | 0 | |||||
| 2025-08-14 | 13F | DAFNA Capital Management LLC | 811 046 | 14,06 | 2 271 | 11,66 | ||||
| 2025-08-12 | 13F | Gladstone Institutional Advisory LLC | 37 270 | 104 | ||||||
| 2025-06-10 | 13F/A | Militia Capital Partners, LP | 0 | -100,00 | 0 | -100,00 | ||||
| 2025-08-05 | 13F | Westside Investment Management, Inc. | 900 | 0,00 | 3 | 0,00 | ||||
| 2025-08-14 | 13F | LMR Partners LLP | Call | 62 400 | 175 | |||||
| 2025-08-05 | 13F | Intellectus Partners, LLC | 10 100 | 0,00 | 28 | 0,00 | ||||
| 2025-05-15 | 13F | Propel Bio Management, LLC | 0 | -100,00 | 0 | |||||
| 2025-07-30 | NP | SBIO - ALPS Medical Breakthroughs ETF | 64 499 | 21,43 | 268 | 28,85 | ||||
| 2025-08-11 | 13F | Bridger Management, Llc | 147 209 | 412 | ||||||
| 2025-08-14 | 13F | Susquehanna Portfolio Strategies, LLC | 399 963 | 1 120 | ||||||
| 2025-08-14 | 13F | Susquehanna International Group, Llp | 108 557 | 41,31 | 304 | 38,36 | ||||
| 2025-05-09 | 13F | R Squared Ltd | 0 | -100,00 | 0 | |||||
| 2025-08-11 | 13F | Nikko Asset Management Americas, Inc. | 216 511 | -5,92 | 606 | -7,48 | ||||
| 2025-08-14 | 13F | Susquehanna International Group, Llp | Call | 344 200 | 537,41 | 964 | 525,32 | |||
| 2025-06-26 | NP | Voya Prime Rate Trust | 61 188 | 0,00 | 244 | -7,60 | ||||
| 2025-08-14 | 13F | Susquehanna International Group, Llp | Put | 187 300 | 446,06 | 524 | 434,69 | |||
| 2025-09-04 | 13F/A | Advisor Group Holdings, Inc. | 7 624 | -54,82 | 21 | -56,25 | ||||
| 2025-08-12 | 13F | Jpmorgan Chase & Co | 6 440 | 50,40 | 18 | 50,00 | ||||
| 2025-08-14 | 13F | Banque Transatlantique SA | 0 | -100,00 | 0 | |||||
| 2025-08-14 | 13F | PFM Health Sciences, LP | 1 779 259 | 294,28 | 4 982 | 286,12 | ||||
| 2025-07-11 | 13F | Farther Finance Advisors, LLC | 1 000 | 3 233,33 | 3 | |||||
| 2025-05-15 | 13F | Glen Eagle Advisors, LLC | 0 | -100,00 | 0 | |||||
| 2025-08-14 | 13F | Bayesian Capital Management, LP | 0 | -100,00 | 0 | |||||
| 2025-07-30 | 13F | Crewe Advisors LLC | 1 945 | 0,00 | 5 | 0,00 | ||||
| 2025-08-06 | 13F | Nvwm, Llc | 202 | 0,00 | 1 | |||||
| 2025-08-08 | 13F | Geode Capital Management, Llc | 27 622 | -34,50 | 77 | -35,83 | ||||
| 2025-08-26 | NP | AZBAX - AllianzGI Small-Cap Fund Class A | 0 | -100,00 | 0 | -100,00 | ||||
| 2025-08-14 | 13F | Oasis Management Co Ltd. | 107 911 | 0,00 | 302 | -1,95 | ||||
| 2025-07-18 | 13F | TruNorth Capital Management, LLC | 60 | 0,00 | 0 | |||||
| 2025-08-14 | 13F | Graham Capital Management, L.P. | 19 213 | 54 | ||||||
| 2025-07-14 | 13F | Painted Porch Advisors LLC | 0 | -100,00 | 0 | |||||
| 2025-08-14 | 13F | Ally Bridge Group (NY) LLC | 1 485 000 | 4 158 | ||||||
| 2025-08-14 | 13F | Saba Capital Management, L.P. | 151 033 | 0,00 | 423 | -2,09 | ||||
| 2025-08-14 | 13F | State Street Corp | 24 111 | -1,57 | 68 | -4,29 | ||||
| 2025-08-07 | 13F | Acadian Asset Management Llc | 0 | -100,00 | 0 | |||||
| 2025-07-16 | 13F | Crowley Wealth Management, Inc. | 30 | 0,00 | 0 | |||||
| 2025-08-14 | 13F | Hrt Financial Lp | 18 096 | 0 | ||||||
| 2025-08-07 | 13F | CENTRAL TRUST Co | 100 | 0,00 | 0 | |||||
| 2025-08-14 | 13F | Strategic Wealth Designers | 20 | 0 | ||||||
| 2025-08-14 | 13F | Founders Fund VII Management, LLC | 278 880 | 0,00 | 781 | -2,13 | ||||
| 2025-08-13 | 13F | Renaissance Technologies Llc | 212 800 | 80,05 | 596 | 76,04 | ||||
| 2025-08-12 | 13F | Dynamic Technology Lab Private Ltd | 0 | -100,00 | 0 | |||||
| 2025-08-14 | 13F | Prelude Capital Management, Llc | 66 975 | 188 | ||||||
| 2025-08-11 | 13F | Citigroup Inc | 10 180 | 1 023,62 | 29 | 1 300,00 | ||||
| 2025-08-08 | 13F | Good Life Advisors, LLC | 145 000 | -19,44 | 406 | -21,01 | ||||
| 2025-08-14 | 13F | Raymond James Financial Inc | 7 535 | 21 | ||||||
| 2025-07-29 | 13F | Tradewinds Capital Management, LLC | 14 | 0,00 | 0 | |||||
| 2025-08-14 | 13F | Point72 Asset Management, L.P. | 0 | -100,00 | 0 | |||||
| 2025-08-12 | 13F | CIBC Private Wealth Group, LLC | 23 | 0,00 | 0 | |||||
| 2025-08-14 | 13F | Two Sigma Investments, Lp | 114 592 | -31,49 | 321 | -33,05 | ||||
| 2025-08-13 | 13F | Aisling Capital Management LP | 1 198 418 | 0,00 | 3 356 | -2,10 | ||||
| 2025-08-14 | 13F | Millennium Management Llc | Call | 200 000 | 560 | |||||
| 2025-08-14 | 13F | Millennium Management Llc | 1 741 782 | -37,20 | 4 877 | -38,53 | ||||
| 2025-08-14 | 13F | TCG Crossover Management, LLC | 0 | -100,00 | 0 | |||||
| 2025-08-15 | 13F | Northeast Financial Consultants Inc | 21 000 | 59 | ||||||
| 2025-08-15 | 13F/A | Exome Asset Management LLC | 213 544 | 598 | ||||||
| 2025-05-14 | 13F | Walleye Trading LLC | Put | 0 | -100,00 | 0 | -100,00 | |||
| 2025-08-05 | 13F | Tsfg, Llc | 100 | 0,00 | 0 | |||||
| 2025-08-11 | 13F | HighTower Advisors, LLC | 11 242 | 4,51 | 31 | 3,33 | ||||
| 2025-08-11 | 13F | Fore Capital, LLC | 20 000 | -42,86 | 56 | -44,00 | ||||
| 2025-08-13 | 13F | Cerity Partners LLC | 10 214 | -0,71 | 29 | -3,45 | ||||
| 2025-08-18 | 13F | Wolverine Trading, Llc | 16 511 | 41,42 | 46 | 32,35 | ||||
| 2025-08-13 | 13F | Kilter Group LLC | 200 | 1 | ||||||
| 2025-08-18 | 13F | Wolverine Trading, Llc | Call | 57 100 | 302,11 | 158 | 285,37 | |||
| 2025-08-12 | 13F | MAI Capital Management | 800 | 0,00 | 2 | 0,00 | ||||
| 2025-08-14 | 13F | Atom Investors LP | 13 741 | -32,02 | 38 | -33,33 | ||||
| 2025-08-05 | 13F | Huntington National Bank | 501 | 0,00 | 1 | 0,00 | ||||
| 2025-07-22 | 13F | Old National Bancorp /in/ | 15 600 | 0,00 | 44 | -2,27 | ||||
| 2025-08-15 | 13F | State of Tennessee, Treasury Department | 0 | -100,00 | 0 | |||||
| 2025-07-22 | 13F | Gf Fund Management Co. Ltd. | 1 261 | 0,00 | 4 | 0,00 | ||||
| 2025-08-14 | 13F | Alliancebernstein L.p. | 0 | -100,00 | 0 | |||||
| 2025-08-14 | 13F | Wells Fargo & Company/mn | 142 645 | -8,02 | 399 | -9,93 | ||||
| 2025-08-14 | 13F | Daiwa Securities Group Inc. | 327 | 0 | ||||||
| 2025-06-25 | NP | BBC - Virtus LifeSci Biotech Clinical Trials ETF | 37 250 | 170,28 | 148 | 150,85 | ||||
| 2025-08-14 | 13F | Stifel Financial Corp | 22 100 | 0,00 | 62 | -3,17 | ||||
| 2025-08-14 | 13F | Logos Global Management LP | 0 | -100,00 | 0 |