Statistiques de base
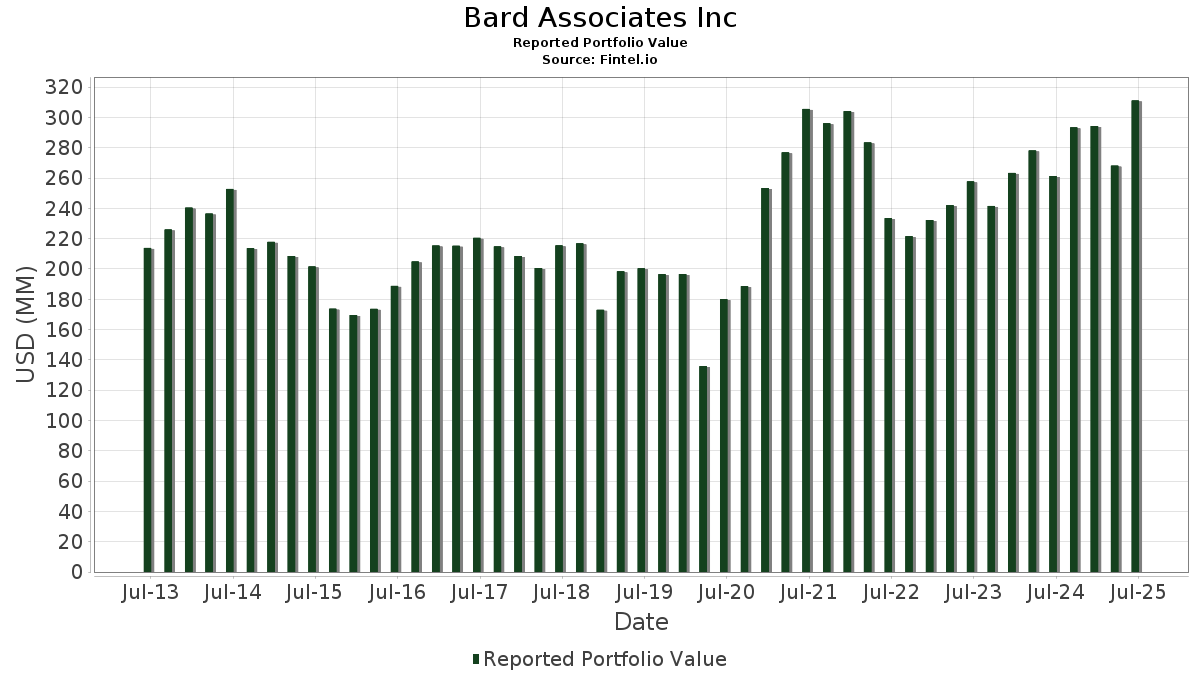
| Valeur du portefeuille | $ 311 113 011 |
| Positions actuelles | 173 |
Dernières positions, performances, ASG (à partir des dépôts 13F, 13D)
Bard Associates Inc a déclaré un total de 173 positions dans ses derniers dépôts auprès de la SEC. La valeur la plus récente du portefeuille est calculée à 311 113 011 USD. Les actifs sous gestion réels (ASG) sont cette valeur plus les liquidités (qui ne sont pas divulguées). Les principales positions de Bard Associates Inc sont The Ensign Group, Inc. (US:ENSG) , VanEck ETF Trust - VanEck BDC Income ETF (US:BIZD) , Willdan Group, Inc. (US:WLDN) , Coherent Corp. (US:COHR) , and Flaherty & Crumrine Preferred Securities Income Fund Inc. (US:FFC) . Les nouvelles positions de Bard Associates Inc incluent OR Royalties Inc. (US:OR) , Janus Detroit Street Trust - Janus Henderson AAA CLO ETF (US:JAAA) , Aehr Test Systems, Inc. (US:AEHR) , Ascent Industries Co. (US:ACNT) , and Inuvo, Inc. (US:INUV) . Les principales industries de Bard Associates Inc sont "Construction Special Trade Contractors" (sic 17) , "Educational Services" (sic 82) , and "Apparel And Accessory Stores" (sic 56) .
Meilleures augmentations ce trimestre
Nous utilisons la variation de l'allocation du portefeuille car il s'agit de l'indicateur le plus significatif. Les changements peuvent être dus à des transactions ou à des variations de prix des actions.
| Titre | Actions (en millions) |
Valeur ($ en millions) |
% du portefeuille | ΔPortefeuille % |
|---|---|---|---|---|
| 0,50 | 8,17 | 2,6266 | 2,3424 | |
| 0,45 | 7,26 | 2,3334 | 1,9541 | |
| 0,22 | 6,78 | 2,1801 | 1,9299 | |
| 0,20 | 5,04 | 1,6190 | 1,6190 | |
| 0,62 | 4,24 | 1,3630 | 1,3630 | |
| 0,08 | 4,00 | 1,2865 | 1,2865 | |
| 0,19 | 2,52 | 0,8085 | 0,8085 | |
| 0,17 | 2,17 | 0,6974 | 0,6974 | |
| 0,13 | 8,17 | 2,6260 | 0,5820 | |
| 0,39 | 1,79 | 0,5760 | 0,5760 |
Principales baisses ce trimestre
Nous utilisons la variation de l'allocation du portefeuille car il s'agit de l'indicateur le plus significatif. Les changements peuvent être dus à des transactions ou à des variations de prix des actions.
| Titre | Actions (en millions) |
Valeur ($ en millions) |
% du portefeuille | ΔPortefeuille % |
|---|---|---|---|---|
| 0,09 | 4,15 | 1,3336 | -0,7293 | |
| 0,00 | 0,00 | -0,6231 | ||
| 0,00 | 0,00 | -0,6174 | ||
| 0,19 | 4,22 | 1,3574 | -0,5127 | |
| 0,19 | 4,66 | 1,4993 | -0,5098 | |
| 0,19 | 4,56 | 1,4651 | -0,4871 | |
| 0,43 | 2,46 | 0,7920 | -0,3932 | |
| 0,29 | 5,95 | 1,9119 | -0,3360 | |
| 0,06 | 2,44 | 0,7841 | -0,3007 | |
| 0,13 | 2,37 | 0,7623 | -0,2990 |
Déclarations 13D/G
Il s'agit d'une liste des déclarations 13D et 13G déposées au cours de la dernière année (le cas échéant). Cliquez sur l'icône du lien pour voir l'historique complet des transactions. Les lignes vertes indiquent de nouvelles positions. Les lignes rouges indiquent des positions fermées.
| Date de dépôt | Formulaire | Titre | Actions précédentes |
Actions actuelles |
ΔActions % | % de participation |
% ΔParticipation | |
|---|---|---|---|---|---|---|---|---|
| 2025-08-11 | / (73102V105) | 386 389 | 15,40 | |||||
| 2025-07-02 | PMNT / Perfect Moment Ltd. | 4 400 000 | 16,40 | |||||
| 2025-07-02 | MODD / Modular Medical, Inc. | 2 910 219 | 5,60 | |||||
| 2025-05-13 | CJMB / Callan JMB Inc. | 412 335 | 412 335 | 0,00 | 9,30 | 0,00 | ||
| 2025-05-12 | BLIN / Bridgeline Digital, Inc. | 1 320 694 | 1 333 901 | 1,00 | 11,20 | 0,90 | ||
| 2025-02-12 | DUOT / Duos Technologies Group, Inc. | 418 283 | 284 900 | -31,89 | 3,40 | -41,38 | ||
| 2025-01-08 | AMPG / AmpliTech Group, Inc. | 2 074 439 | 1 741 019 | -16,07 | 8,80 | -52,69 | ||
| 2024-11-13 | MOB / Mobilicom Limited - Depositary Receipt (Common Stock) | 440 275 | 691 491 | 57,06 | 10,60 | 21,84 | ||
| 2024-11-06 | POLA / Polar Power, Inc. | 2 806 023 | 3 011 623 | 7,33 | 17,10 | 6,88 | ||
| 2024-09-27 | VSTRD / Netcapital Inc | 1 175 810 | 3 120 | -99,73 | 0,40 | -95,12 |
Déclarations 13F et dépôts de fonds
Ce formulaire a été déposé le 2025-08-05 pour la période de déclaration 2025-06-30. Cliquez sur l'icône du lien pour voir l'historique complet des transactions.
Mettre à niveau pour débloquer les données premium et exporter vers Excel ![]() .
.
| Titre | Type | Prix moyen de l'action | Actions (en millions) |
ΔActions (%) |
ΔActions (%) |
Valeur ($ en millions) |
Portefeuille (%) |
ΔPortefeuille (%) |
|
|---|---|---|---|---|---|---|---|---|---|
| ENSG / The Ensign Group, Inc. | 0,08 | -4,48 | 13,12 | 13,86 | 4,2159 | -0,0804 | |||
| BIZD / VanEck ETF Trust - VanEck BDC Income ETF | 0,50 | 1 003,80 | 8,17 | 972,31 | 2,6266 | 2,3424 | |||
| WLDN / Willdan Group, Inc. | 0,13 | -2,89 | 8,17 | 49,07 | 2,6260 | 0,5820 | |||
| COHR / Coherent Corp. | 0,09 | -1,99 | 7,97 | 34,63 | 2,5616 | 0,3539 | |||
| FFC / Flaherty & Crumrine Preferred Securities Income Fund Inc. | 0,45 | 598,02 | 7,26 | 613,77 | 2,3334 | 1,9541 | |||
| PFF / iShares Trust - iShares Preferred and Income Securities ETF | 0,22 | 912,94 | 6,78 | 912,24 | 2,1801 | 1,9299 | |||
| FIP / FTAI Infrastructure Inc. | 1,09 | -3,75 | 6,70 | 31,11 | 2,1528 | 0,2474 | |||
| ODC / Oil-Dri Corporation of America | 0,11 | -3,70 | 6,47 | 23,71 | 2,0793 | 0,1289 | |||
| MAMA / Mama's Creations, Inc. | 0,73 | -6,43 | 6,10 | 19,29 | 1,9598 | 0,0535 | |||
| TPZ / Tortoise Essential Energy Fund | 0,29 | -0,58 | 5,95 | -1,29 | 1,9119 | -0,3360 | |||
| LGCY / Legacy Education Inc. | 0,48 | -3,60 | 5,40 | 50,32 | 1,7342 | 0,3955 | |||
| WPM / Wheaton Precious Metals Corp. | 0,06 | -5,25 | 5,22 | 9,62 | 1,6769 | -0,0984 | |||
| OR / OR Royalties Inc. | 0,20 | 5,04 | 1,6190 | 1,6190 | |||||
| CSV / Carriage Services, Inc. | 0,11 | -3,11 | 4,91 | 14,38 | 1,5777 | -0,0231 | |||
| ACU / Acme United Corporation | 0,11 | -3,33 | 4,67 | 0,78 | 1,5001 | -0,2268 | |||
| AROC / Archrock, Inc. | 0,19 | -8,49 | 4,66 | -13,41 | 1,4993 | -0,5098 | |||
| GDXJ / VanEck ETF Trust - VanEck Junior Gold Miners ETF | 0,07 | -9,26 | 4,60 | 7,22 | 1,4790 | -0,1217 | |||
| USAC / USA Compression Partners, LP - Limited Partnership | 0,19 | -3,35 | 4,56 | -12,92 | 1,4651 | -0,4871 | |||
| KTOS / Kratos Defense & Security Solutions, Inc. | 0,09 | -1,48 | 4,27 | 54,17 | 1,3732 | 0,3394 | |||
| TGEN / Tecogen Inc. | 0,62 | 4,24 | 1,3630 | 1,3630 | |||||
| LEGH / Legacy Housing Corporation | 0,19 | -6,26 | 4,22 | -15,78 | 1,3574 | -0,5127 | |||
| BKTI / BK Technologies Corporation | 0,09 | -37,58 | 4,15 | -24,99 | 1,3336 | -0,7293 | |||
| CMPO / CompoSecure, Inc. | 0,29 | -4,35 | 4,11 | 24,00 | 1,3202 | 0,0847 | |||
| JAAA / Janus Detroit Street Trust - Janus Henderson AAA CLO ETF | 0,08 | 4,00 | 1,2865 | 1,2865 | |||||
| LGL / The LGL Group, Inc. | 0,52 | -4,56 | 3,93 | 11,37 | 1,2623 | -0,0529 | |||
| KFS / Kingsway Financial Services Inc. | 0,28 | -3,94 | 3,85 | 64,19 | 1,2367 | 0,3629 | |||
| CXDO / Crexendo, Inc. | 0,62 | -6,46 | 3,78 | 16,59 | 1,2156 | 0,0057 | |||
| USPH / U.S. Physical Therapy, Inc. | 0,05 | -0,07 | 3,77 | 7,35 | 1,2120 | -0,0982 | |||
| PCYO / Pure Cycle Corporation | 0,34 | -5,33 | 3,69 | -3,07 | 1,1858 | -0,2338 | |||
| MPTI / M-tron Industries, Inc. | 0,09 | -1,69 | 3,66 | -7,30 | 1,1757 | -0,2960 | |||
| FSK / FS KKR Capital Corp. | 0,17 | -1,21 | 3,50 | -2,12 | 1,1264 | -0,2090 | |||
| AMPG / AmpliTech Group, Inc. | 1,62 | -2,55 | 3,44 | 33,33 | 1,1058 | 0,1431 | |||
| OSS / One Stop Systems, Inc. | 0,95 | -7,96 | 3,36 | 40,81 | 1,0816 | 0,1905 | |||
| SELF / Global Self Storage, Inc. | 0,63 | -3,17 | 3,34 | 2,58 | 1,0750 | -0,1409 | |||
| BXSL / Blackstone Secured Lending Fund | 0,09 | -0,81 | 2,99 | -5,63 | 0,9598 | -0,2204 | |||
| RWAY / Runway Growth Finance Corp. | 0,28 | -2,85 | 2,96 | -2,63 | 0,9506 | -0,1824 | |||
| RGLD / Royal Gold, Inc. | 0,02 | -9,58 | 2,92 | -1,65 | 0,9385 | -0,1688 | |||
| PSCU / Invesco Exchange-Traded Fund Trust II - Invesco S&P SmallCap Utilities & Communication Services ETF | 0,05 | -1,08 | 2,76 | -3,13 | 0,8860 | -0,1753 | |||
| INLX / Intellinetics, Inc. | 0,22 | 89,66 | 2,75 | 91,04 | 0,8837 | 0,3469 | |||
| SMID / Smith-Midland Corporation | 0,08 | -4,11 | 2,74 | 3,55 | 0,8810 | -0,1060 | |||
| VICI / VICI Properties Inc. | 0,08 | -0,72 | 2,53 | -0,78 | 0,8129 | -0,1378 | |||
| AEHR / Aehr Test Systems, Inc. | 0,19 | 2,52 | 0,8085 | 0,8085 | |||||
| EQX / Equinox Gold Corp. | 0,43 | -7,22 | 2,46 | -22,44 | 0,7920 | -0,3932 | |||
| PCH / PotlatchDeltic Corporation | 0,06 | -1,37 | 2,44 | -16,13 | 0,7841 | -0,3007 | |||
| ASM / Avino Silver & Gold Mines Ltd. | 0,67 | -3,52 | 2,39 | 88,80 | 0,7696 | 0,2965 | |||
| IRT / Independence Realty Trust, Inc. | 0,13 | -0,07 | 2,37 | -16,66 | 0,7623 | -0,2990 | |||
| VMD / Viemed Healthcare, Inc. | 0,34 | -3,80 | 2,32 | -8,68 | 0,7470 | -0,2023 | |||
| VENU / Venu Holding Corporation | 0,20 | -6,66 | 2,32 | 19,01 | 0,7467 | 0,0184 | |||
| MODD / Modular Medical, Inc. | 3,11 | 44,97 | 2,32 | -0,94 | 0,7447 | -0,1274 | |||
| PSTL / Postal Realty Trust, Inc. | 0,16 | -1,08 | 2,30 | 2,04 | 0,7385 | -0,1013 | |||
| WELL / Welltower Inc. | 0,01 | -0,63 | 2,18 | -0,27 | 0,7014 | -0,1149 | |||
| ACNT / Ascent Industries Co. | 0,17 | 2,17 | 0,6974 | 0,6974 | |||||
| AMRK / A-Mark Precious Metals, Inc. | 0,09 | -2,33 | 2,04 | -14,62 | 0,6571 | -0,2359 | |||
| CJMB / Callan JMB Inc. | 0,40 | -5,07 | 2,02 | 8,35 | 0,6507 | -0,0461 | |||
| KWR / Quaker Chemical Corporation | 0,02 | 0,00 | 1,97 | -9,44 | 0,6323 | -0,1779 | |||
| LOAN / Manhattan Bridge Capital, Inc. | 0,36 | -1,80 | 1,95 | -9,13 | 0,6273 | -0,1736 | |||
| BLIN / Bridgeline Digital, Inc. | 1,40 | 6,59 | 1,95 | 0,10 | 0,6273 | -0,0998 | |||
| CELH / Celsius Holdings, Inc. | 0,04 | -13,87 | 1,93 | 12,15 | 0,6203 | -0,0214 | |||
| VMBS / Vanguard Scottsdale Funds - Vanguard Mortgage-Backed Securities ETF | 0,04 | -2,39 | 1,89 | -2,32 | 0,6089 | -0,1145 | |||
| BRT / BRT Apartments Corp. | 0,12 | -0,61 | 1,88 | -8,48 | 0,6035 | -0,1614 | |||
| FNV / Franco-Nevada Corporation | 0,01 | -0,18 | 1,85 | 3,87 | 0,5955 | -0,0699 | |||
| ALCO / Alico, Inc. | 0,06 | -3,30 | 1,85 | 5,95 | 0,5953 | -0,0570 | |||
| INUV / Inuvo, Inc. | 0,39 | 1,79 | 0,5760 | 0,5760 | |||||
| RSSS / Research Solutions, Inc. | 0,62 | -4,71 | 1,78 | 5,19 | 0,5735 | -0,0592 | |||
| VPU / Vanguard World Fund - Vanguard Utilities ETF | 0,01 | 0,88 | 1,71 | 4,26 | 0,5503 | -0,0622 | |||
| GWRS / Global Water Resources, Inc. | 0,16 | -2,01 | 1,65 | -3,17 | 0,5299 | -0,1050 | |||
| ACCS / ACCESS Newswire Inc. | 0,13 | -4,75 | 1,62 | 32,62 | 0,5216 | 0,0655 | |||
| NEE / NextEra Energy, Inc. | 0,02 | 1,08 | 1,56 | -1,01 | 0,5021 | -0,0865 | |||
| INTT / inTEST Corporation | 0,21 | 0,85 | 1,56 | 4,99 | 0,5011 | -0,0525 | |||
| MOB / Mobilicom Limited - Depositary Receipt (Common Stock) | 0,59 | -7,24 | 1,49 | 41,61 | 0,4805 | 0,0869 | |||
| BRK.A / Berkshire Hathaway Inc. | 0,00 | 0,00 | 1,48 | -8,78 | 0,4742 | -0,1291 | |||
| MDV / Modiv Industrial, Inc. | 0,10 | -0,29 | 1,46 | -12,53 | 0,4690 | -0,1532 | |||
| TRGP / Targa Resources Corp. | 0,01 | 0,00 | 1,44 | -13,17 | 0,4620 | -0,1554 | |||
| RMT / Royce Micro-Cap Trust, Inc. | 0,15 | -0,06 | 1,42 | 9,63 | 0,4576 | -0,0266 | |||
| NEWT / NewtekOne, Inc. | 0,13 | -1,45 | 1,42 | -7,01 | 0,4562 | -0,1133 | |||
| AIOT / PowerFleet, Inc. | 0,32 | -6,08 | 1,40 | -26,27 | 0,4485 | -0,2573 | |||
| AFK / VanEck ETF Trust - VanEck Africa Index ETF | 0,03 | -12,95 | 1,32 | -1,42 | 0,4244 | -0,0752 | |||
| HROW / Harrow, Inc. | 0,04 | -26,70 | 1,28 | -15,88 | 0,4123 | -0,1562 | |||
| LAND / Gladstone Land Corporation | 0,13 | -3,14 | 1,28 | -6,38 | 0,4103 | -0,0981 | |||
| NMTC / NeuroOne Medical Technologies Corporation | 1,85 | 1,26 | 0,4043 | 0,4043 | |||||
| PMNT / Perfect Moment Ltd. | 4,40 | 1,19 | 0,3819 | 0,3819 | |||||
| IEX / IDEX Corporation | 0,01 | 0,00 | 1,19 | -2,95 | 0,3809 | -0,0747 | |||
| UTMD / Utah Medical Products, Inc. | 0,02 | -4,87 | 1,14 | -3,38 | 0,3679 | -0,0739 | |||
| SLV / iShares Silver Trust | 0,03 | -0,63 | 1,14 | 5,18 | 0,3660 | -0,0377 | |||
| PBA / Pembina Pipeline Corporation | 0,03 | -0,17 | 1,11 | -6,47 | 0,3582 | -0,0861 | |||
| ASUR / Asure Software, Inc. | 0,11 | 0,00 | 1,09 | 2,16 | 0,3503 | -0,0474 | |||
| NEM / Newmont Corporation | 0,02 | -0,29 | 1,01 | 20,36 | 0,3252 | 0,0116 | |||
| OBDC / Blue Owl Capital Corporation | 0,07 | -0,33 | 1,00 | -2,45 | 0,3203 | -0,0607 | |||
| CTRE / CareTrust REIT, Inc. | 0,03 | -1,03 | 0,98 | 5,86 | 0,3138 | -0,0301 | |||
| DTST / Data Storage Corporation | 0,28 | -7,29 | 0,97 | -12,42 | 0,3106 | -0,1008 | |||
| JKHY / Jack Henry & Associates, Inc. | 0,01 | -0,93 | 0,96 | -2,33 | 0,3098 | -0,0579 | |||
| RMNI / Rimini Street, Inc. | 0,24 | -16,32 | 0,92 | -9,33 | 0,2967 | -0,0831 | |||
| KYN / Kayne Anderson Energy Infrastructure Fund, Inc. | 0,07 | 4,32 | 0,89 | 3,38 | 0,2856 | -0,0348 | |||
| PAVE / Global X Funds - Global X U.S. Infrastructure Development ETF | 0,02 | -0,20 | 0,88 | 15,58 | 0,2841 | -0,0012 | |||
| BANX / ArrowMark Financial Corp. | 0,04 | -0,97 | 0,86 | -1,61 | 0,2761 | -0,0492 | |||
| EPM / Evolution Petroleum Corporation | 0,18 | -19,00 | 0,85 | -26,50 | 0,2720 | -0,1575 | |||
| UMH / UMH Properties, Inc. | 0,05 | 0,00 | 0,82 | -10,26 | 0,2644 | -0,0773 | |||
| PNTG / The Pennant Group, Inc. | 0,03 | 0,00 | 0,79 | 18,77 | 0,2543 | 0,0057 | |||
| ABCB / Ameris Bancorp | 0,01 | -0,30 | 0,74 | 12,07 | 0,2390 | -0,0086 | |||
| TYG / Tortoise Energy Infrastructure Corporation | 0,02 | 5,23 | 0,73 | 7,31 | 0,2360 | -0,0192 | |||
| ATOM / Atomera Incorporated | 0,14 | -12,26 | 0,73 | 10,47 | 0,2342 | -0,0116 | |||
| MLR / Miller Industries, Inc. | 0,02 | -1,52 | 0,72 | 3,30 | 0,2314 | -0,0284 | |||
| WFCF / Where Food Comes From, Inc. | 0,06 | -6,47 | 0,69 | -6,60 | 0,2229 | -0,0539 | |||
| UWM / ProShares Trust - ProShares Ultra Russell2000 | 0,02 | -0,31 | 0,68 | 12,11 | 0,2176 | -0,0077 | |||
| JYNT / The Joint Corp. | 0,06 | -19,09 | 0,68 | -25,25 | 0,2172 | -0,1200 | |||
| POLA / Polar Power, Inc. | 0,39 | -13,59 | 0,67 | -37,93 | 0,2159 | -0,1873 | |||
| REZ / iShares Trust - iShares Residential and Multisector Real Estate ETF | 0,01 | 5,43 | 0,64 | 0,47 | 0,2062 | -0,0320 | |||
| AIRG / Airgain, Inc. | 0,15 | -5,59 | 0,62 | 16,38 | 0,1988 | 0,0004 | |||
| BBDC / Barings BDC, Inc. | 0,07 | -0,81 | 0,62 | -4,95 | 0,1978 | -0,0437 | |||
| GENK / GEN Restaurant Group, Inc. | 0,15 | -11,38 | 0,59 | -37,45 | 0,1908 | -0,1628 | |||
| INDS / Pacer Funds Trust - Pacer Industrial Real Estate ETF | 0,02 | 6,45 | 0,57 | 6,54 | 0,1834 | -0,0164 | |||
| FLOT / iShares Trust - iShares Floating Rate Bond ETF | 0,01 | 0,26 | 0,57 | 0,18 | 0,1818 | -0,0287 | |||
| AMLP / ALPS ETF Trust - Alerian MLP ETF | 0,01 | 4,81 | 0,56 | -1,40 | 0,1815 | -0,0321 | |||
| NEPH / Nephros, Inc. | 0,13 | -8,45 | 0,54 | 117,89 | 0,1724 | 0,0805 | |||
| CDE / Coeur Mining, Inc. | 0,06 | -0,11 | 0,49 | 49,70 | 0,1589 | 0,0356 | |||
| HBM / Hudbay Minerals Inc. | 0,05 | -0,37 | 0,49 | 39,43 | 0,1571 | 0,0262 | |||
| PLYM / Plymouth Industrial REIT, Inc. | 0,03 | -0,51 | 0,48 | -2,04 | 0,1542 | -0,0283 | |||
| ARCC / Ares Capital Corporation | 0,02 | 0,00 | 0,47 | -0,85 | 0,1509 | -0,0258 | |||
| JOF / Japan Smaller Capitalization Fund, Inc. | 0,05 | -1,92 | 0,47 | 12,80 | 0,1503 | -0,0045 | |||
| PDEX / Pro-Dex, Inc. | 0,01 | -22,07 | 0,46 | -31,45 | 0,1486 | -0,1028 | |||
| SANG / Sangoma Technologies Corporation | 0,07 | -13,03 | 0,45 | 18,42 | 0,1447 | 0,0028 | |||
| TACT / TransAct Technologies Incorporated | 0,12 | -11,37 | 0,44 | -13,00 | 0,1399 | -0,0468 | |||
| CLFD / Clearfield, Inc. | 0,01 | -17,96 | 0,43 | 20,00 | 0,1370 | 0,0043 | |||
| GLD / SPDR Gold Trust | 0,00 | 0,00 | 0,40 | 5,56 | 0,1286 | -0,0124 | |||
| CRWS / Crown Crafts, Inc. | 0,13 | -4,57 | 0,39 | -24,23 | 0,1266 | -0,0676 | |||
| SAR / Saratoga Investment Corp. | 0,02 | -0,63 | 0,39 | -2,73 | 0,1263 | -0,0243 | |||
| HASI / HA Sustainable Infrastructure Capital, Inc. | 0,01 | -9,75 | 0,39 | -17,02 | 0,1254 | -0,0501 | |||
| CSWC / Capital Southwest Corporation | 0,02 | 0,00 | 0,38 | -1,30 | 0,1222 | -0,0214 | |||
| RDVT / Red Violet, Inc. | 0,01 | -12,94 | 0,38 | 13,90 | 0,1215 | -0,0022 | |||
| MRTN / Marten Transport, Ltd. | 0,03 | 0,00 | 0,36 | -5,28 | 0,1155 | -0,0260 | |||
| BBCP / Concrete Pumping Holdings, Inc. | 0,06 | -14,83 | 0,35 | -4,08 | 0,1135 | -0,0238 | |||
| NEO / NeoGenomics, Inc. | 0,05 | 0,00 | 0,35 | -22,94 | 0,1113 | -0,0564 | |||
| MSAI / MultiSensor AI Holdings, Inc. | 0,58 | -18,05 | 0,35 | -47,34 | 0,1113 | -0,1338 | |||
| META / Meta Platforms, Inc. | 0,00 | 0,00 | 0,33 | 27,97 | 0,1075 | 0,0101 | |||
| VNQ / Vanguard Specialized Funds - Vanguard Real Estate ETF | 0,00 | 12,30 | 0,33 | 10,47 | 0,1053 | -0,0053 | |||
| OOMA / Ooma, Inc. | 0,03 | -10,35 | 0,33 | -11,65 | 0,1050 | -0,0329 | |||
| TCX / Tucows Inc. | 0,02 | -20,26 | 0,31 | -6,91 | 0,0997 | -0,0246 | |||
| EVI / EVI Industries, Inc. | 0,01 | 7,60 | 0,31 | 40,37 | 0,0984 | 0,0168 | |||
| LXP / LXP Industrial Trust | 0,04 | 0,00 | 0,30 | -4,42 | 0,0975 | -0,0209 | |||
| NMFC / New Mountain Finance Corporation | 0,03 | 0,00 | 0,29 | -4,62 | 0,0932 | -0,0199 | |||
| INFU / InfuSystem Holdings, Inc. | 0,05 | -25,97 | 0,28 | -14,20 | 0,0915 | -0,0321 | |||
| PAYS / Paysign, Inc. | 0,04 | 0,00 | 0,26 | 238,96 | 0,0841 | 0,0554 | |||
| BCPC / Balchem Corporation | 0,00 | -0,62 | 0,25 | -4,87 | 0,0819 | -0,0178 | |||
| SAND / Sandstorm Gold Ltd. | 0,03 | 0,00 | 0,24 | 24,34 | 0,0758 | 0,0052 | |||
| CECO / CECO Environmental Corp. | 0,01 | 0,24 | 0,0757 | 0,0757 | |||||
| ESBA / Empire State Realty OP, L.P. - Limited Partnership | 0,03 | 0,23 | 0,0728 | 0,0728 | |||||
| WHF / WhiteHorse Finance, Inc. | 0,02 | -2,04 | 0,22 | -11,38 | 0,0703 | -0,0215 | |||
| TIP / iShares Trust - iShares TIPS Bond ETF | 0,00 | 0,00 | 0,22 | -0,91 | 0,0700 | -0,0120 | |||
| SLRC / SLR Investment Corp. | 0,01 | -1,11 | 0,22 | -5,26 | 0,0694 | -0,0157 | |||
| FTLF / FitLife Brands, Inc. | 0,02 | -26,57 | 0,21 | -20,75 | 0,0675 | -0,0316 | |||
| JJSF / J&J Snack Foods Corp. | 0,00 | 0,00 | 0,21 | -13,87 | 0,0661 | -0,0229 | |||
| EFT / Eaton Vance Floating-Rate Income Trust | 0,02 | 0,00 | 0,19 | -0,53 | 0,0609 | -0,0102 | |||
| CGO / Calamos Global Total Return Fund | 0,01 | 0,00 | 0,17 | 13,70 | 0,0535 | -0,0013 | |||
| NNDM / Nano Dimension Ltd. - Depositary Receipt (Common Stock) | 0,10 | -3,02 | 0,16 | -1,27 | 0,0502 | -0,0088 | |||
| SOTK / Sono-Tek Corporation | 0,04 | -28,40 | 0,15 | -26,34 | 0,0487 | -0,0279 | |||
| FLL / Full House Resorts, Inc. | 0,04 | 0,00 | 0,13 | -12,75 | 0,0420 | -0,0136 | |||
| VAPE / CEA Industries Inc. | 0,01 | -8,75 | 0,11 | 2,88 | 0,0346 | -0,0045 | |||
| MPTI.WS / M-tron Industries, Inc. - Equity Warrant | 0,09 | 0,09 | 0,0290 | 0,0290 | |||||
| UGRO / urban-gro, Inc. | 0,22 | -7,77 | 0,07 | -31,63 | 0,0216 | -0,0149 | |||
| DAIO / Data I/O Corporation | 0,02 | -2,03 | 0,07 | 22,22 | 0,0215 | 0,0012 | |||
| DLHC / DLH Holdings Corp. | 0,01 | -4,42 | 0,06 | 37,21 | 0,0193 | 0,0030 | |||
| BIOX / Bioceres Crop Solutions Corp. | 0,01 | -11,25 | 0,06 | -12,50 | 0,0181 | -0,0061 | |||
| MOBBW / Mobilicom Limited - Equity Warrant | 0,14 | -4,62 | 0,05 | 8,16 | 0,0172 | -0,0011 | |||
| KRMD / KORU Medical Systems, Inc. | 0,01 | -43,69 | 0,05 | -20,00 | 0,0168 | -0,0078 | |||
| AMPGW / AmpliTech Group, Inc. - Equity Warrant | 0,08 | 0,00 | 0,04 | 25,71 | 0,0142 | 0,0008 | |||
| SGMA / SigmaTron International, Inc. | 0,01 | 0,00 | 0,04 | 147,06 | 0,0136 | 0,0070 | |||
| SLI / Standard Lithium Ltd. | 0,02 | -50,80 | 0,04 | -26,00 | 0,0122 | -0,0064 | |||
| DTSTW / Data Storage Corporation - Equity Warrant | 0,15 | -7,64 | 0,02 | -69,64 | 0,0056 | -0,0155 | |||
| BFRIW / Biofrontera Inc. - Equity Warrant | 0,15 | -13,90 | 0,02 | 60,00 | 0,0052 | 0,0011 | |||
| EDBLW / Edible Garden AG Incorporated - Equity Warrant | 0,14 | -8,25 | 0,01 | 100,00 | 0,0046 | 0,0017 | |||
| NCPLW / Netcapital Inc. - Equity Warrant | 0,20 | -6,58 | 0,01 | 40,00 | 0,0024 | 0,0004 | |||
| VAPEW / CEA Industries Inc. - Equity Warrant | 0,21 | -8,28 | 0,00 | 33,33 | 0,0015 | 0,0003 | |||
| PXSA.W / Pyxis Tankers Inc. - Equity Warrant | 0,07 | -8,29 | 0,00 | 0,00 | 0,0005 | -0,0001 | |||
| ACRE / Ares Commercial Real Estate Corporation | 0,00 | -100,00 | 0,00 | 0,0000 | |||||
| BEEM / Beam Global | 0,00 | -100,00 | 0,00 | -100,00 | -0,0315 | ||||
| SACH / Sachem Capital Corp. | 0,00 | -100,00 | 0,00 | -100,00 | -0,2314 | ||||
| GMRE / Global Medical REIT Inc. | 0,00 | -100,00 | 0,00 | -100,00 | -0,0623 | ||||
| HBIO / Harvard Bioscience, Inc. | 0,00 | -100,00 | 0,00 | -100,00 | -0,0532 | ||||
| OR / OR Royalties Inc. | 0,00 | -100,00 | 0,00 | 0,0000 | |||||
| FTK / Flotek Industries, Inc. | 0,00 | -100,00 | 0,00 | 0,0000 | |||||
| SOHO / Sotherly Hotels Inc. | 0,00 | -100,00 | 0,00 | -100,00 | -0,1063 | ||||
| INUV / Inuvo, Inc. | 0,00 | -100,00 | 0,00 | 0,0000 | |||||
| XFLT / XAI Octagon Floating Rate & Alternative Income Trust | 0,00 | -100,00 | 0,00 | 0,0000 | |||||
| ECC / Eagle Point Credit Company Inc. | 0,00 | -100,00 | 0,00 | -100,00 | -0,6231 | ||||
| DLPN / Dolphin Entertainment, Inc. | 0,00 | -100,00 | 0,00 | 0,0000 | |||||
| EIC / Eagle Point Income Company Inc. | 0,00 | -100,00 | 0,00 | -100,00 | -0,6174 | ||||
| VOXR / Vox Royalty Corp. | 0,00 | -100,00 | 0,00 | 0,0000 | |||||
| BHR / Braemar Hotels & Resorts Inc. | 0,00 | -100,00 | 0,00 | 0,0000 | |||||
| OXLC / Oxford Lane Capital Corp. | 0,00 | -100,00 | 0,00 | 0,0000 | |||||
| DUOT / Duos Technologies Group, Inc. | 0,00 | -100,00 | 0,00 | 0,0000 |