Statistiques de base
| Profil de l'initié | Palogic Value Management, L.P. |
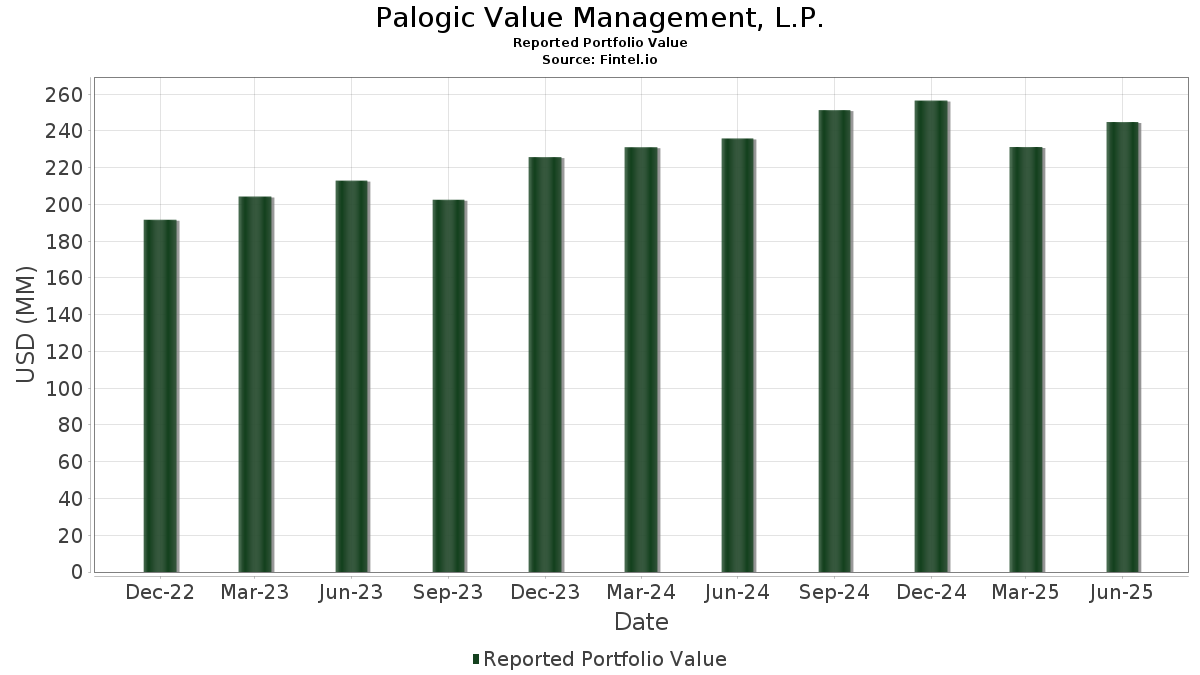
| Valeur du portefeuille | $ 244 872 595 |
| Positions actuelles | 163 |
Dernières positions, performances, ASG (à partir des dépôts 13F, 13D)
Palogic Value Management, L.P. a déclaré un total de 163 positions dans ses derniers dépôts auprès de la SEC. La valeur la plus récente du portefeuille est calculée à 244 872 595 USD. Les actifs sous gestion réels (ASG) sont cette valeur plus les liquidités (qui ne sont pas divulguées). Les principales positions de Palogic Value Management, L.P. sont Open Lending Corporation (US:LPRO) , Apple Inc. (US:AAPL) , SPDR Series Trust - SPDR Bloomberg 1-3 Month T-Bill ETF (US:BIL) , Broadcom Inc. (US:AVGO) , and Microsoft Corporation (US:MSFT) . Les nouvelles positions de Palogic Value Management, L.P. incluent LivePerson, Inc. (US:US538146AD33) , Globalstar, Inc. (US:GSAT) , Cloudflare, Inc. (US:NET) , IREN Limited (US:IREN) , and D-Wave Quantum Inc. (US:QBTS) . Les principales industries de Palogic Value Management, L.P. sont "Depository Institutions" (sic 60) , "Holding And Other Investment Offices" (sic 67) , and "Business Services" (sic 73) .
Meilleures augmentations ce trimestre
Nous utilisons la variation de l'allocation du portefeuille car il s'agit de l'indicateur le plus significatif. Les changements peuvent être dus à des transactions ou à des variations de prix des actions.
| Titre | Actions (en millions) |
Valeur ($ en millions) |
% du portefeuille | ΔPortefeuille % |
|---|---|---|---|---|
| 5,90 | 11,45 | 4,6743 | 3,3430 | |
| 0,03 | 9,07 | 3,7049 | 0,9702 | |
| 0,02 | 8,29 | 3,3854 | 0,6636 | |
| 0,05 | 1,18 | 0,4809 | 0,4809 | |
| 0,09 | 1,11 | 0,4530 | 0,4530 | |
| 0,13 | 1,01 | 0,4142 | 0,4142 | |
| 0,25 | 1,01 | 0,4125 | 0,4125 | |
| 0,01 | 0,98 | 0,3999 | 0,3999 | |
| 0,02 | 0,96 | 0,3916 | 0,3916 | |
| 0,61 | 3,61 | 1,4747 | 0,2759 |
Principales baisses ce trimestre
Nous utilisons la variation de l'allocation du portefeuille car il s'agit de l'indicateur le plus significatif. Les changements peuvent être dus à des transactions ou à des variations de prix des actions.
| Titre | Actions (en millions) |
Valeur ($ en millions) |
% du portefeuille | ΔPortefeuille % |
|---|---|---|---|---|
| 0,27 | 1,48 | 0,6025 | -34,4619 | |
| 0,27 | 1,57 | 0,6428 | -32,3480 | |
| 0,05 | 9,58 | 3,9102 | -0,6597 | |
| 0,00 | 0,00 | -0,5869 | ||
| 0,11 | 0,61 | 0,2479 | -0,5271 | |
| 0,20 | 0,66 | 0,2712 | -0,4625 | |
| 0,10 | 2,54 | 1,0369 | -0,4536 | |
| 0,05 | 5,27 | 2,1513 | -0,3623 | |
| 0,02 | 3,56 | 1,4539 | -0,3219 | |
| 0,10 | 9,18 | 3,7497 | -0,3035 |
Déclarations 13D/G
Il s'agit d'une liste des déclarations 13D et 13G déposées au cours de la dernière année (le cas échéant). Cliquez sur l'icône du lien pour voir l'historique complet des transactions. Les lignes vertes indiquent de nouvelles positions. Les lignes rouges indiquent des positions fermées.
| Date de dépôt | Formulaire | Titre | Actions précédentes |
Actions actuelles |
ΔActions % | % de participation |
% ΔParticipation | |
|---|---|---|---|---|---|---|---|---|
| 2025-07-07 | LPRO / Open Lending Corporation | 6 949 166 | 4 172 500 | -39,96 | 3,50 | -39,66 |
Déclarations 13F et dépôts de fonds
Ce formulaire a été déposé le 2025-08-05 pour la période de déclaration 2025-06-30. Cliquez sur l'icône du lien pour voir l'historique complet des transactions.
Mettre à niveau pour débloquer les données premium et exporter vers Excel ![]() .
.
| Titre | Type | Prix moyen de l'action | Actions (en millions) |
ΔActions (%) |
ΔActions (%) |
Valeur ($ en millions) |
Portefeuille (%) |
ΔPortefeuille (%) |
|
|---|---|---|---|---|---|---|---|---|---|
| LPRO / Open Lending Corporation | 5,90 | 439,96 | 11,45 | 279,64 | 4,6743 | 3,3430 | |||
| AAPL / Apple Inc. | 0,05 | 0,14 | 9,58 | -7,51 | 3,9102 | -0,6597 | |||
| BIL / SPDR Series Trust - SPDR Bloomberg 1-3 Month T-Bill ETF | 0,10 | 0,00 | 9,18 | 0,00 | 3,7497 | -0,3035 | |||
| AVGO / Broadcom Inc. | 0,03 | -11,05 | 9,07 | 46,44 | 3,7049 | 0,9702 | |||
| MSFT / Microsoft Corporation | 0,02 | 1,47 | 8,29 | 34,45 | 3,3854 | 0,6636 | |||
| GOOG / Alphabet Inc. | 0,03 | -5,20 | 6,18 | 7,65 | 2,5242 | -0,0107 | |||
| SRLN / SSGA Active Trust - SPDR Blackstone Senior Loan ETF | 0,15 | 11,99 | 6,15 | 13,23 | 2,5126 | 0,1143 | |||
| XOM / Exxon Mobil Corporation | 0,05 | 2,07 | 5,27 | -7,50 | 2,1513 | -0,3623 | |||
| SLND / Southland Holdings, Inc. | 1,12 | -10,61 | 4,71 | 20,60 | 1,9246 | 0,1998 | |||
| HYG / iShares Trust - iShares iBoxx $ High Yield Corporate Bond ETF | 0,05 | 0,91 | 4,42 | 3,13 | 1,8046 | -0,0868 | |||
| SHEL / Shell plc - Depositary Receipt (Common Stock) | 0,06 | 1,15 | 4,32 | -2,82 | 1,7624 | -0,1978 | |||
| BHP / BHP Group Limited - Depositary Receipt (Common Stock) | 0,09 | 0,29 | 4,09 | -0,66 | 1,6719 | -0,1470 | |||
| AMZN / Amazon.com, Inc. | 0,02 | 0,87 | 3,97 | 16,30 | 1,6199 | 0,1145 | |||
| US538146AD33 / LivePerson, Inc. | 3,79 | 0,64 | 1,5497 | -0,1146 | |||||
| CNNE / Cannae Holdings, Inc. | 0,18 | 1,71 | 3,71 | 15,72 | 1,5155 | 0,0995 | |||
| ASPN / Aspen Aerogels, Inc. | 0,61 | 43,53 | 3,61 | 33,00 | 1,4747 | 0,2759 | |||
| PEB / Pebblebrook Hotel Trust | 0,36 | 19,74 | 3,59 | 18,07 | 1,4654 | 0,1240 | |||
| ABBV / AbbVie Inc. | 0,02 | -0,10 | 3,56 | -11,49 | 1,4539 | -0,3219 | |||
| NEA / Nuveen AMT-Free Quality Municipal Income Fund | 0,32 | 11,96 | 3,46 | 9,17 | 1,4143 | 0,0139 | |||
| BAND / Bandwidth Inc. | 0,21 | -2,37 | 3,41 | 18,46 | 1,3946 | 0,1224 | |||
| FLYW / Flywire Corporation | 0,28 | -15,02 | 3,31 | 4,68 | 1,3522 | -0,0443 | |||
| IIIV / i3 Verticals, Inc. | 0,12 | -7,69 | 3,30 | 2,81 | 1,3467 | -0,0690 | |||
| NAD / Nuveen Quality Municipal Income Fund | 0,26 | 12,50 | 2,98 | 10,26 | 1,2162 | 0,0238 | |||
| ALIT / Alight, Inc. | 0,49 | 4,04 | 2,77 | -0,72 | 1,1303 | -0,1000 | |||
| HCAT / Health Catalyst, Inc. | 0,73 | 12,32 | 2,75 | -6,52 | 1,1240 | -0,1757 | |||
| NVG / Nuveen AMT-Free Municipal Credit Income Fund | 0,22 | 4,81 | 2,68 | 1,02 | 1,0925 | -0,0767 | |||
| VCLT / Vanguard Scottsdale Funds - Vanguard Long-Term Corporate Bond ETF | 0,03 | -3,20 | 2,62 | -3,25 | 1,0700 | -0,1258 | |||
| VRRM / Verra Mobility Corporation | 0,10 | -33,33 | 2,54 | -24,79 | 1,0369 | -0,4536 | |||
| ARCC / Ares Capital Corporation | 0,11 | 1,27 | 2,37 | 0,38 | 0,9696 | -0,0747 | |||
| BAC / Bank of America Corporation | 0,05 | 0,07 | 2,33 | 13,45 | 0,9510 | 0,0451 | |||
| EB / Eventbrite, Inc. | 0,83 | -5,52 | 2,17 | 17,77 | 0,8879 | 0,0729 | |||
| TAP / Molson Coors Beverage Company | 0,04 | 6,83 | 2,14 | -15,59 | 0,8757 | -0,2459 | |||
| AMGN / Amgen Inc. | 0,01 | -0,21 | 2,10 | -10,55 | 0,8588 | -0,1792 | |||
| OBDC / Blue Owl Capital Corporation | 0,14 | 0,25 | 1,99 | -1,97 | 0,8135 | -0,0832 | |||
| PG / The Procter & Gamble Company | 0,01 | 5,08 | 1,93 | -1,78 | 0,7889 | -0,0792 | |||
| JPM / JPMorgan Chase & Co. | 0,01 | 0,00 | 1,92 | 18,23 | 0,7842 | 0,0670 | |||
| DOMO / Domo, Inc. | 0,14 | -51,79 | 1,89 | -13,21 | 0,7702 | -0,1890 | |||
| LSPD / Lightspeed Commerce Inc. | 0,16 | -33,33 | 1,87 | -10,81 | 0,7651 | -0,1619 | |||
| CMCO / Columbus McKinnon Corporation | 0,12 | 0,00 | 1,86 | -9,82 | 0,7582 | -0,1505 | |||
| SAP / SAP SE - Depositary Receipt (Common Stock) | 0,01 | 0,84 | 1,83 | 14,25 | 0,7467 | 0,0401 | |||
| LBRT / Liberty Energy Inc. | 0,15 | 29,71 | 1,72 | -5,90 | 0,7032 | -0,1049 | |||
| FOR / Forestar Group Inc. | 0,08 | 30,17 | 1,69 | 23,14 | 0,6911 | 0,0845 | |||
| AESI / Atlas Energy Solutions Inc. | 0,13 | 32,95 | 1,69 | -0,35 | 0,6896 | -0,0585 | |||
| MQ / Marqeta, Inc. | 0,27 | -28,95 | 1,57 | 0,58 | 0,6428 | -32,3480 | |||
| BMY / Bristol-Myers Squibb Company | 0,03 | 0,38 | 1,55 | -23,84 | 0,6317 | -0,2646 | |||
| LADR / Ladder Capital Corp | 0,14 | 3,38 | 1,53 | -2,61 | 0,6246 | -0,0686 | |||
| BC / Brunswick Corporation | 0,03 | 9,10 | 1,52 | 11,90 | 0,6221 | 0,0212 | |||
| ONTF / ON24, Inc. | 0,27 | -15,10 | 1,48 | -11,36 | 0,6025 | -34,4619 | |||
| CSCO / Cisco Systems, Inc. | 0,02 | -5,03 | 1,44 | 6,82 | 0,5886 | -0,0073 | |||
| VICI / VICI Properties Inc. | 0,04 | 0,00 | 1,43 | -0,07 | 0,5844 | -0,0477 | |||
| SPG / Simon Property Group, Inc. | 0,01 | 0,10 | 1,42 | -3,15 | 0,5782 | -0,0668 | |||
| FDUS / Fidus Investment Corporation | 0,07 | 2,65 | 1,40 | 1,68 | 0,5700 | -0,0359 | |||
| CRK / Comstock Resources, Inc. | Call | 0,05 | 0,00 | 1,38 | 35,99 | 0,5650 | 0,1161 | ||
| EXFY / Expensify, Inc. | 0,50 | 23,97 | 1,30 | 5,61 | 0,5303 | -0,0124 | |||
| SLB / Schlumberger Limited | 0,04 | 4,50 | 1,29 | -15,50 | 0,5279 | -0,1474 | |||
| FNF / Fidelity National Financial, Inc. | 0,02 | -0,34 | 1,27 | -14,16 | 0,5201 | -0,1348 | |||
| NMZ / Nuveen Municipal High Income Opportunity Fund | 0,12 | 3,15 | 1,27 | -1,93 | 0,5196 | -0,0532 | |||
| ARI / Apollo Commercial Real Estate Finance, Inc. | 0,13 | 0,01 | 1,24 | 1,14 | 0,5054 | -0,0346 | |||
| DIS / The Walt Disney Company | 0,01 | 3,32 | 1,24 | 29,83 | 0,5049 | 0,0845 | |||
| GSAT / Globalstar, Inc. | 0,05 | 1,18 | 0,4809 | 0,4809 | |||||
| ABR / Arbor Realty Trust, Inc. | 0,11 | 2,51 | 1,17 | -6,69 | 0,4788 | -0,0756 | |||
| PSEC / Prospect Capital Corporation | 0,37 | 0,64 | 1,17 | -21,93 | 0,4771 | -0,1836 | |||
| PDO / Pimco Dynamic Income Opportunities Fund | 0,09 | -1,38 | 1,16 | -4,21 | 0,4736 | -0,0609 | |||
| SAR / Saratoga Investment Corp. | 0,05 | 0,00 | 1,16 | -2,12 | 0,4728 | -0,0492 | |||
| CMBS / iShares Trust - iShares CMBS ETF | 0,02 | -0,74 | 1,15 | 0,70 | 0,4706 | -0,0345 | |||
| SPY / SPDR S&P 500 ETF | 0,00 | 0,00 | 1,12 | 10,46 | 0,4572 | 0,0098 | |||
| GPN / Global Payments Inc. | 0,01 | 7,75 | 1,11 | -11,96 | 0,4545 | -0,1033 | |||
| TRIP / Tripadvisor, Inc. | 0,09 | 1,11 | 0,4530 | 0,4530 | |||||
| BHR.PRB / Braemar Hotels & Resorts Inc. - Preferred Stock | 0,08 | 16,58 | 1,09 | 18,11 | 0,4449 | 0,0377 | |||
| CBRL / Cracker Barrel Old Country Store, Inc. | Call | 0,02 | 0,00 | 1,07 | 57,29 | 0,4365 | 0,1366 | ||
| HON / Honeywell International Inc. | 0,00 | 0,16 | 1,05 | 10,17 | 0,4295 | 0,0080 | |||
| DHI / D.R. Horton, Inc. | 0,01 | 0,14 | 1,03 | 1,48 | 0,4202 | -0,0271 | |||
| FCX / Freeport-McMoRan Inc. | 0,02 | 0,43 | 1,03 | 15,02 | 0,4190 | 0,0252 | |||
| MODG / Topgolf Callaway Brands Corp. | 0,13 | 1,01 | 0,4142 | 0,4142 | |||||
| VMEO / Vimeo, Inc. | 0,25 | 1,01 | 0,4125 | 0,4125 | |||||
| TXN / Texas Instruments Incorporated | 0,00 | 6,16 | 0,98 | 22,65 | 0,4005 | 0,0475 | |||
| NET / Cloudflare, Inc. | Call | 0,01 | 0,98 | 0,3999 | 0,3999 | ||||
| STWD / Starwood Property Trust, Inc. | 0,05 | 3,88 | 0,97 | 5,46 | 0,3946 | -0,0099 | |||
| OKE / ONEOK, Inc. | 0,01 | 0,00 | 0,96 | -17,68 | 0,3917 | -0,1229 | |||
| TPC / Tutor Perini Corporation | Call | 0,02 | 0,96 | 0,3916 | 0,3916 | ||||
| ADBE / Adobe Inc. | 0,00 | -12,54 | 0,94 | -11,78 | 0,3858 | -0,0869 | |||
| VZ / Verizon Communications Inc. | 0,02 | 3,89 | 0,94 | -0,95 | 0,3826 | -0,0347 | |||
| BILL / BILL Holdings, Inc. | 0,02 | 0,00 | 0,93 | 0,87 | 0,3778 | -0,0273 | |||
| PANW / Palo Alto Networks, Inc. | 0,00 | 0,00 | 0,92 | 19,95 | 0,3761 | 0,0371 | |||
| SMWB / Similarweb Ltd. | 0,12 | 12,45 | 0,92 | 6,60 | 0,3759 | -0,0053 | |||
| V / Visa Inc. | 0,00 | -7,64 | 0,86 | -6,43 | 0,3504 | -0,0544 | |||
| HD / The Home Depot, Inc. | 0,00 | 0,17 | 0,84 | 0,24 | 0,3445 | -0,0271 | |||
| JPC / Nuveen Preferred & Income Opportunities Fund | 0,10 | -0,98 | 0,80 | -0,25 | 0,3286 | -0,0274 | |||
| AXP / American Express Company | 0,00 | 0,00 | 0,80 | 18,55 | 0,3264 | 0,0288 | |||
| NEE / NextEra Energy, Inc. | 0,01 | 4,02 | 0,80 | 1,92 | 0,3251 | -0,0199 | |||
| SBUX / Starbucks Corporation | 0,01 | 0,00 | 0,78 | -6,61 | 0,3174 | -0,0499 | |||
| UNP / Union Pacific Corporation | 0,00 | 0,18 | 0,76 | -2,44 | 0,3103 | -0,0335 | |||
| CSQ / Calamos Strategic Total Return Fund | 0,04 | 0,00 | 0,71 | 12,76 | 0,2890 | 0,0119 | |||
| VBTX / Veritex Holdings, Inc. | 0,03 | 0,00 | 0,70 | 4,45 | 0,2878 | -0,0098 | |||
| NFE / New Fortress Energy Inc. | Call | 0,20 | 0,00 | 0,66 | -60,05 | 0,2712 | -0,4625 | ||
| KHC / The Kraft Heinz Company | 0,03 | 5,14 | 0,66 | -10,76 | 0,2678 | -0,0567 | |||
| DUK / Duke Energy Corporation | 0,01 | 0,00 | 0,65 | -3,26 | 0,2668 | -0,0313 | |||
| PFF / iShares Trust - iShares Preferred and Income Securities ETF | 0,02 | 0,00 | 0,63 | -0,16 | 0,2561 | -0,0212 | |||
| KVHI / KVH Industries, Inc. | 0,11 | -65,69 | 0,61 | -65,47 | 0,2479 | -0,5271 | |||
| EOG / EOG Resources, Inc. | 0,00 | 3,31 | 0,59 | -3,57 | 0,2427 | -0,0296 | |||
| CPRT / Copart, Inc. | 0,01 | 0,00 | 0,59 | -13,40 | 0,2405 | -0,0593 | |||
| IREN / IREN Limited | Call | 0,04 | 0,58 | 0,2380 | 0,2380 | ||||
| CAT / Caterpillar Inc. | 0,00 | 38,52 | 0,55 | 63,17 | 0,2229 | 0,0751 | |||
| VRSK / Verisk Analytics, Inc. | 0,00 | 0,00 | 0,54 | 4,70 | 0,2187 | -0,0072 | |||
| RITM / Rithm Capital Corp. | 0,05 | 0,00 | 0,51 | -1,35 | 0,2084 | -0,0201 | |||
| BDJ / BlackRock Enhanced Equity Dividend Trust | 0,06 | 0,00 | 0,51 | 3,27 | 0,2069 | -0,0095 | |||
| NZF / Nuveen Municipal Credit Income Fund | 0,04 | 0,00 | 0,50 | -2,55 | 0,2030 | -0,0221 | |||
| ETG / Eaton Vance Tax-Advantaged Global Dividend Income Fund | 0,02 | 0,00 | 0,49 | 14,95 | 0,2010 | 0,0120 | |||
| GOOGL / Alphabet Inc. | 0,00 | 0,00 | 0,46 | 14,07 | 0,1889 | 0,0097 | |||
| STRL / Sterling Infrastructure, Inc. | Call | 0,00 | 0,46 | 0,1884 | 0,1884 | ||||
| SPOT / Spotify Technology S.A. | 0,00 | 0,00 | 0,46 | 39,39 | 0,1880 | 0,0423 | |||
| JOBY / Joby Aviation, Inc. | 0,04 | 0,00 | 0,46 | 75,48 | 0,1874 | 0,0718 | |||
| DOCU / DocuSign, Inc. | 0,01 | 4,58 | 0,44 | 0,00 | 0,1809 | -0,0145 | |||
| SYK / Stryker Corporation | 0,00 | 4,50 | 0,44 | 11,08 | 0,1801 | 0,0048 | |||
| ORCL / Oracle Corporation | 0,00 | 0,00 | 0,44 | 56,63 | 0,1786 | 0,0551 | |||
| DFP / Flaherty & Crumrine Dynamic Preferred and Income Fund Inc. | 0,02 | 0,00 | 0,42 | 1,45 | 0,1719 | -0,0113 | |||
| DMB / BNY Mellon Municipal Bond Infrastructure Fund, Inc. | 0,04 | 0,00 | 0,41 | -3,29 | 0,1680 | -0,0198 | |||
| TYL / Tyler Technologies, Inc. | 0,00 | 4,59 | 0,41 | 6,58 | 0,1656 | -0,0022 | |||
| EAF / GrafTech International Ltd. | 0,41 | 0,00 | 0,40 | 11,17 | 0,1628 | 0,0046 | |||
| MHD / BlackRock MuniHoldings Fund, Inc. | 0,03 | -8,52 | 0,39 | -12,58 | 0,1589 | -0,0379 | |||
| VNO / Vornado Realty Trust | Call | 0,01 | 0,38 | 0,1562 | 0,1562 | ||||
| LOB / Live Oak Bancshares, Inc. | 0,01 | 0,37 | 0,1521 | 0,1521 | |||||
| QBTS / D-Wave Quantum Inc. | Call | 0,03 | 0,37 | 0,1495 | 0,1495 | ||||
| MRK / Merck & Co., Inc. | 0,00 | 7,55 | 0,36 | -5,25 | 0,1478 | -0,0206 | |||
| RF / Regions Financial Corporation | 0,01 | 0,00 | 0,35 | 8,31 | 0,1441 | 0,0002 | |||
| XPRO / Expro Group Holdings N.V. | 0,00 | 4,67 | 0,35 | -18,37 | 0,1436 | -0,0463 | |||
| ZBRA / Zebra Technologies Corporation | 0,00 | 8,55 | 0,33 | 18,57 | 0,1359 | 0,0119 | |||
| DLB / Dolby Laboratories, Inc. | 0,00 | 5,95 | 0,33 | -1,81 | 0,1328 | -0,0137 | |||
| BTZ / BlackRock Credit Allocation Income Trust | 0,03 | -5,53 | 0,32 | -3,90 | 0,1310 | -0,0161 | |||
| EFX / Equifax Inc. | 0,00 | 6,79 | 0,32 | 13,98 | 0,1300 | 0,0064 | |||
| NBB / Nuveen Taxable Municipal Income Fund | 0,02 | 0,00 | 0,32 | -1,25 | 0,1292 | -0,0122 | |||
| BTA / BlackRock Long-Term Municipal Advantage Trust | 0,03 | -5,55 | 0,31 | -10,60 | 0,1274 | -0,0267 | |||
| MA / Mastercard Incorporated | 0,00 | 6,19 | 0,31 | 8,83 | 0,1260 | 0,0009 | |||
| FIS / Fidelity National Information Services, Inc. | 0,00 | 7,20 | 0,31 | 16,79 | 0,1253 | 0,0094 | |||
| XLK / The Select Sector SPDR Trust - The Technology Select Sector SPDR Fund | 0,00 | 0,00 | 0,30 | 22,86 | 0,1231 | 0,0146 | |||
| BXMX / Nuveen S&P 500 Buy-Write Income Fund | 0,02 | -2,29 | 0,30 | 3,50 | 0,1211 | -0,0055 | |||
| CODI / Compass Diversified | 0,04 | 0,28 | 0,1154 | 0,1154 | |||||
| CMG / Chipotle Mexican Grill, Inc. | 0,01 | 0,00 | 0,28 | 11,55 | 0,1147 | 0,0038 | |||
| QTEC / First Trust Exchange-Traded Fund - First Trust NASDAQ-100-Technology Sector Index Fund | 0,00 | 0,00 | 0,27 | 22,62 | 0,1110 | 0,0132 | |||
| DSM / BNY Mellon Strategic Municipal Bond Fund, Inc. | 0,05 | 0,00 | 0,27 | -2,87 | 0,1109 | -0,0126 | |||
| NFLX / Netflix, Inc. | 0,00 | 0,27 | 0,1094 | 0,1094 | |||||
| CZR / Caesars Entertainment, Inc. | 0,01 | 11,61 | 0,26 | 26,92 | 0,1079 | 0,0159 | |||
| JNJ / Johnson & Johnson | 0,00 | 0,00 | 0,26 | -7,91 | 0,1047 | -0,0182 | |||
| BP / BP p.l.c. - Depositary Receipt (Common Stock) | 0,01 | 10,01 | 0,26 | -2,29 | 0,1046 | -0,0114 | |||
| APLD / Applied Digital Corporation | Call | 0,03 | 0,25 | 0,1028 | 0,1028 | ||||
| NSC / Norfolk Southern Corporation | 0,00 | 0,00 | 0,23 | 7,98 | 0,0941 | -0,0000 | |||
| PLD / Prologis, Inc. | 0,00 | 4,72 | 0,22 | -1,76 | 0,0914 | -0,0089 | |||
| EXP / Eagle Materials Inc. | 0,00 | 0,00 | 0,22 | -9,02 | 0,0908 | -0,0170 | |||
| COST / Costco Wholesale Corporation | 0,00 | 0,00 | 0,22 | 4,76 | 0,0902 | -0,0029 | |||
| CPAY / Corpay, Inc. | 0,00 | 9,20 | 0,22 | 3,77 | 0,0901 | -0,0036 | |||
| LVS / Las Vegas Sands Corp. | 0,01 | 0,22 | 0,0888 | 0,0888 | |||||
| DD / DuPont de Nemours, Inc. | 0,00 | 0,00 | 0,20 | -8,14 | 0,0830 | -0,0147 | |||
| GPMT / Granite Point Mortgage Trust Inc. | 0,08 | 0,00 | 0,20 | -4,88 | 0,0797 | -0,0110 | |||
| BFK / BlackRock Municipal Income Trust | 0,02 | 0,00 | 0,19 | -3,54 | 0,0783 | -0,0091 | |||
| MUE / BlackRock MuniHoldings Quality Fund II, Inc. | 0,02 | 0,00 | 0,18 | -4,21 | 0,0743 | -0,0095 | |||
| BBN / BlackRock Taxable Municipal Bond Trust | 0,01 | 0,00 | 0,17 | -3,43 | 0,0691 | -0,0082 | |||
| BLE / BlackRock Municipal Income Trust II | 0,01 | 0,00 | 0,15 | -3,23 | 0,0615 | -0,0073 | |||
| MQY / BlackRock MuniYield Quality Fund, Inc. | 0,01 | -32,92 | 0,14 | -36,49 | 0,0578 | -0,0404 | |||
| MVF / BlackRock MuniVest Fund, Inc. | 0,02 | 0,00 | 0,13 | -6,43 | 0,0537 | -0,0081 | |||
| PML / PIMCO Municipal Income Fund II | 0,02 | -23,01 | 0,13 | -29,51 | 0,0529 | -0,0279 | |||
| CHI / Calamos Convertible Opportunities and Income Fund | 0,01 | 0,00 | 0,13 | 9,57 | 0,0516 | 0,0008 | |||
| ORN / Orion Group Holdings, Inc. | Call | 0,01 | 0,09 | 0,0370 | 0,0370 | ||||
| CHW / Calamos Global Dynamic Income Fund | 0,01 | 0,00 | 0,08 | 11,43 | 0,0320 | 0,0010 | |||
| WTTR / Select Water Solutions, Inc. | 0,00 | -100,00 | 0,00 | 0,0000 | |||||
| DMF / BNY Mellon Municipal Income, Inc. | 0,00 | -100,00 | 0,00 | 0,0000 | |||||
| LYB / LyondellBasell Industries N.V. | 0,00 | -100,00 | 0,00 | 0,0000 | |||||
| PMF / PIMCO Municipal Income Fund | 0,00 | -100,00 | 0,00 | 0,0000 | |||||
| LZ / LegalZoom.com, Inc. | 0,00 | -100,00 | 0,00 | 0,0000 | |||||
| IVAC / Intevac, Inc. | 0,00 | -100,00 | 0,00 | 0,0000 | |||||
| TTD / The Trade Desk, Inc. | 0,00 | -100,00 | 0,00 | -100,00 | -0,2415 | ||||
| NFE / New Fortress Energy Inc. | 0,00 | -100,00 | 0,00 | -100,00 | -0,5869 | ||||
| MPW / Medical Properties Trust, Inc. | Call | 0,00 | -100,00 | 0,00 | 0,0000 | ||||
| HIMS / Hims & Hers Health, Inc. | Call | 0,00 | -100,00 | 0,00 | 0,0000 | ||||
| PFE / Pfizer Inc. | 0,00 | -100,00 | 0,00 | 0,0000 |