Statistiques de base
| Profil de l'initié | Hartree Partners, LP |
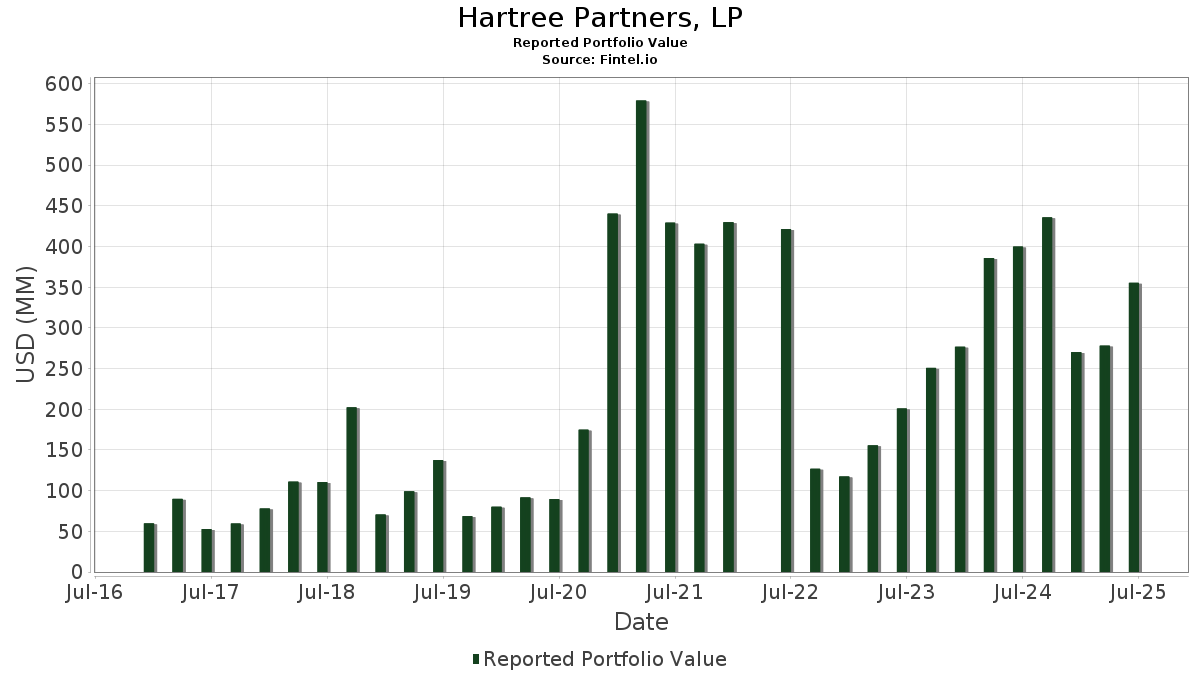
| Valeur du portefeuille | $ 355 445 360 |
| Positions actuelles | 67 |
Dernières positions, performances, ASG (à partir des dépôts 13F, 13D)
Hartree Partners, LP a déclaré un total de 67 positions dans ses derniers dépôts auprès de la SEC. La valeur la plus récente du portefeuille est calculée à 355 445 360 USD. Les actifs sous gestion réels (ASG) sont cette valeur plus les liquidités (qui ne sont pas divulguées). Les principales positions de Hartree Partners, LP sont Star Group, L.P. - Limited Partnership (US:SGU) , Hudson Technologies, Inc. (US:HDSN) , Global Partners LP - Limited Partnership (US:GLP) , Teekay Tankers Ltd. (US:TNK) , and JBS N.V. (US:JBS) . Les nouvelles positions de Hartree Partners, LP incluent JBS N.V. (US:JBS) , Loews Corporation (US:L) , Pembina Pipeline Corporation (CA:PPL) , Archer-Daniels-Midland Company (US:ADM) , and Helix Energy Solutions Group, Inc. (US:HLX) . Les principales industries de Hartree Partners, LP sont "Transportation Equipment" (sic 37) , "Communications" (sic 48) , and "Insurance Carriers" (sic 63) .
Meilleures augmentations ce trimestre
Nous utilisons la variation de l'allocation du portefeuille car il s'agit de l'indicateur le plus significatif. Les changements peuvent être dus à des transactions ou à des variations de prix des actions.
| Titre | Actions (en millions) |
Valeur ($ en millions) |
% du portefeuille | ΔPortefeuille % |
|---|---|---|---|---|
| 1,52 | 22,25 | 6,2599 | 6,2599 | |
| 0,54 | 22,53 | 6,2538 | 6,2538 | |
| 0,56 | 21,30 | 5,9929 | 5,6560 | |
| 0,15 | 14,15 | 3,9803 | 3,9803 | |
| 0,27 | 8,90 | 2,4715 | 2,4715 | |
| 0,53 | 7,77 | 2,1585 | 2,1585 | |
| 0,15 | 5,64 | 1,5854 | 1,5854 | |
| 0,03 | 5,65 | 1,5683 | 1,5683 | |
| 0,20 | 9,48 | 2,6312 | 1,2104 | |
| 0,02 | 4,01 | 1,1138 | 1,1138 |
Principales baisses ce trimestre
Nous utilisons la variation de l'allocation du portefeuille car il s'agit de l'indicateur le plus significatif. Les changements peuvent être dus à des transactions ou à des variations de prix des actions.
| Titre | Actions (en millions) |
Valeur ($ en millions) |
% du portefeuille | ΔPortefeuille % |
|---|---|---|---|---|
| 3,40 | 39,79 | 11,0473 | -4,6573 | |
| 0,72 | 11,83 | 3,2853 | -4,5699 | |
| 7,29 | 6,09 | 1,6898 | -2,6041 | |
| 0,51 | 26,79 | 7,4382 | -2,3115 | |
| 0,16 | 6,23 | 1,7284 | -2,0257 | |
| 0,32 | 8,24 | 2,2869 | -1,0849 | |
| 0,30 | 7,88 | 2,1886 | -0,5076 | |
| 0,92 | 2,30 | 0,6388 | -0,4272 | |
| 0,40 | 0,47 | 0,1302 | -0,4086 | |
| 0,16 | 19,23 | 5,3398 | -0,2196 |
Déclarations 13D/G
Il s'agit d'une liste des déclarations 13D et 13G déposées au cours de la dernière année (le cas échéant). Cliquez sur l'icône du lien pour voir l'historique complet des transactions. Les lignes vertes indiquent de nouvelles positions. Les lignes rouges indiquent des positions fermées.
| Date de dépôt | Formulaire | Titre | Actions précédentes |
Actions actuelles |
ΔActions % | % de participation |
% ΔParticipation | |
|---|---|---|---|---|---|---|---|---|
| 2025-05-14 | HDSN / Hudson Technologies, Inc. | 3 000 000 | 4 000 000 | 33,33 | 9,10 | 33,82 | ||
| 2025-05-14 | SGU / Star Group, L.P. - Limited Partnership | 3 123 253 | 3 400 907 | 8,89 | 9,80 | 11,62 |
Déclarations 13F et dépôts de fonds
Ce formulaire a été déposé le 2025-08-13 pour la période de déclaration 2025-06-30. Cliquez sur l'icône du lien pour voir l'historique complet des transactions.
Mettre à niveau pour débloquer les données premium et exporter vers Excel ![]() .
.
| Titre | Type | Prix moyen de l'action | Actions (en millions) |
ΔActions (%) |
ΔActions (%) |
Valeur ($ en millions) |
Portefeuille (%) |
ΔPortefeuille (%) |
|
|---|---|---|---|---|---|---|---|---|---|
| SGU / Star Group, L.P. - Limited Partnership | 3,40 | 2,60 | 39,79 | -8,92 | 11,0473 | -4,6573 | |||
| HDSN / Hudson Technologies, Inc. | 4,00 | 11,95 | 32,48 | 47,33 | 9,0176 | 1,0923 | |||
| GLP / Global Partners LP - Limited Partnership | 0,51 | 0,00 | 26,79 | -1,22 | 7,4382 | -2,3115 | |||
| TNK / Teekay Tankers Ltd. | 0,54 | 22,53 | 6,2538 | 6,2538 | |||||
| JBS / JBS N.V. | 1,52 | 22,25 | 6,2599 | 6,2599 | |||||
| DAR / Darling Ingredients Inc. | 0,56 | 1 771,51 | 21,30 | 2 173,32 | 5,9929 | 5,6560 | |||
| EXE / Expand Energy Corporation | 0,16 | 18,39 | 19,23 | 24,37 | 5,3398 | -0,2196 | |||
| L / Loews Corporation | 0,15 | 14,15 | 3,9803 | 3,9803 | |||||
| EQT / EQT Corporation | 0,24 | 15,68 | 13,81 | 26,26 | 3,8335 | -0,0977 | |||
| FRO / Frontline plc | 0,72 | -51,02 | 11,83 | -45,85 | 3,2853 | -4,5699 | |||
| PDS / Precision Drilling Corporation | 0,20 | 135,29 | 9,48 | 139,80 | 2,6312 | 1,2104 | |||
| MEOH / Methanex Corporation | 0,27 | 8,90 | 2,4715 | 2,4715 | |||||
| HCC / Warrior Met Coal, Inc. | 0,19 | 50,30 | 8,69 | 44,35 | 2,4137 | 0,2486 | |||
| CTRA / Coterra Energy Inc. | 0,32 | 0,00 | 8,24 | -12,18 | 2,2869 | -1,0849 | |||
| SDRL / Seadrill Limited | 0,30 | 0,10 | 7,88 | 5,09 | 2,1886 | -0,5076 | |||
| OI / O-I Glass, Inc. | 0,53 | 7,77 | 2,1585 | 2,1585 | |||||
| CCJ / Cameco Corporation | 0,10 | -20,71 | 7,15 | 42,99 | 1,9840 | 0,1875 | |||
| OVV / Ovintiv Inc. | 0,16 | -32,94 | 6,23 | -40,38 | 1,7284 | -2,0257 | |||
| US53680QAA67 / LITHIUM AMERICAS CORP SR UNSECURED 01/27 1.75 | 7,29 | -49,69 | 6,09 | -49,05 | 1,6898 | -2,6041 | |||
| TECK / Teck Resources Limited | 0,15 | 53,93 | 5,92 | 70,65 | 1,6432 | 0,3962 | |||
| KOSMOS ENERGY LTD / NOTE 3.125% 3/1 (500688AH9) | 8,00 | 5,70 | 0,0000 | ||||||
| TRGP / Targa Resources Corp. | 0,03 | 5,65 | 1,5683 | 1,5683 | |||||
| PPL / Pembina Pipeline Corporation | 0,15 | 5,64 | 1,5854 | 1,5854 | |||||
| IAG / IAMGOLD Corporation | 0,62 | 38,89 | 4,59 | 63,34 | 1,2754 | 0,2643 | |||
| VST / Vistra Corp. | 0,02 | 4,01 | 1,1138 | 1,1138 | |||||
| CENX / Century Aluminum Company | 0,20 | 3,52 | 0,9767 | 0,9767 | |||||
| NVDA / NVIDIA Corporation | 0,02 | 2,53 | 0,7018 | 0,7018 | |||||
| PURECYCLE TECHNOLOGIES INC / NOTE 7.250% 8/1 (74623VAB9) | 2,00 | 2,47 | 0,0000 | ||||||
| SHMD / SCHMID Group N.V. | 0,92 | 0,87 | 2,30 | -22,43 | 0,6388 | -0,4272 | |||
| EQX / Equinox Gold Corp. | 0,32 | 114,83 | 1,85 | 79,46 | 0,5144 | 0,1435 | |||
| ADM / Archer-Daniels-Midland Company | 0,03 | 1,32 | 0,3712 | 0,3712 | |||||
| NEM / Newmont Corporation | 0,02 | -9,09 | 1,17 | 9,70 | 0,3235 | -0,0583 | |||
| SHEL / Shell plc - Depositary Receipt (Common Stock) | 0,01 | 1,06 | 0,2932 | 0,2932 | |||||
| FF / FutureFuel Corp. | 0,26 | 0,00 | 1,01 | -0,59 | 0,2801 | -0,0844 | |||
| HLX / Helix Energy Solutions Group, Inc. | 0,15 | 0,94 | 0,2633 | 0,2633 | |||||
| ASPN / Aspen Aerogels, Inc. | 0,15 | 0,00 | 0,89 | -7,31 | 0,2465 | -0,0980 | |||
| NI / NiSource Inc. | 0,02 | 0,81 | 0,2240 | 0,2240 | |||||
| SEADRILL 2021 LTD / CALL (G7997W902) | 0,00 | 0,79 | 0,0000 | ||||||
| GPOR / Gulfport Energy Corporation | 0,00 | 0,66 | 0,1843 | 0,1843 | |||||
| EXK / Endeavour Silver Corp. | 0,13 | 0,00 | 0,62 | 15,49 | 0,1721 | -0,0208 | |||
| CORZ / Core Scientific, Inc. | 0,04 | 0,61 | 0,1729 | 0,1729 | |||||
| AA / Alcoa Corporation | 0,02 | 0,59 | 0,1639 | 0,1639 | |||||
| DAR / Darling Ingredients Inc. | Call | 0,00 | 0,58 | 0,1635 | 0,1635 | ||||
| MTZ / MasTec, Inc. | 0,00 | 0,51 | 0,1438 | 0,1438 | |||||
| UGI / UGI Corporation | 0,01 | 0,51 | 0,1434 | 0,1434 | |||||
| METC / Ramaco Resources, Inc. | 0,04 | 0,50 | 0,1399 | 0,1399 | |||||
| TLN / Talen Energy Corporation | 0,00 | 0,49 | 0,1372 | 0,1372 | |||||
| / CHESAPEAKE ENERGY CORP 0.00000000 | Call | 0,40 | -40,15 | 0,47 | -68,76 | 0,1302 | -0,4086 | ||
| MATX / Matson, Inc. | Call | 0,00 | 0,42 | 0,1196 | 0,1196 | ||||
| DC / Dakota Gold Corp. | 0,10 | 0,37 | 0,1038 | 0,1038 | |||||
| SBSW / Sibanye Stillwater Ltd | Call | 0,01 | 0,33 | 0,0902 | 0,0902 | ||||
| ADM / Archer-Daniels-Midland Company | Call | 0,01 | 0,29 | 0,0809 | 0,0809 | ||||
| VISTRA CORP / CALL (92840M902) | 0,00 | 0,28 | 0,0000 | ||||||
| ALB / Albemarle Corporation | Put | 0,00 | 0,28 | 0,0767 | 0,0767 | ||||
| BKV / BKV Corporation | 0,01 | 0,27 | 0,0746 | 0,0746 | |||||
| SPY / SPDR S&P 500 ETF | 0,00 | -99,17 | 0,24 | -31,71 | 0,0666 | 0,0666 | |||
| SBSW / Sibanye Stillwater Limited - Depositary Receipt (Common Stock) | 0,02 | 0,14 | 0,0401 | 0,0401 | |||||
| PUMP / ProPetro Holding Corp. | 0,02 | 0,13 | 0,0373 | 0,0373 | |||||
| SHMDW / SCHMID Group N.V. - Equity Warrant | 0,38 | -85,00 | 0,11 | -82,05 | 0,0312 | -0,1934 | |||
| BRLSW / Borealis Foods Inc. - Equity Warrant | Call | 1,11 | 35,88 | 0,11 | 37,04 | 0,0309 | 0,0015 | ||
| SLI / Standard Lithium Ltd. | 0,05 | 0,00 | 0,10 | 55,56 | 0,0272 | 0,0044 | |||
| GCLWW / GCL Global Holdings Ltd | Call | 0,33 | 0,00 | 0,03 | 81,25 | 0,0081 | 0,0023 | ||
| EAF / GrafTech International Ltd. | 0,02 | 0,02 | 0,0051 | 0,0051 | |||||
| ABVEW / Above Food Ingredients Inc. - Equity Warrant | Call | 0,31 | 0,00 | 0,02 | 150,00 | 0,0043 | 0,0021 | ||
| MLECW / Moolec Science SA - Equity Warrant | Call | 0,41 | 0,00 | 0,01 | 100,00 | 0,0023 | 0,0008 | ||
| SLXNW / Silexion Therapeutics Corp - Equity Warrant | 0,18 | 0,00 | 0,01 | -50,00 | 0,0020 | -0,0032 | |||
| OUSTZ / Ouster, Inc. - Equity Warrant | Call | 0,10 | 0,00 | 0,00 | -57,14 | 0,0011 | -0,0018 | ||
| PCG / PG&E Corporation | 0,00 | -100,00 | 0,00 | 0,0000 | |||||
| CALM / Cal-Maine Foods, Inc. | 0,00 | -100,00 | 0,00 | 0,0000 | |||||
| VRN / Veren Inc. | 0,00 | -100,00 | 0,00 | 0,0000 | |||||
| CDE / Coeur Mining, Inc. | 0,00 | -100,00 | 0,00 | 0,0000 | |||||
| AEE / Ameren Corporation | 0,00 | -100,00 | 0,00 | 0,0000 | |||||
| FLNG / FLEX LNG Ltd. | 0,00 | -100,00 | 0,00 | 0,0000 | |||||
| X / United States Steel Corporation | 0,00 | -100,00 | 0,00 | 0,0000 | |||||
| BWLLF / BW LPG Limited | 0,00 | -100,00 | 0,00 | 0,0000 | |||||
| AGX / Argan, Inc. | 0,00 | -100,00 | 0,00 | 0,0000 | |||||
| NE / Noble Corporation plc | 0,00 | -100,00 | 0,00 | 0,0000 | |||||
| CENX / Century Aluminum Company | Call | 0,00 | -100,00 | 0,00 | -100,00 | -0,0881 | |||
| SPY / SPDR S&P 500 ETF | 0,00 | -100,00 | 0,00 | -100,00 | -0,1260 | ||||
| GFR / Greenfire Resources Ltd. | 0,00 | -100,00 | 0,00 | 0,0000 | |||||
| HAFNIA LTD / ORD SHS (G4233B109) | 0,00 | -100,00 | 0,00 | 0,0000 | |||||
| SFD / Smithfield Foods, Inc. | 0,00 | -100,00 | 0,00 | 0,0000 | |||||
| CSX / CSX Corporation | 0,00 | -100,00 | 0,00 | 0,0000 | |||||
| UNP / Union Pacific Corporation | 0,00 | -100,00 | 0,00 | 0,0000 |