Statistiques de base
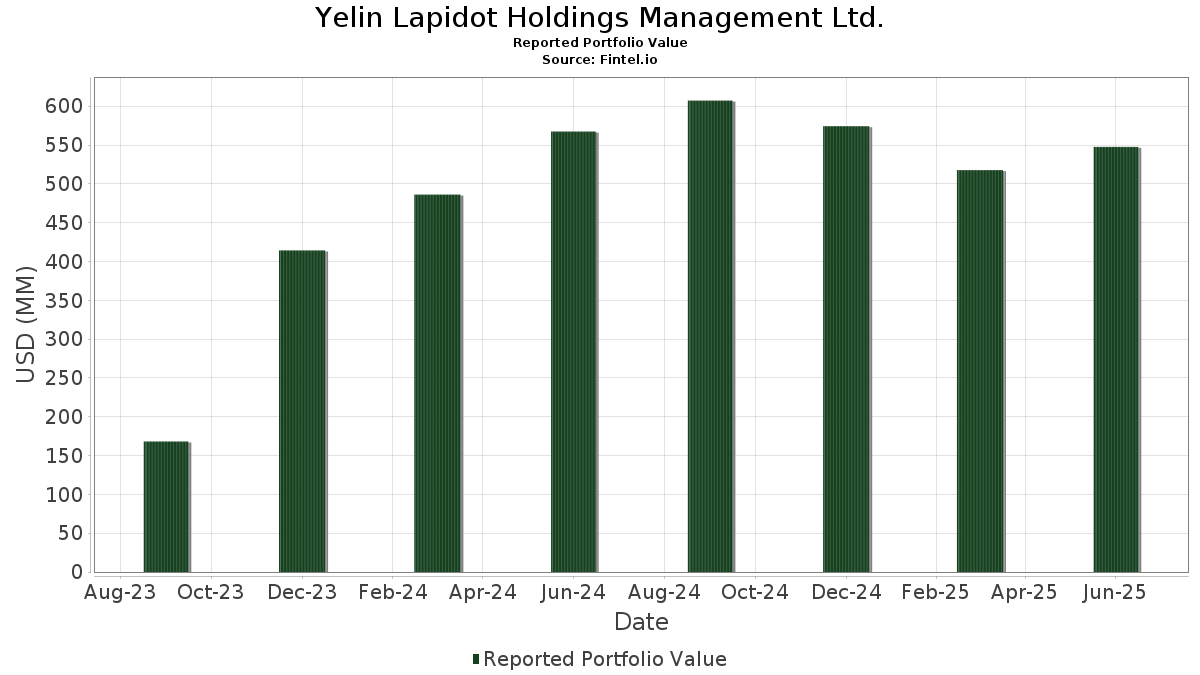
| Valeur du portefeuille | $ 547 600 498 |
| Positions actuelles | 96 |
Dernières positions, performances, ASG (à partir des dépôts 13F, 13D)
Yelin Lapidot Holdings Management Ltd. a déclaré un total de 96 positions dans ses derniers dépôts auprès de la SEC. La valeur la plus récente du portefeuille est calculée à 547 600 498 USD. Les actifs sous gestion réels (ASG) sont cette valeur plus les liquidités (qui ne sont pas divulguées). Les principales positions de Yelin Lapidot Holdings Management Ltd. sont Invesco Exchange-Traded Fund Trust II - Invesco NASDAQ 100 ETF (US:QQQM) , The Select Sector SPDR Trust - The Financial Select Sector SPDR Fund (US:XLF) , SPDR S&P 500 ETF (US:SPY) , Global-E Online Ltd. (US:GLBE) , and Meta Platforms, Inc. (US:META) . Les nouvelles positions de Yelin Lapidot Holdings Management Ltd. incluent GE Vernova Inc. (US:GEV) , New Fortress Energy Inc. (US:NFE) , . Les principales industries de Yelin Lapidot Holdings Management Ltd. sont .
Meilleures augmentations ce trimestre
Nous utilisons la variation de l'allocation du portefeuille car il s'agit de l'indicateur le plus significatif. Les changements peuvent être dus à des transactions ou à des variations de prix des actions.
| Titre | Actions (en millions) |
Valeur ($ en millions) |
% du portefeuille | ΔPortefeuille % |
|---|---|---|---|---|
| 0,77 | 25,93 | 4,7357 | 2,0118 | |
| 0,04 | 21,05 | 3,8437 | 0,7762 | |
| 0,82 | 15,82 | 2,8890 | 0,3168 | |
| 0,08 | 17,84 | 3,2574 | 0,2693 | |
| 0,02 | 4,25 | 0,7760 | 0,2262 | |
| 0,77 | 2,81 | 0,4361 | 0,1364 | |
| 0,03 | 24,29 | 3,7660 | 0,1023 | |
| 0,51 | 6,89 | 1,2581 | 0,0851 | |
| 0,54 | 3,70 | 0,6753 | 0,0845 | |
| 0,20 | 4,52 | 0,7006 | 0,0799 |
Principales baisses ce trimestre
Nous utilisons la variation de l'allocation du portefeuille car il s'agit de l'indicateur le plus significatif. Les changements peuvent être dus à des transactions ou à des variations de prix des actions.
| Titre | Actions (en millions) |
Valeur ($ en millions) |
% du portefeuille | ΔPortefeuille % |
|---|---|---|---|---|
| 0,01 | 1,15 | 0,1784 | -4,7609 | |
| 0,77 | 40,10 | 6,2165 | -1,1513 | |
| 0,08 | 14,81 | 2,2963 | -0,9649 | |
| 0,25 | 6,67 | 1,0333 | -0,9626 | |
| 0,44 | 100,26 | 15,5419 | -0,8478 | |
| 0,07 | 7,86 | 1,2186 | -0,5519 | |
| 0,36 | 13,98 | 2,5529 | -0,4736 | |
| 0,13 | 9,43 | 1,4620 | -0,4604 | |
| 0,10 | 8,67 | 1,3438 | -0,2938 | |
| 0,02 | 12,45 | 1,9294 | -0,2889 |
Déclarations 13D/G
Il s'agit d'une liste des déclarations 13D et 13G déposées au cours de la dernière année (le cas échéant). Cliquez sur l'icône du lien pour voir l'historique complet des transactions. Les lignes vertes indiquent de nouvelles positions. Les lignes rouges indiquent des positions fermées.
| Date de dépôt | Formulaire | Titre | Actions précédentes |
Actions actuelles |
ΔActions % | % de participation |
% ΔParticipation | |
|---|---|---|---|---|---|---|---|---|
| 2025-07-17 | GILT / Gilat Satellite Networks Ltd. | 936 883 | 3 066 826 | 227,34 | 5,38 | 224,10 | ||
| 2025-02-11 | KEN / Kenon Holdings Ltd. | 2 647 519 | 5,05 | |||||
| 2024-11-04 | RDCM / RADCOM Ltd. | 1 286 669 | 803 497 | -37,55 | 5,19 | -39,23 | ||
| 2024-11-04 | TATT / TAT Technologies Ltd. | 704 406 | 422 967 | -39,95 | 4,17 | -40,17 | ||
| 2024-10-01 | MDWD / MediWound Ltd. | 381 968 | 750 743 | 96,55 | 6,96 | 393,62 |
Déclarations 13F et dépôts de fonds
Ce formulaire a été déposé le 2025-08-06 pour la période de déclaration 2025-06-30. Cliquez sur l'icône du lien pour voir l'historique complet des transactions.
Mettre à niveau pour débloquer les données premium et exporter vers Excel ![]() .
.
| Titre | Type | Prix moyen de l'action | Actions (en millions) |
ΔActions (%) |
ΔActions (%) |
Valeur ($ en millions) |
Portefeuille (%) |
ΔPortefeuille (%) |
|
|---|---|---|---|---|---|---|---|---|---|
| QQQM / Invesco Exchange-Traded Fund Trust II - Invesco NASDAQ 100 ETF | 0,44 | 0,43 | 100,26 | 18,17 | 15,5419 | -0,8478 | |||
| XLF / The Select Sector SPDR Trust - The Financial Select Sector SPDR Fund | 0,77 | 0,00 | 40,10 | 5,14 | 6,2165 | -1,1513 | |||
| SPY / SPDR S&P 500 ETF | 0,06 | 9,36 | 37,44 | 20,79 | 5,8035 | -0,1838 | |||
| GLBE / Global-E Online Ltd. | 0,77 | 95,47 | 25,93 | 83,90 | 4,7357 | 2,0118 | |||
| META / Meta Platforms, Inc. | 0,03 | 0,02 | 24,29 | 28,09 | 3,7660 | 0,1023 | |||
| MSFT / Microsoft Corporation | 0,04 | 0,03 | 21,05 | 32,54 | 3,8437 | 0,7762 | |||
| ZIM / ZIM Integrated Shipping Services Ltd. | 1,23 | -9,14 | 19,81 | 0,20 | 3,6185 | -0,2013 | |||
| AMZN / Amazon.com, Inc. | 0,08 | 0,00 | 17,84 | 15,31 | 3,2574 | 0,2693 | |||
| MDWD / MediWound Ltd. | 0,82 | -4,81 | 15,82 | 18,80 | 2,8890 | 0,3168 | |||
| PKB / Invesco Exchange-Traded Fund Trust - Invesco Building & Construction ETF | 0,08 | -16,37 | 14,81 | -12,26 | 2,2963 | -0,9649 | |||
| GSK / GSK plc - Depositary Receipt (Common Stock) | 0,36 | -9,98 | 13,98 | -10,77 | 2,5529 | -0,4736 | |||
| IVV / iShares Trust - iShares Core S&P 500 ETF | 0,02 | -1,92 | 12,45 | 8,38 | 1,9294 | -0,2889 | |||
| GOOGL / Alphabet Inc. | 0,07 | 0,03 | 11,70 | 14,00 | 1,8142 | -0,1690 | |||
| IFF / International Flavors & Fragrances Inc. | 0,13 | 0,00 | 9,43 | -5,24 | 1,4620 | -0,4604 | |||
| NICE / NICE Ltd. - Depositary Receipt (Common Stock) | 0,05 | 0,00 | 9,24 | 9,56 | 1,6871 | 0,0583 | |||
| ORA / Ormat Technologies, Inc. | 0,11 | 0,00 | 8,89 | 18,35 | 1,3786 | -0,0729 | |||
| XBI / SPDR Series Trust - SPDR S&P Biotech ETF | 0,10 | 0,00 | 8,67 | 2,25 | 1,3438 | -0,2938 | |||
| BABA / Alibaba Group Holding Limited - Depositary Receipt (Common Stock) | 0,07 | 0,00 | 7,86 | -14,24 | 1,2186 | -0,5519 | |||
| PFE / Pfizer Inc. | 0,30 | 0,00 | 7,22 | -4,35 | 1,3184 | -0,1394 | |||
| PRGO / Perrigo Company plc | 0,27 | -0,08 | 7,12 | -4,79 | 1,3006 | -0,1442 | |||
| RDCM / RADCOM Ltd. | 0,51 | -4,58 | 6,89 | 13,46 | 1,2581 | 0,0851 | |||
| SCHD / Schwab Strategic Trust - Schwab U.S. Dividend Equity ETF | 0,25 | -31,93 | 6,67 | -35,49 | 1,0333 | -0,9626 | |||
| TEVA / Teva Pharmaceutical Industries Limited - Depositary Receipt (Common Stock) | 0,40 | 0,00 | 6,63 | 9,05 | 1,2105 | 0,0363 | |||
| ESLT / Elbit Systems Ltd. | 0,01 | 0,00 | 5,77 | 17,17 | 0,8947 | -0,0569 | |||
| KRNT / Kornit Digital Ltd. | 0,23 | -11,61 | 4,59 | -7,77 | 0,8375 | -0,1230 | |||
| ENLT / Enlight Renewable Energy Ltd | 0,20 | 0,00 | 4,52 | 40,65 | 0,7006 | 0,0799 | |||
| RDWR / Radware Ltd. | 0,15 | -34,97 | 4,41 | -11,45 | 0,6843 | -0,2787 | |||
| VTRS / Viatris Inc. | 0,49 | 0,00 | 4,35 | 2,52 | 0,6747 | -0,1453 | |||
| INMD / InMode Ltd. | 0,30 | -1,80 | 4,32 | -20,08 | 0,7881 | -0,2548 | |||
| NVMI / Nova Ltd. | 0,02 | -0,01 | 4,25 | 49,30 | 0,7760 | 0,2262 | |||
| ANET / Arista Networks Inc | 0,04 | 0,04 | 3,96 | 32,12 | 0,6140 | 0,0348 | |||
| XLK / The Select Sector SPDR Trust - The Technology Select Sector SPDR Fund | 0,02 | 0,00 | 3,86 | 22,65 | 0,5978 | -0,0096 | |||
| ICL / ICL Group Ltd | 0,54 | 0,00 | 3,70 | 20,90 | 0,6753 | 0,0845 | |||
| SILC / Silicom Ltd. | 0,21 | -12,49 | 3,20 | -9,05 | 0,4955 | -0,1834 | |||
| CAMT / Camtek Ltd. | 0,04 | -0,01 | 3,01 | 44,27 | 0,4663 | 0,0634 | |||
| CHKP / Check Point Software Technologies Ltd. | 0,01 | 0,16 | 2,82 | -2,76 | 0,5141 | -0,0452 | |||
| TBLA / Taboola.com Ltd. | 0,77 | 46,14 | 2,81 | 81,37 | 0,4361 | 0,1364 | |||
| ELTK / Eltek Ltd. | 0,25 | -7,20 | 2,71 | 19,40 | 0,4947 | 0,0565 | |||
| XAR / SPDR Series Trust - SPDR S&P Aerospace & Defense ETF | 0,01 | 0,00 | 2,64 | 31,27 | 0,4087 | 0,0207 | |||
| QQQ / Invesco QQQ Trust, Series 1 | 0,00 | 0,00 | 2,61 | 17,65 | 0,4052 | -0,0240 | |||
| SN / SharkNinja, Inc. | 0,03 | 6,02 | 2,61 | 25,87 | 0,4051 | 0,0039 | |||
| NVDA / NVIDIA Corporation | 0,02 | 0,19 | 2,38 | 46,13 | 0,3683 | 0,0541 | |||
| WIX / Wix.com Ltd. | 0,01 | 4,85 | 2,22 | 1,69 | 0,3449 | -0,0777 | |||
| BRK.B / Berkshire Hathaway Inc. | 0,00 | 0,00 | 2,16 | -8,78 | 0,3351 | -0,1227 | |||
| ZM / Zoom Communications Inc. | 0,03 | 0,00 | 2,02 | 5,71 | 0,3688 | -0,0002 | |||
| KKR / KKR & Co. Inc. | 0,01 | 0,00 | 1,97 | 15,05 | 0,3058 | -0,0254 | |||
| ALLT / Allot Ltd. | 0,23 | 0,00 | 1,93 | 49,69 | 0,2995 | 0,0502 | |||
| MRVL / Marvell Technology, Inc. | 0,02 | -0,06 | 1,92 | 25,64 | 0,2978 | 0,0024 | |||
| ELLO / Ellomay Capital Ltd. | 0,11 | 0,00 | 1,90 | 13,25 | 0,3467 | 0,0230 | |||
| INTC / Intel Corporation | 0,08 | -0,07 | 1,76 | -1,45 | 0,3217 | -0,0235 | |||
| VUG / Vanguard Index Funds - Vanguard Growth ETF | 0,00 | 0,00 | 1,68 | 18,21 | 0,2606 | -0,0141 | |||
| SCHG / Schwab Strategic Trust - Schwab U.S. Large-Cap Growth ETF | 0,06 | 0,00 | 1,67 | 16,64 | 0,2586 | -0,0176 | |||
| VTWO / Vanguard Scottsdale Funds - Vanguard Russell 2000 ETF | 0,02 | 0,00 | 1,64 | 8,16 | 0,3002 | 0,0066 | |||
| LOW / Lowe's Companies, Inc. | 0,01 | 0,00 | 1,31 | -4,87 | 0,2390 | -0,0268 | |||
| GILT / Gilat Satellite Networks Ltd. | 0,18 | 0,00 | 1,29 | 11,72 | 0,1995 | -0,0232 | |||
| CSTE / Caesarstone Ltd. | 0,62 | 0,00 | 1,23 | -18,93 | 0,1899 | -0,1020 | |||
| MGIC / Magic Software Enterprises Ltd. | 0,06 | 0,00 | 1,19 | 47,15 | 0,1840 | 0,0282 | |||
| XLI / The Select Sector SPDR Trust - The Industrial Select Sector SPDR Fund | 0,01 | 0,00 | 1,18 | 12,60 | 0,1829 | -0,0196 | |||
| XLV / The Select Sector SPDR Trust - The Health Care Select Sector SPDR Fund | 0,01 | -95,12 | 1,15 | -95,50 | 0,1784 | -4,7609 | |||
| SPG / Simon Property Group, Inc. | 0,01 | 0,00 | 1,15 | -3,20 | 0,1782 | -0,0512 | |||
| HRMY / Harmony Biosciences Holdings, Inc. | 0,04 | 0,00 | 1,13 | -4,79 | 0,1758 | -0,0543 | |||
| ODYS / Odysight.ai Inc. | 0,21 | -8,42 | 1,08 | -33,48 | 0,1671 | -0,1459 | |||
| SNDX / Syndax Pharmaceuticals, Inc. | 0,11 | 0,00 | 1,01 | -23,82 | 0,1573 | -0,0999 | |||
| CSCO / Cisco Systems, Inc. | 0,01 | 0,43 | 0,91 | 12,95 | 0,1657 | 0,0105 | |||
| V / Visa Inc. | 0,00 | 0,69 | 0,78 | 1,96 | 0,1428 | -0,0053 | |||
| CMMB / Chemomab Therapeutics Ltd. - Depositary Receipt (Common Stock) | 0,58 | 0,00 | 0,67 | 6,35 | 0,1225 | 0,0007 | |||
| CGEN / Compugen Ltd. | 0,32 | 0,00 | 0,57 | 21,94 | 0,0880 | -0,0019 | |||
| GE / General Electric Company | 0,00 | 0,00 | 0,55 | 28,81 | 0,1004 | 0,0178 | |||
| AMT / American Tower Corporation | 0,00 | -1,48 | 0,50 | 0,00 | 0,0914 | -0,0052 | |||
| CPAY / Corpay, Inc. | 0,00 | 0,00 | 0,50 | -4,97 | 0,0772 | -0,0239 | |||
| MU / Micron Technology, Inc. | 0,00 | -0,36 | 0,48 | 41,42 | 0,0742 | 0,0088 | |||
| T / AT&T Inc. | 0,02 | 3,11 | 0,48 | 5,53 | 0,0871 | -0,0002 | |||
| JEF / Jefferies Financial Group Inc. | 0,01 | 0,00 | 0,47 | 2,16 | 0,0733 | -0,0162 | |||
| NVR / NVR, Inc. | 0,00 | 0,00 | 0,47 | 1,97 | 0,0850 | -0,0032 | |||
| VZ / Verizon Communications Inc. | 0,01 | 2,53 | 0,45 | -2,19 | 0,0693 | -0,0190 | |||
| TMUS / T-Mobile US, Inc. | 0,00 | 16,48 | 0,44 | 4,03 | 0,0803 | -0,0013 | |||
| PERI / Perion Network Ltd. | 0,04 | 0,00 | 0,43 | 24,85 | 0,0662 | 0,0000 | |||
| DLR / Digital Realty Trust, Inc. | 0,00 | 0,00 | 0,40 | 21,58 | 0,0622 | -0,0015 | |||
| ARVN / Arvinas, Inc. | 0,05 | 0,00 | 0,34 | 4,89 | 0,0532 | -0,0100 | |||
| WMB / The Williams Companies, Inc. | 0,01 | -1,47 | 0,34 | 3,65 | 0,0530 | -0,0108 | |||
| DIS / The Walt Disney Company | 0,00 | 0,00 | 0,31 | 26,02 | 0,0566 | 0,0090 | |||
| CEG / Constellation Energy Corporation | 0,00 | 0,30 | 0,0544 | 0,0544 | |||||
| NEE / NextEra Energy, Inc. | 0,00 | -0,59 | 0,29 | -2,68 | 0,0532 | -0,0046 | |||
| GEV / GE Vernova Inc. | 0,00 | 0,28 | 0,0516 | 0,0516 | |||||
| DUK / Duke Energy Corporation | 0,00 | -5,75 | 0,27 | -8,81 | 0,0417 | -0,0153 | |||
| PYPL / PayPal Holdings, Inc. | 0,00 | 0,00 | 0,24 | 13,68 | 0,0374 | -0,0035 | |||
| TEAD / Teads Holding Co. | 0,10 | 0,00 | 0,24 | -33,61 | 0,0372 | -0,0325 | |||
| OKE / ONEOK, Inc. | 0,00 | -1,58 | 0,24 | -18,98 | 0,0371 | -0,0200 | |||
| SEDG / SolarEdge Technologies, Inc. | 0,01 | 0,00 | 0,24 | 26,06 | 0,0434 | 0,0070 | |||
| CCI / Crown Castle Inc. | 0,00 | -1,41 | 0,21 | -2,82 | 0,0379 | -0,0034 | |||
| NGG / National Grid plc - Depositary Receipt (Common Stock) | 0,00 | 0,20 | 0,0369 | 0,0369 | |||||
| PFLT / PennantPark Floating Rate Capital Ltd. | 0,02 | 0,00 | 0,20 | -7,80 | 0,0312 | -0,0109 | |||
| UPS / United Parcel Service, Inc. | 0,00 | 0,00 | 0,20 | -8,22 | 0,0312 | -0,0112 | |||
| AUDC / AudioCodes Ltd. | 0,02 | 0,00 | 0,20 | 4,23 | 0,0306 | -0,0060 | |||
| SOL GEL TECHNOLOGIES / SHS (M8694L103) | 0,02 | 0,13 | 0,0000 | ||||||
| NFE / New Fortress Energy Inc. | 0,02 | 0,06 | 0,0104 | 0,0104 | |||||
| PYPD / PolyPid Ltd. | 0,00 | -100,00 | 0,00 | 0,0000 | |||||
| VLN / Valens Semiconductor Ltd. | 0,00 | -100,00 | 0,00 | 0,0000 | |||||
| SPNS / Sapiens International Corporation N.V. | 0,00 | -100,00 | 0,00 | -100,00 | -0,0485 | ||||
| CMCT / Creative Media & Community Trust Corporation | 0,00 | -100,00 | 0,00 | 0,0000 | |||||
| TRGP / Targa Resources Corp. | 0,00 | -100,00 | 0,00 | 0,0000 | |||||
| XLP / The Select Sector SPDR Trust - The Consumer Staples Select Sector SPDR Fund | 0,00 | -100,00 | 0,00 | 0,0000 |