Statistiques de base
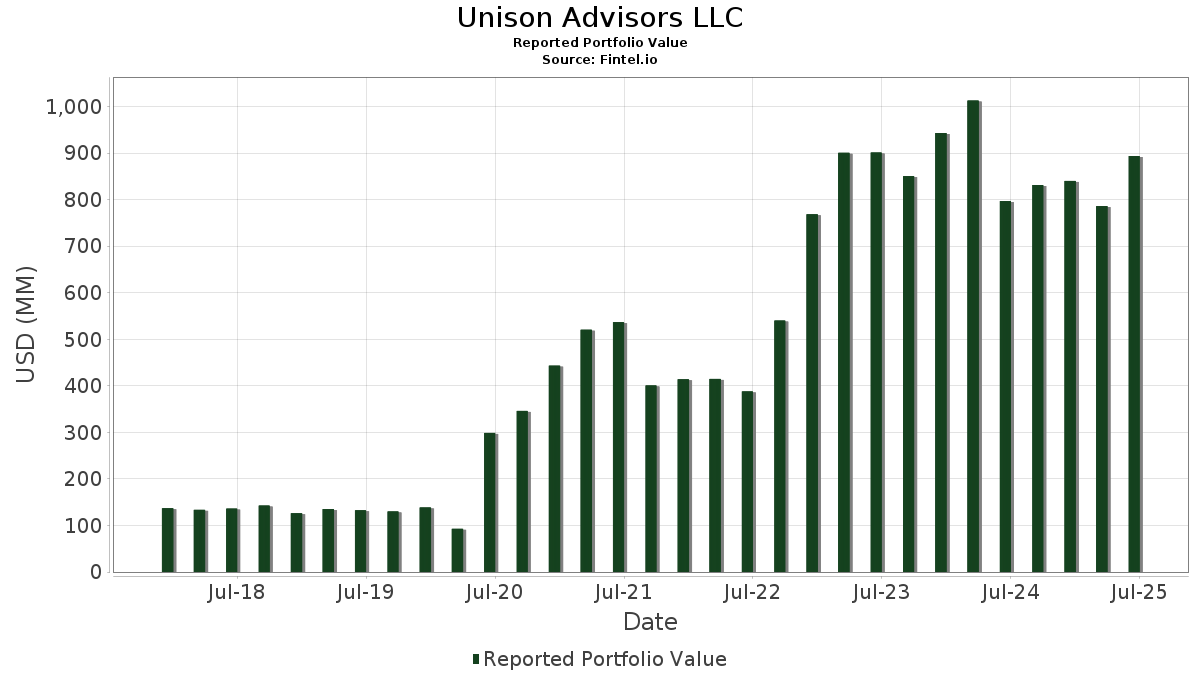
| Valeur du portefeuille | $ 893 597 764 |
| Positions actuelles | 177 |
Dernières positions, performances, ASG (à partir des dépôts 13F, 13D)
Unison Advisors LLC a déclaré un total de 177 positions dans ses derniers dépôts auprès de la SEC. La valeur la plus récente du portefeuille est calculée à 893 597 764 USD. Les actifs sous gestion réels (ASG) sont cette valeur plus les liquidités (qui ne sont pas divulguées). Les principales positions de Unison Advisors LLC sont American Century ETF Trust - Avantis U.S. Small Cap Value ETF (US:AVUV) , American Century ETF Trust - Avantis International Small Cap Value ETF (US:AVDV) , Vanguard Index Funds - Vanguard Value ETF (US:VTV) , Vanguard Municipal Bond Funds - Vanguard Intermediate-Term Tax-Exempt Bond ETF (US:VTEI) , and Schwab Strategic Trust - Schwab Fundamental Emerging Markets Equity ETF (US:FNDE) . Les nouvelles positions de Unison Advisors LLC incluent Vanguard Institutional Index Fund - 0-3 Months Treasury Bill ETF (US:VBIL) , Costamare Bulkers Holdings Limited (US:CMDB) , .
Meilleures augmentations ce trimestre
Nous utilisons la variation de l'allocation du portefeuille car il s'agit de l'indicateur le plus significatif. Les changements peuvent être dus à des transactions ou à des variations de prix des actions.
| Titre | Actions (en millions) |
Valeur ($ en millions) |
% du portefeuille | ΔPortefeuille % |
|---|---|---|---|---|
| 0,59 | 58,59 | 6,5567 | 6,5567 | |
| 0,08 | 16,36 | 1,8309 | 1,1485 | |
| 0,02 | 11,53 | 1,2899 | 0,1459 | |
| 1,18 | 93,23 | 10,4336 | 0,1021 | |
| 0,04 | 4,97 | 0,5562 | 0,0984 | |
| 0,01 | 0,84 | 0,0940 | 0,0940 | |
| 0,11 | 7,03 | 0,7873 | 0,0813 | |
| 0,03 | 6,03 | 0,6746 | 0,0655 | |
| 0,04 | 1,09 | 0,1215 | 0,0446 | |
| 0,05 | 2,73 | 0,3050 | 0,0358 |
Principales baisses ce trimestre
Nous utilisons la variation de l'allocation du portefeuille car il s'agit de l'indicateur le plus significatif. Les changements peuvent être dus à des transactions ou à des variations de prix des actions.
| Titre | Actions (en millions) |
Valeur ($ en millions) |
% du portefeuille | ΔPortefeuille % |
|---|---|---|---|---|
| 0,53 | 29,49 | 3,3006 | -1,1154 | |
| 1,07 | 97,63 | 10,9260 | -0,8849 | |
| 0,38 | 67,73 | 7,5790 | -0,8026 | |
| 1,33 | 43,91 | 4,9139 | -0,3711 | |
| 0,33 | 16,18 | 1,8105 | -0,2716 | |
| 0,25 | 19,99 | 2,2376 | -0,1541 | |
| 0,78 | 31,08 | 3,4786 | -0,1379 | |
| 0,01 | 3,15 | 0,3529 | -0,1311 | |
| 0,03 | 5,87 | 0,6569 | -0,1168 | |
| 0,22 | 40,51 | 4,5339 | -0,1160 |
Déclarations 13F et dépôts de fonds
Ce formulaire a été déposé le 2025-07-29 pour la période de déclaration 2025-06-30. Cliquez sur l'icône du lien pour voir l'historique complet des transactions.
Mettre à niveau pour débloquer les données premium et exporter vers Excel ![]() .
.
| Titre | Type | Prix moyen de l'action | Actions (en millions) |
ΔActions (%) |
ΔActions (%) |
Valeur ($ en millions) |
Portefeuille (%) |
ΔPortefeuille (%) |
|
|---|---|---|---|---|---|---|---|---|---|
| AVUV / American Century ETF Trust - Avantis U.S. Small Cap Value ETF | 1,07 | 0,63 | 97,63 | 5,16 | 10,9260 | -0,8849 | |||
| AVDV / American Century ETF Trust - Avantis International Small Cap Value ETF | 1,18 | 0,99 | 93,23 | 14,81 | 10,4336 | 0,1021 | |||
| VTV / Vanguard Index Funds - Vanguard Value ETF | 0,38 | 0,09 | 67,73 | 2,80 | 7,5790 | -0,8026 | |||
| VTEI / Vanguard Municipal Bond Funds - Vanguard Intermediate-Term Tax-Exempt Bond ETF | 0,59 | 58,59 | 6,5567 | 6,5567 | |||||
| FNDE / Schwab Strategic Trust - Schwab Fundamental Emerging Markets Equity ETF | 1,33 | -1,38 | 43,91 | 5,70 | 4,9139 | -0,3711 | |||
| QUAL / iShares Trust - iShares MSCI USA Quality Factor ETF | 0,22 | 3,61 | 40,51 | 10,85 | 4,5339 | -0,1160 | |||
| IQLT / iShares Trust - iShares MSCI Intl Quality Factor ETF | 0,85 | 2,55 | 36,53 | 11,67 | 4,0877 | -0,0737 | |||
| DEHP / Dimensional ETF Trust - Dimensional Emerging Markets High Profitability ETF | 1,27 | 0,61 | 35,59 | 11,70 | 3,9827 | -0,0707 | |||
| FNDF / Schwab Strategic Trust - Schwab Fundamental International Equity ETF | 0,78 | -1,25 | 31,08 | 9,35 | 3,4786 | -0,1379 | |||
| DGS / WisdomTree Trust - WisdomTree Emerging Markets SmallCap Dividend Fund | 0,53 | -25,69 | 29,49 | -15,03 | 3,3006 | -1,1154 | |||
| VCSH / Vanguard Scottsdale Funds - Vanguard Short-Term Corporate Bond ETF | 0,25 | 5,61 | 19,99 | 6,36 | 2,2376 | -0,1541 | |||
| COF / Capital One Financial Corporation | 0,08 | 157,02 | 16,36 | 205,01 | 1,8309 | 1,1485 | |||
| VTEB / Vanguard Municipal Bond Funds - Vanguard Tax-Exempt Bond ETF | 0,33 | 0,04 | 16,18 | -1,15 | 1,8105 | -0,2716 | |||
| VYM / Vanguard Whitehall Funds - Vanguard High Dividend Yield ETF | 0,12 | 7,51 | 15,82 | 11,14 | 1,7705 | -0,0405 | |||
| VYMI / Vanguard Whitehall Funds - Vanguard International High Dividend Yield ETF | 0,15 | -0,35 | 12,28 | 8,34 | 1,3744 | -0,0679 | |||
| VGSH / Vanguard Scottsdale Funds - Vanguard Short-Term Treasury ETF | 0,20 | 6,22 | 11,72 | 6,38 | 1,3121 | -0,0900 | |||
| META / Meta Platforms, Inc. | 0,02 | 0,10 | 11,53 | 28,18 | 1,2899 | 0,1459 | |||
| SYF / Synchrony Financial | 0,11 | 0,56 | 7,03 | 26,76 | 0,7873 | 0,0813 | |||
| MTUM / iShares Trust - iShares MSCI USA Momentum Factor ETF | 0,03 | 5,91 | 6,03 | 25,92 | 0,6746 | 0,0655 | |||
| GRMN / Garmin Ltd. | 0,03 | 0,41 | 5,87 | -3,49 | 0,6569 | -0,1168 | |||
| NUE / Nucor Corporation | 0,04 | 0,52 | 5,55 | 8,17 | 0,6209 | -0,0317 | |||
| VMBS / Vanguard Scottsdale Funds - Vanguard Mortgage-Backed Securities ETF | 0,12 | 8,90 | 5,50 | 8,97 | 0,6160 | -0,0267 | |||
| DHI / D.R. Horton, Inc. | 0,04 | 0,33 | 5,01 | 1,75 | 0,5604 | -0,0658 | |||
| GD / General Dynamics Corporation | 0,02 | 0,56 | 4,99 | 7,61 | 0,5585 | -0,0315 | |||
| AMD / Advanced Micro Devices, Inc. | 0,04 | 0,00 | 4,97 | 38,10 | 0,5562 | 0,0984 | |||
| PFG / Principal Financial Group, Inc. | 0,06 | 1,04 | 4,77 | -4,88 | 0,5340 | -0,1042 | |||
| CSCO / Cisco Systems, Inc. | 0,07 | 0,73 | 4,65 | 13,25 | 0,5204 | -0,0020 | |||
| FITB / Fifth Third Bancorp | 0,10 | 1,08 | 4,34 | 6,01 | 0,4853 | -0,0351 | |||
| MET / MetLife, Inc. | 0,05 | 0,78 | 4,25 | 0,95 | 0,4752 | -0,0599 | |||
| BIL / SPDR Series Trust - SPDR Bloomberg 1-3 Month T-Bill ETF | 0,05 | -7,36 | 4,23 | -7,35 | 0,4737 | -0,1076 | |||
| TRV / The Travelers Companies, Inc. | 0,02 | 0,44 | 4,13 | 1,62 | 0,4623 | -0,0549 | |||
| LEN / Lennar Corporation | 0,04 | 0,47 | 4,13 | -3,19 | 0,4622 | -0,0805 | |||
| CI / The Cigna Group | 0,01 | 0,00 | 4,12 | 0,49 | 0,4607 | -0,0605 | |||
| IMTM / iShares Trust - iShares MSCI Intl Momentum Factor ETF | 0,09 | 5,37 | 4,05 | 20,53 | 0,4534 | 0,0258 | |||
| CB / Chubb Limited | 0,01 | 0,32 | 3,95 | -3,73 | 0,4420 | -0,0799 | |||
| CVS / CVS Health Corporation | 0,05 | 1,04 | 3,78 | 2,88 | 0,4235 | -0,0445 | |||
| PRU / Prudential Financial, Inc. | 0,04 | 1,41 | 3,78 | -2,45 | 0,4234 | -0,0700 | |||
| EOG / EOG Resources, Inc. | 0,03 | 0,89 | 3,58 | -5,88 | 0,4010 | -0,0834 | |||
| GM / General Motors Company | 0,07 | 0,28 | 3,35 | 4,95 | 0,3749 | -0,0313 | |||
| DDS / Dillard's, Inc. | 0,01 | 2,33 | 3,34 | 19,40 | 0,3740 | 0,0178 | |||
| REGN / Regeneron Pharmaceuticals, Inc. | 0,01 | 0,13 | 3,15 | -17,11 | 0,3529 | -0,1311 | |||
| ADM / Archer-Daniels-Midland Company | 0,06 | 1,18 | 2,96 | 11,22 | 0,3317 | -0,0073 | |||
| LH / Labcorp Holdings Inc. | 0,01 | 0,31 | 2,95 | 13,16 | 0,3300 | -0,0016 | |||
| EMR / Emerson Electric Co. | 0,02 | 0,54 | 2,86 | 22,27 | 0,3195 | 0,0224 | |||
| HPQ / HP Inc. | 0,12 | 1,03 | 2,85 | -10,63 | 0,3190 | -0,0868 | |||
| ELV / Elevance Health, Inc. | 0,01 | 0,38 | 2,85 | -10,24 | 0,3190 | -0,0850 | |||
| VZ / Verizon Communications Inc. | 0,07 | 1,56 | 2,83 | -3,12 | 0,3162 | -0,0548 | |||
| ON / ON Semiconductor Corporation | 0,05 | 0,00 | 2,73 | 28,84 | 0,3050 | 0,0358 | |||
| BEN / Franklin Resources, Inc. | 0,11 | 1,84 | 2,70 | 25,73 | 0,3019 | 0,0290 | |||
| CVX / Chevron Corporation | 0,02 | 1,21 | 2,59 | -13,36 | 0,2903 | -0,0907 | |||
| KHC / The Kraft Heinz Company | 0,10 | 1,40 | 2,57 | -13,98 | 0,2871 | -0,0923 | |||
| VNQ / Vanguard Specialized Funds - Vanguard Real Estate ETF | 0,03 | 1,48 | 2,53 | -0,16 | 0,2829 | -0,0393 | |||
| HUM / Humana Inc. | 0,01 | 0,00 | 2,48 | -7,57 | 0,2773 | -0,0638 | |||
| NVR / NVR, Inc. | 0,00 | 0,00 | 2,47 | 1,98 | 0,2769 | -0,0319 | |||
| SUB / iShares Trust - iShares Short-Term National Muni Bond ETF | 0,02 | 0,02 | 2,47 | 0,73 | 0,2768 | -0,0356 | |||
| LYB / LyondellBasell Industries N.V. | 0,04 | 2,37 | 2,44 | -15,87 | 0,2735 | -0,0961 | |||
| XOM / Exxon Mobil Corporation | 0,02 | 0,96 | 2,35 | -8,49 | 0,2630 | -0,0637 | |||
| CTSH / Cognizant Technology Solutions Corporation | 0,03 | 0,45 | 2,33 | 2,46 | 0,2606 | -0,0285 | |||
| PFE / Pfizer Inc. | 0,09 | 1,90 | 2,23 | -2,53 | 0,2499 | -0,0415 | |||
| USHY / iShares Trust - iShares Broad USD High Yield Corporate Bond ETF | 0,06 | 3,07 | 2,22 | 5,06 | 0,2487 | -0,0205 | |||
| SQM / Sociedad Química y Minera de Chile S.A. - Depositary Receipt (Common Stock) | 0,06 | 0,00 | 2,20 | -11,24 | 0,2467 | -0,0692 | |||
| FANG / Diamondback Energy, Inc. | 0,02 | 0,80 | 2,17 | -13,39 | 0,2433 | -0,0760 | |||
| VLO / Valero Energy Corporation | 0,02 | 1,05 | 2,08 | 2,81 | 0,2333 | -0,0246 | |||
| BBY / Best Buy Co., Inc. | 0,03 | 1,51 | 2,02 | -7,30 | 0,2260 | -0,0512 | |||
| ALGN / Align Technology, Inc. | 0,01 | 0,00 | 2,00 | 19,17 | 0,2241 | 0,0103 | |||
| DOW / Dow Inc. | 0,07 | 2,54 | 1,89 | -22,22 | 0,2112 | -0,0976 | |||
| BKE / The Buckle, Inc. | 0,04 | 7,90 | 1,88 | 27,72 | 0,2105 | 0,0231 | |||
| WY / Weyerhaeuser Company | 0,07 | 0,82 | 1,80 | -11,53 | 0,2009 | -0,0573 | |||
| TROW / T. Rowe Price Group, Inc. | 0,02 | 1,55 | 1,69 | 6,68 | 0,1896 | -0,0125 | |||
| STLD / Steel Dynamics, Inc. | 0,01 | 0,40 | 1,57 | 2,75 | 0,1754 | -0,0187 | |||
| EMB / iShares Trust - iShares J.P. Morgan USD Emerging Markets Bond ETF | 0,02 | 3,11 | 1,57 | 5,45 | 0,1753 | -0,0137 | |||
| COP / ConocoPhillips | 0,02 | 0,91 | 1,56 | -13,79 | 0,1750 | -0,0557 | |||
| MLI / Mueller Industries, Inc. | 0,02 | 0,36 | 1,52 | 4,70 | 0,1697 | -0,0145 | |||
| TSN / Tyson Foods, Inc. | 0,03 | 0,85 | 1,48 | -11,60 | 0,1655 | -0,0473 | |||
| PRDO / Perdoceo Education Corporation | 0,04 | 0,51 | 1,41 | 30,53 | 0,1579 | 0,0203 | |||
| SWKS / Skyworks Solutions, Inc. | 0,02 | 1,31 | 1,33 | 16,86 | 0,1490 | 0,0040 | |||
| OFG / OFG Bancorp | 0,03 | 0,71 | 1,30 | 7,70 | 0,1456 | -0,0082 | |||
| PFFD / Global X Funds - Global X U.S. Preferred ETF | 0,07 | 5,85 | 1,24 | 4,72 | 0,1391 | -0,0120 | |||
| VTI / Vanguard Index Funds - Vanguard Total Stock Market ETF | 0,00 | 1,60 | 1,22 | 12,37 | 0,1362 | -0,0016 | |||
| VNQI / Vanguard International Equity Index Funds - Vanguard Global ex-U.S. Real Estate ETF | 0,03 | -0,27 | 1,20 | 13,81 | 0,1337 | 0,0001 | |||
| BSV / Vanguard Bond Index Funds - Vanguard Short-Term Bond ETF | 0,01 | -20,95 | 1,12 | -20,57 | 0,1250 | -0,0538 | |||
| PHM / PulteGroup, Inc. | 0,01 | 0,22 | 1,12 | 2,86 | 0,1248 | -0,0132 | |||
| GNE / Genie Energy Ltd. | 0,04 | 0,51 | 1,09 | 79,50 | 0,1215 | 0,0446 | |||
| BPOP / Popular, Inc. | 0,01 | 0,84 | 1,08 | 20,20 | 0,1212 | 0,0065 | |||
| VT / Vanguard International Equity Index Funds - Vanguard Total World Stock ETF | 0,01 | 0,18 | 1,07 | 11,10 | 0,1199 | -0,0029 | |||
| UVE / Universal Insurance Holdings, Inc. | 0,04 | 0,75 | 1,06 | 17,89 | 0,1188 | 0,0042 | |||
| FHN / First Horizon Corporation | 0,05 | 0,90 | 1,02 | 10,05 | 0,1140 | -0,0037 | |||
| MOS / The Mosaic Company | 0,03 | 0,93 | 1,02 | 36,38 | 0,1138 | 0,0189 | |||
| BFH / Bread Financial Holdings, Inc. | 0,02 | 0,47 | 1,00 | 14,63 | 0,1123 | 0,0009 | |||
| VTIP / Vanguard Malvern Funds - Vanguard Short-Term Inflation-Protected Securities ETF | 0,02 | 0,19 | 0,99 | 0,92 | 0,1111 | -0,0140 | |||
| CALM / Cal-Maine Foods, Inc. | 0,01 | 1,58 | 0,99 | 11,36 | 0,1108 | -0,0023 | |||
| CNR / Core Natural Resources, Inc. | 0,01 | 0,14 | 0,98 | -9,44 | 0,1096 | -0,0280 | |||
| IMKTA / Ingles Markets, Incorporated | 0,02 | 0,26 | 0,96 | -2,43 | 0,1079 | -0,0178 | |||
| NMIH / NMI Holdings, Inc. | 0,02 | 0,00 | 0,96 | 17,07 | 0,1074 | 0,0031 | |||
| MTG / MGIC Investment Corporation | 0,03 | 0,57 | 0,95 | 12,98 | 0,1063 | -0,0006 | |||
| MCB / Metropolitan Bank Holding Corp. | 0,01 | 0,00 | 0,94 | 25,17 | 0,1058 | 0,0096 | |||
| DINO / HF Sinclair Corporation | 0,02 | 1,81 | 0,94 | 27,27 | 0,1050 | 0,0112 | |||
| HSII / Heidrick & Struggles International, Inc. | 0,02 | 0,38 | 0,92 | 7,21 | 0,1033 | -0,0062 | |||
| PFBC / Preferred Bank | 0,01 | 0,98 | 0,91 | 4,37 | 0,1016 | -0,0090 | |||
| ETD / Ethan Allen Interiors Inc. | 0,03 | 1,48 | 0,87 | 1,99 | 0,0976 | -0,0111 | |||
| EWBC / East West Bancorp, Inc. | 0,01 | 0,82 | 0,86 | 13,47 | 0,0962 | -0,0002 | |||
| VBIL / Vanguard Institutional Index Fund - 0-3 Months Treasury Bill ETF | 0,01 | 0,84 | 0,0940 | 0,0940 | |||||
| AAPL / Apple Inc. | 0,00 | 0,00 | 0,83 | -7,57 | 0,0929 | -0,0214 | |||
| STC / Stewart Information Services Corporation | 0,01 | 0,77 | 0,83 | -8,09 | 0,0928 | -0,0220 | |||
| RYI / Ryerson Holding Corporation | 0,04 | 0,87 | 0,83 | -5,28 | 0,0924 | -0,0184 | |||
| CF / CF Industries Holdings, Inc. | 0,01 | 0,68 | 0,82 | 18,43 | 0,0914 | 0,0037 | |||
| ALB / Albemarle Corporation | 0,01 | 0,68 | 0,81 | -12,26 | 0,0905 | -0,0268 | |||
| CASH / Pathward Financial, Inc. | 0,01 | 0,00 | 0,81 | 8,47 | 0,0904 | -0,0044 | |||
| EBF / Ennis, Inc. | 0,04 | 1,16 | 0,81 | -8,72 | 0,0903 | -0,0221 | |||
| AGCO / AGCO Corporation | 0,01 | 0,36 | 0,80 | 11,90 | 0,0895 | -0,0015 | |||
| QCRH / QCR Holdings, Inc. | 0,01 | 0,09 | 0,78 | -4,74 | 0,0877 | -0,0169 | |||
| CMRE / Costamare Inc. | 0,09 | 1,30 | 0,78 | -6,24 | 0,0875 | -0,0186 | |||
| HAFC / Hanmi Financial Corporation | 0,03 | 1,31 | 0,78 | 10,34 | 0,0872 | -0,0026 | |||
| MATX / Matson, Inc. | 0,01 | 0,30 | 0,78 | -12,92 | 0,0868 | -0,0264 | |||
| MHO / M/I Homes, Inc. | 0,01 | 0,00 | 0,78 | -1,77 | 0,0868 | -0,0137 | |||
| ABEV / Ambev S.A. - Depositary Receipt (Common Stock) | 0,30 | 2,18 | 0,74 | 5,56 | 0,0830 | -0,0063 | |||
| CATY / Cathay General Bancorp | 0,02 | 0,89 | 0,74 | 6,83 | 0,0823 | -0,0053 | |||
| LPX / Louisiana-Pacific Corporation | 0,01 | 0,23 | 0,72 | -6,38 | 0,0806 | -0,0172 | |||
| ASIX / AdvanSix Inc. | 0,03 | 0,83 | 0,72 | 5,77 | 0,0800 | -0,0060 | |||
| PAGS / PagSeguro Digital Ltd. | 0,07 | 0,00 | 0,71 | 26,29 | 0,0796 | 0,0080 | |||
| MTH / Meritage Homes Corporation | 0,01 | 0,65 | 0,71 | -4,97 | 0,0793 | -0,0155 | |||
| OZK / Bank OZK | 0,01 | 1,09 | 0,70 | 9,49 | 0,0788 | -0,0030 | |||
| INTC / Intel Corporation | 0,03 | 0,00 | 0,70 | -1,40 | 0,0786 | -0,0120 | |||
| ESNT / Essent Group Ltd. | 0,01 | 0,58 | 0,70 | 5,91 | 0,0783 | -0,0058 | |||
| HCC / Warrior Met Coal, Inc. | 0,02 | 0,19 | 0,70 | -3,86 | 0,0781 | -0,0142 | |||
| FNF / Fidelity National Financial, Inc. | 0,01 | 0,85 | 0,69 | -13,11 | 0,0771 | -0,0238 | |||
| TMHC / Taylor Morrison Home Corporation | 0,01 | 0,00 | 0,68 | 2,26 | 0,0761 | -0,0085 | |||
| CMC / Commercial Metals Company | 0,01 | 0,44 | 0,68 | 6,78 | 0,0758 | -0,0049 | |||
| SNDR / Schneider National, Inc. | 0,03 | 0,44 | 0,68 | 6,13 | 0,0756 | -0,0054 | |||
| IIIN / Insteel Industries, Inc. | 0,02 | 0,12 | 0,68 | 41,51 | 0,0756 | 0,0149 | |||
| SMP / Standard Motor Products, Inc. | 0,02 | 1,35 | 0,67 | 24,91 | 0,0752 | 0,0068 | |||
| BIIB / Biogen Inc. | 0,01 | 0,00 | 0,67 | -8,10 | 0,0749 | -0,0179 | |||
| CCNE / CNB Financial Corporation | 0,03 | 0,87 | 0,67 | 3,57 | 0,0747 | -0,0072 | |||
| MTDR / Matador Resources Company | 0,01 | 0,81 | 0,66 | -5,84 | 0,0740 | -0,0154 | |||
| BCC / Boise Cascade Company | 0,01 | 0,23 | 0,65 | -11,35 | 0,0726 | -0,0204 | |||
| SATS / EchoStar Corporation | 0,02 | 0,00 | 0,63 | 8,40 | 0,0707 | -0,0035 | |||
| ZEUS / Olympic Steel, Inc. | 0,02 | 0,55 | 0,62 | 3,89 | 0,0689 | -0,0064 | |||
| CTRA / Coterra Energy Inc. | 0,02 | 0,88 | 0,60 | -11,49 | 0,0674 | -0,0191 | |||
| FAF / First American Financial Corporation | 0,01 | 0,91 | 0,60 | -5,66 | 0,0672 | -0,0137 | |||
| MRP / Millrose Properties, Inc. | 0,02 | 13,02 | 0,60 | 21,63 | 0,0668 | 0,0043 | |||
| RNR / RenaissanceRe Holdings Ltd. | 0,00 | 0,17 | 0,59 | 1,38 | 0,0656 | -0,0080 | |||
| DIOD / Diodes Incorporated | 0,01 | 0,00 | 0,58 | 22,62 | 0,0650 | 0,0047 | |||
| INMD / InMode Ltd. | 0,04 | 0,00 | 0,58 | -18,56 | 0,0644 | -0,0255 | |||
| EG / Everest Group, Ltd. | 0,00 | 0,54 | 0,57 | -5,93 | 0,0640 | -0,0134 | |||
| DFEV / Dimensional ETF Trust - Dimensional Emerging Markets Value ETF | 0,02 | -4,52 | 0,56 | 6,02 | 0,0631 | -0,0047 | |||
| TGNA / TEGNA Inc. | 0,03 | 0,79 | 0,56 | -7,19 | 0,0621 | -0,0140 | |||
| USNA / USANA Health Sciences, Inc. | 0,02 | 0,00 | 0,55 | 13,20 | 0,0615 | -0,0003 | |||
| TNK / Teekay Tankers Ltd. | 0,01 | 0,66 | 0,54 | 9,84 | 0,0600 | -0,0022 | |||
| RBB / RBB Bancorp | 0,03 | 1,04 | 0,54 | 5,51 | 0,0600 | -0,0047 | |||
| TPH / Tri Pointe Homes, Inc. | 0,02 | 0,00 | 0,52 | 0,19 | 0,0585 | -0,0079 | |||
| DFIV / Dimensional ETF Trust - Dimensional International Value ETF | 0,01 | 1,51 | 0,51 | 10,32 | 0,0575 | -0,0017 | |||
| HCSG / Healthcare Services Group, Inc. | 0,03 | 0,00 | 0,51 | 49,27 | 0,0573 | 0,0136 | |||
| BWA / BorgWarner Inc. | 0,02 | 0,42 | 0,50 | 17,48 | 0,0564 | 0,0018 | |||
| THO / THOR Industries, Inc. | 0,01 | 0,68 | 0,50 | 17,92 | 0,0560 | 0,0020 | |||
| EGY / VAALCO Energy, Inc. | 0,14 | 1,87 | 0,49 | -2,19 | 0,0550 | -0,0089 | |||
| DUHP / Dimensional ETF Trust - Dimensional US High Profitability ETF | 0,01 | 0,33 | 0,47 | 7,55 | 0,0527 | -0,0029 | |||
| CLF / Cleveland-Cliffs Inc. | 0,06 | 0,00 | 0,47 | -7,69 | 0,0525 | -0,0120 | |||
| VSH / Vishay Intertechnology, Inc. | 0,03 | 0,86 | 0,45 | 0,67 | 0,0509 | -0,0065 | |||
| VXUS / Vanguard STAR Funds - Vanguard Total International Stock ETF | 0,01 | 3,80 | 0,40 | 15,36 | 0,0446 | 0,0007 | |||
| AMR / Alpha Metallurgical Resources, Inc. | 0,00 | 0,00 | 0,40 | -10,20 | 0,0444 | -0,0118 | |||
| WLK / Westlake Corporation | 0,01 | 0,59 | 0,39 | -23,68 | 0,0437 | -0,0214 | |||
| PINC / Premier, Inc. | 0,02 | 1,09 | 0,39 | 15,22 | 0,0432 | 0,0005 | |||
| RMR / The RMR Group Inc. | 0,02 | 2,90 | 0,38 | 1,08 | 0,0421 | -0,0053 | |||
| RGR / Sturm, Ruger & Company, Inc. | 0,01 | 0,63 | 0,37 | -7,96 | 0,0414 | -0,0098 | |||
| FF / FutureFuel Corp. | 0,09 | 1,48 | 0,35 | 0,87 | 0,0391 | -0,0049 | |||
| RDUS / Radius Recycling, Inc. | 0,01 | 0,64 | 0,34 | 3,72 | 0,0375 | -0,0037 | |||
| MCFT / MasterCraft Boat Holdings, Inc. | 0,02 | 0,00 | 0,33 | 7,92 | 0,0366 | -0,0020 | |||
| PPBI / Pacific Premier Bancorp, Inc. | 0,02 | 1,73 | 0,32 | 0,64 | 0,0354 | -0,0046 | |||
| DIHP / Dimensional ETF Trust - Dimensional International High Profitability ETF | 0,01 | 0,91 | 0,31 | 10,79 | 0,0345 | -0,0010 | |||
| SWBI / Smith & Wesson Brands, Inc. | 0,03 | 1,45 | 0,30 | -6,79 | 0,0339 | -0,0075 | |||
| MBUU / Malibu Boats, Inc. | 0,01 | 0,00 | 0,27 | 2,24 | 0,0307 | -0,0035 | |||
| FL / Foot Locker, Inc. | 0,01 | 0,00 | 0,25 | 74,48 | 0,0283 | 0,0098 | |||
| PARAA / Paramount Global | 0,01 | 0,21 | 0,24 | 0,83 | 0,0272 | -0,0034 | |||
| CIVI / Civitas Resources, Inc. | 0,01 | 1,99 | 0,24 | -19,59 | 0,0266 | -0,0110 | |||
| JOUT / Johnson Outdoors Inc. | 0,01 | 0,21 | 0,0232 | 0,0232 | |||||
| MEI / Methode Electronics, Inc. | 0,02 | 2,43 | 0,15 | 53,06 | 0,0169 | 0,0043 | |||
| CMDB / Costamare Bulkers Holdings Limited | 0,02 | 0,15 | 0,0167 | 0,0167 | |||||
| X / United States Steel Corporation | 0,00 | -100,00 | 0,00 | 0,0000 | |||||
| DFS / Discover Financial Services | 0,00 | -100,00 | 0,00 | 0,0000 |