Statistiques de base
| Profil de l'initié | Turtle Creek Asset Management Inc. |
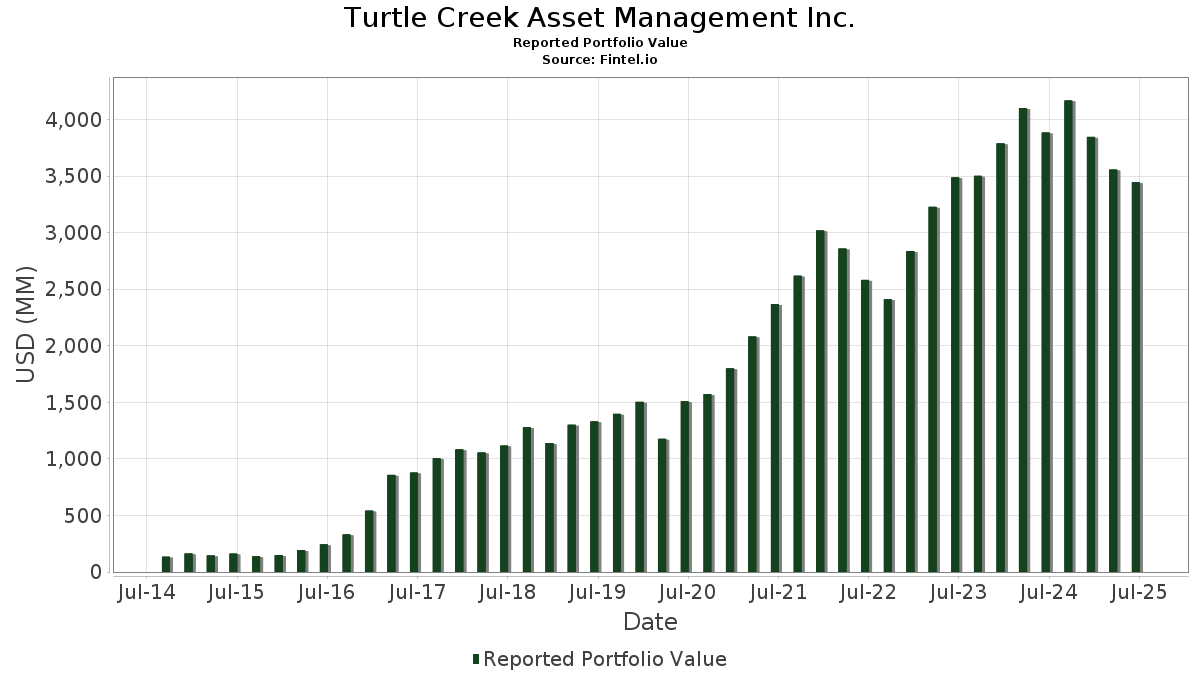
| Valeur du portefeuille | $ 3 444 966 415 |
| Positions actuelles | 41 |
Dernières positions, performances, ASG (à partir des dépôts 13F, 13D)
Turtle Creek Asset Management Inc. a déclaré un total de 41 positions dans ses derniers dépôts auprès de la SEC. La valeur la plus récente du portefeuille est calculée à 3 444 966 415 USD. Les actifs sous gestion réels (ASG) sont cette valeur plus les liquidités (qui ne sont pas divulguées). Les principales positions de Turtle Creek Asset Management Inc. sont ATS Corporation (US:ATS) , Celanese Corporation (US:CE) , Bread Financial Holdings, Inc. (US:BFH) , The Middleby Corporation (US:MIDD) , and Brunswick Corporation (US:BC) . Les nouvelles positions de Turtle Creek Asset Management Inc. incluent Amcor plc (US:AMCR) , ITT Inc. (US:ITT) , Medpace Holdings, Inc. (US:MEDP) , . Les principales industries de Turtle Creek Asset Management Inc. sont "Building Materials, Hardware, Garden Supply, And Mobile Home Dealers" (sic 52) , "Printing, Publishing, And Allied Industries" (sic 27) , and "Electronic And Other Electrical Equipment And Components, Except Computer Equipment" (sic 36) .
Meilleures augmentations ce trimestre
Nous utilisons la variation de l'allocation du portefeuille car il s'agit de l'indicateur le plus significatif. Les changements peuvent être dus à des transactions ou à des variations de prix des actions.
| Titre | Actions (en millions) |
Valeur ($ en millions) |
% du portefeuille | ΔPortefeuille % |
|---|---|---|---|---|
| 2,79 | 134,64 | 3,9082 | 3,6297 | |
| 8,40 | 77,20 | 2,2410 | 2,2410 | |
| 7,59 | 241,99 | 7,0243 | 1,2054 | |
| 2,26 | 171,50 | 4,9783 | 0,9570 | |
| 5,08 | 139,33 | 4,0444 | 0,7948 | |
| 2,99 | 144,75 | 4,2018 | 0,7638 | |
| 1,93 | 173,06 | 5,0236 | 0,5786 | |
| 3,59 | 205,32 | 5,9601 | 0,3210 | |
| 1,25 | 163,24 | 4,7386 | 0,2917 | |
| 2,56 | 98,72 | 2,8656 | 0,2841 |
Principales baisses ce trimestre
Nous utilisons la variation de l'allocation du portefeuille car il s'agit de l'indicateur le plus significatif. Les changements peuvent être dus à des transactions ou à des variations de prix des actions.
| Titre | Actions (en millions) |
Valeur ($ en millions) |
% du portefeuille | ΔPortefeuille % |
|---|---|---|---|---|
| 0,00 | 0,00 | -4,6747 | ||
| 0,01 | 0,72 | 0,0210 | -3,2144 | |
| 3,15 | 92,11 | 2,6738 | -0,9626 | |
| 0,20 | 96,90 | 2,8129 | -0,7571 | |
| 16,22 | 63,57 | 1,8454 | -0,7277 | |
| 2,69 | 180,85 | 5,2497 | -0,4514 | |
| 1,36 | 110,68 | 3,2128 | -0,4474 | |
| 4,23 | 233,92 | 6,7903 | -0,4012 | |
| 1,40 | 202,00 | 5,8636 | -0,3976 | |
| 0,71 | 71,54 | 2,0767 | -0,1499 |
Déclarations 13D/G
Il s'agit d'une liste des déclarations 13D et 13G déposées au cours de la dernière année (le cas échéant). Cliquez sur l'icône du lien pour voir l'historique complet des transactions. Les lignes vertes indiquent de nouvelles positions. Les lignes rouges indiquent des positions fermées.
| Date de dépôt | Formulaire | Titre | Actions précédentes |
Actions actuelles |
ΔActions % | % de participation |
% ΔParticipation | |
|---|---|---|---|---|---|---|---|---|
| 2025-08-14 | CCOI / Cogent Communications Holdings, Inc. | 2 792 711 | 5,70 | |||||
| 2025-08-14 | JELD / JELD-WEN Holding, Inc. | 15 714 721 | 16 625 557 | 5,80 | 19,50 | 5,98 | ||
| 2025-08-14 | ATS / ATS Corporation | 8 906 269 | 7 590 538 | -14,77 | 7,80 | -15,22 | ||
| 2025-08-14 | DOOO / BRP Inc. | 3 616 521 | 2 986 371 | -17,42 | 8,70 | -17,14 | ||
| 2025-05-15 | BC / Brunswick Corporation | 3 765 617 | 5,70 | |||||
| 2025-02-14 | BFH / Bread Financial Holdings, Inc. | 4 583 616 | 3 740 994 | -18,38 | 7,50 | -18,48 |
Déclarations 13F et dépôts de fonds
Ce formulaire a été déposé le 2025-08-14 pour la période de déclaration 2025-06-30. Cliquez sur l'icône du lien pour voir l'historique complet des transactions.
Mettre à niveau pour débloquer les données premium et exporter vers Excel ![]() .
.
| Titre | Type | Prix moyen de l'action | Actions (en millions) |
ΔActions (%) |
ΔActions (%) |
Valeur ($ en millions) |
Portefeuille (%) |
ΔPortefeuille (%) |
|
|---|---|---|---|---|---|---|---|---|---|
| ATS / ATS Corporation | 7,59 | -8,56 | 241,99 | 16,93 | 7,0243 | 1,2054 | |||
| CE / Celanese Corporation | 4,23 | -6,16 | 233,92 | -8,54 | 6,7903 | -0,4012 | |||
| BFH / Bread Financial Holdings, Inc. | 3,59 | -10,24 | 205,32 | 2,38 | 5,9601 | 0,3210 | |||
| MIDD / The Middleby Corporation | 1,40 | -4,26 | 202,00 | -9,29 | 5,8636 | -0,3976 | |||
| BC / Brunswick Corporation | 3,57 | -5,07 | 197,46 | -2,62 | 5,7319 | 0,0304 | |||
| KMX / CarMax, Inc. | 2,69 | 3,40 | 180,85 | -10,81 | 5,2497 | -0,4514 | |||
| TFII / TFI International Inc. | 1,93 | -5,45 | 173,06 | 9,47 | 5,0236 | 0,5786 | |||
| FND / Floor & Decor Holdings, Inc. | 2,26 | 27,03 | 171,50 | 19,91 | 4,9783 | 0,9570 | |||
| CIGI / Colliers International Group Inc. | 1,25 | -4,09 | 163,24 | 3,21 | 4,7386 | 0,2917 | |||
| IR / Ingersoll Rand Inc. | 1,83 | -2,52 | 152,57 | 1,32 | 4,4287 | 0,1947 | |||
| DOOO / BRP Inc. | 2,99 | -17,42 | 144,75 | 18,38 | 4,2018 | 0,7638 | |||
| WSC / WillScot Holdings Corporation | 5,08 | 22,31 | 139,33 | 20,55 | 4,0444 | 0,7948 | |||
| CCOI / Cogent Communications Holdings, Inc. | 2,79 | 1 628,41 | 134,64 | 1 259,14 | 3,9082 | 3,6297 | |||
| BWA / BorgWarner Inc. | 3,58 | -14,79 | 119,81 | -0,42 | 3,4778 | 0,0949 | |||
| SCI / Service Corporation International | 1,36 | -16,23 | 110,68 | -14,98 | 3,2128 | -0,4474 | |||
| MGA / Magna International Inc. | 2,56 | -5,34 | 98,72 | 7,52 | 2,8656 | 0,2841 | |||
| KNSL / Kinsale Capital Group, Inc. | 0,20 | -23,24 | 96,90 | -23,68 | 2,8129 | -0,7571 | |||
| VNT / Vontier Corporation | 2,53 | -10,54 | 93,19 | 0,49 | 2,7051 | 0,0978 | |||
| OTEX / Open Text Corporation | 3,15 | -38,39 | 92,11 | -28,78 | 2,6738 | -0,9626 | |||
| SSNC / SS&C Technologies Holdings, Inc. | 1,00 | -4,15 | 82,47 | -4,99 | 2,3940 | -0,0466 | |||
| ECPG / Encore Capital Group, Inc. | 2,04 | -4,92 | 78,95 | 7,36 | 2,2917 | 0,2242 | |||
| GIL / Gildan Activewear Inc. | 1,59 | -8,57 | 78,33 | 1,81 | 2,2737 | 0,1105 | |||
| AMCR / Amcor plc | 8,40 | 77,20 | 2,2410 | 2,2410 | |||||
| EEFT / Euronet Worldwide, Inc. | 0,71 | -4,79 | 71,54 | -9,66 | 2,0767 | -0,1499 | |||
| JELD / JELD-WEN Holding, Inc. | 16,22 | 5,80 | 63,57 | -30,53 | 1,8454 | -0,7277 | |||
| BLDR / Builders FirstSource, Inc. | 0,07 | 102,16 | 7,77 | 88,82 | 0,2256 | 0,1098 | |||
| PATK / Patrick Industries, Inc. | 0,08 | 5,35 | 7,26 | 14,96 | 0,2108 | 0,0332 | |||
| KNX / Knight-Swift Transportation Holdings Inc. | 0,16 | -5,63 | 7,23 | -4,02 | 0,2099 | -0,0019 | |||
| ITT / ITT Inc. | 0,03 | 4,95 | 0,1437 | 0,1437 | |||||
| MAGN / Magnera Corporation | 0,31 | 0,00 | 3,80 | -33,49 | 0,1104 | -0,0503 | |||
| MEDP / Medpace Holdings, Inc. | 0,01 | 3,45 | 0,1002 | 0,1002 | |||||
| SYF / Synchrony Financial | 0,03 | 1,91 | 0,0554 | 0,0554 | |||||
| WFG / West Fraser Timber Co. Ltd. | 0,02 | 7,48 | 1,26 | 2,43 | 0,0367 | 0,0020 | |||
| SEE / Sealed Air Corporation | 0,03 | 0,00 | 0,99 | 7,46 | 0,0289 | 0,0028 | |||
| CVS / CVS Health Corporation | 0,01 | -99,38 | 0,72 | -99,37 | 0,0210 | -3,2144 | |||
| TNC / Tennant Company | 0,00 | 62,07 | 0,36 | 57,58 | 0,0106 | 0,0041 | |||
| DCBO / Docebo Inc. | 0,01 | 78,95 | 0,30 | 80,98 | 0,0086 | 0,0040 | |||
| CLW / Clearwater Paper Corporation | 0,01 | 10,31 | 0,29 | 18,29 | 0,0085 | 0,0015 | |||
| LVLU / Lulu's Fashion Lounge Holdings, Inc. | 0,06 | 0,00 | 0,25 | 1 022,73 | 0,0072 | 0,0066 | |||
| PNTG / The Pennant Group, Inc. | 0,01 | -27,78 | 0,19 | -14,16 | 0,0056 | -0,0007 | |||
| PHIN / PHINIA Inc. | 0,00 | 33,33 | 0,11 | 39,47 | 0,0031 | 0,0010 | |||
| BERY / Berry Global Group, Inc. | 0,00 | -100,00 | 0,00 | -100,00 | -4,6747 |