Statistiques de base
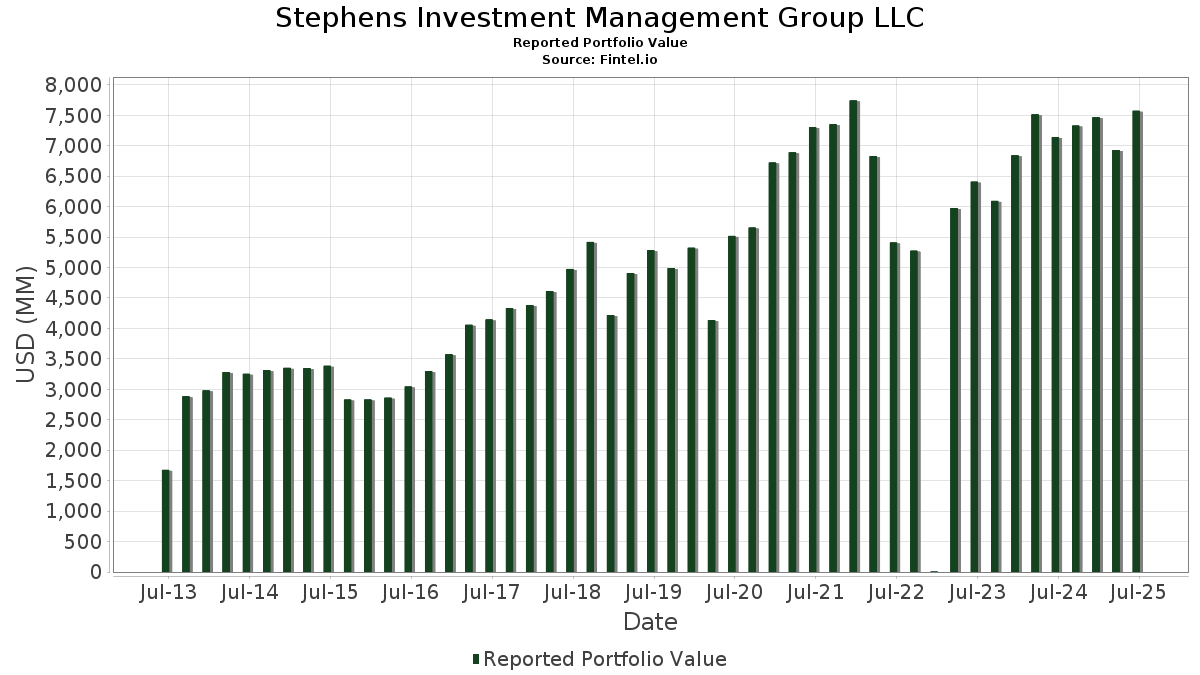
| Valeur du portefeuille | $ 7 573 387 794 |
| Positions actuelles | 178 |
Dernières positions, performances, ASG (à partir des dépôts 13F, 13D)
Stephens Investment Management Group LLC a déclaré un total de 178 positions dans ses derniers dépôts auprès de la SEC. La valeur la plus récente du portefeuille est calculée à 7 573 387 794 USD. Les actifs sous gestion réels (ASG) sont cette valeur plus les liquidités (qui ne sont pas divulguées). Les principales positions de Stephens Investment Management Group LLC sont AeroVironment, Inc. (US:AVAV) , CyberArk Software Ltd. (US:CYBR) , Wingstop Inc. (US:WING) , Guidewire Software, Inc. (US:GWRE) , and Kratos Defense & Security Solutions, Inc. (US:KTOS) . Les nouvelles positions de Stephens Investment Management Group LLC incluent Viking Holdings Ltd (US:VIK) , Exact Sciences Corporation (US:EXAS) , Procore Technologies, Inc. (US:PCOR) , Xometry, Inc. (US:XMTR) , and Credo Technology Group Holding Ltd (US:CRDO) . Les principales industries de Stephens Investment Management Group LLC sont "Mining And Quarrying Of Nonmetallic Minerals, Except Fuels" (sic 14) , "Apparel And Other Finished Products Made From Fabrics And Similar Materials" (sic 23) , and "Motor Freight Transportation And Warehousing" (sic 42) .
Meilleures augmentations ce trimestre
Nous utilisons la variation de l'allocation du portefeuille car il s'agit de l'indicateur le plus significatif. Les changements peuvent être dus à des transactions ou à des variations de prix des actions.
| Titre | Actions (en millions) |
Valeur ($ en millions) |
% du portefeuille | ΔPortefeuille % |
|---|---|---|---|---|
| 0,63 | 180,63 | 2,3850 | 1,0719 | |
| 1,18 | 110,60 | 1,4604 | 0,7096 | |
| 0,74 | 97,69 | 1,2900 | 0,5215 | |
| 0,61 | 32,43 | 0,4282 | 0,4282 | |
| 0,64 | 81,58 | 1,0772 | 0,3799 | |
| 0,53 | 28,17 | 0,3719 | 0,3719 | |
| 0,59 | 84,62 | 1,1173 | 0,3718 | |
| 0,53 | 80,27 | 1,0599 | 0,3379 | |
| 0,55 | 85,13 | 1,1240 | 0,3377 | |
| 0,40 | 135,61 | 1,7906 | 0,3369 |
Principales baisses ce trimestre
Nous utilisons la variation de l'allocation du portefeuille car il s'agit de l'indicateur le plus significatif. Les changements peuvent être dus à des transactions ou à des variations de prix des actions.
| Titre | Actions (en millions) |
Valeur ($ en millions) |
% du portefeuille | ΔPortefeuille % |
|---|---|---|---|---|
| 1,30 | 88,68 | 1,1710 | -0,5799 | |
| 1,31 | 75,65 | 0,9989 | -0,4955 | |
| 1,17 | 44,78 | 0,5913 | -0,4205 | |
| 1,29 | 67,21 | 0,8874 | -0,3436 | |
| 0,00 | 0,58 | 0,0076 | -0,3405 | |
| 0,16 | 76,75 | 1,0134 | -0,3187 | |
| 0,27 | 84,07 | 1,1101 | -0,3013 | |
| 0,41 | 60,34 | 0,7967 | -0,2861 | |
| 0,57 | 134,56 | 1,7768 | -0,2642 | |
| 0,18 | 18,40 | 0,2429 | -0,2604 |
Déclarations 13D/G
Il s'agit d'une liste des déclarations 13D et 13G déposées au cours de la dernière année (le cas échéant). Cliquez sur l'icône du lien pour voir l'historique complet des transactions. Les lignes vertes indiquent de nouvelles positions. Les lignes rouges indiquent des positions fermées.
| Date de dépôt | Formulaire | Titre | Actions précédentes |
Actions actuelles |
ΔActions % | % de participation |
% ΔParticipation | |
|---|---|---|---|---|---|---|---|---|
| 2025-08-13 | ECPG / Encore Capital Group, Inc. | 1 248 831 | 5,30 |
Déclarations 13F et dépôts de fonds
Ce formulaire a été déposé le 2025-07-30 pour la période de déclaration 2025-06-30. Cliquez sur l'icône du lien pour voir l'historique complet des transactions.
Mettre à niveau pour débloquer les données premium et exporter vers Excel ![]() .
.
| Titre | Type | Prix moyen de l'action | Actions (en millions) |
ΔActions (%) |
ΔActions (%) |
Valeur ($ en millions) |
Portefeuille (%) |
ΔPortefeuille (%) |
|
|---|---|---|---|---|---|---|---|---|---|
| AVAV / AeroVironment, Inc. | 0,63 | -16,98 | 180,63 | 98,49 | 2,3850 | 1,0719 | |||
| CYBR / CyberArk Software Ltd. | 0,34 | -7,17 | 138,47 | 11,74 | 1,8283 | 0,0402 | |||
| WING / Wingstop Inc. | 0,40 | -9,83 | 135,61 | 34,61 | 1,7906 | 0,3369 | |||
| GWRE / Guidewire Software, Inc. | 0,57 | -24,30 | 134,56 | -4,86 | 1,7768 | -0,2642 | |||
| KTOS / Kratos Defense & Security Solutions, Inc. | 2,58 | -33,18 | 119,82 | 4,54 | 1,5821 | -0,0718 | |||
| HEIA / Heico Corp. - Class A | 0,46 | -15,53 | 118,57 | 3,60 | 1,5657 | -0,0859 | |||
| EXEL / Exelixis, Inc. | 2,64 | -12,40 | 116,46 | 4,57 | 1,5378 | -0,0693 | |||
| FCFS / FirstCash Holdings, Inc. | 0,85 | -4,49 | 114,72 | 7,27 | 1,5148 | -0,0284 | |||
| HOOD / Robinhood Markets, Inc. | 1,18 | -5,51 | 110,60 | 112,58 | 1,4604 | 0,7096 | |||
| RBC / RBC Bearings Incorporated | 0,29 | -6,77 | 109,87 | 11,50 | 1,4507 | 0,0288 | |||
| OLLI / Ollie's Bargain Outlet Holdings, Inc. | 0,82 | 0,84 | 107,54 | 14,20 | 1,4200 | 0,0612 | |||
| HQY / HealthEquity, Inc. | 1,02 | -4,97 | 106,47 | 12,66 | 1,4059 | 0,0421 | |||
| FTI / TechnipFMC plc | 3,08 | -10,32 | 106,23 | -2,54 | 1,4027 | -0,1702 | |||
| LYV / Live Nation Entertainment, Inc. | 0,66 | -6,09 | 99,84 | 8,80 | 1,3183 | -0,0059 | |||
| EXE / Expand Energy Corporation | 0,85 | -12,35 | 99,48 | -7,93 | 1,3136 | -0,2455 | |||
| TW / Tradeweb Markets Inc. | 0,68 | -6,17 | 99,17 | -7,47 | 1,3095 | -0,2370 | |||
| TTWO / Take-Two Interactive Software, Inc. | 0,41 | -18,08 | 99,06 | -4,01 | 1,3079 | -0,1812 | |||
| FIVE / Five Below, Inc. | 0,74 | 4,78 | 97,69 | 83,45 | 1,2900 | 0,5215 | |||
| BURL / Burlington Stores, Inc. | 0,40 | -3,17 | 93,88 | -5,49 | 1,2396 | -0,1937 | |||
| MANH / Manhattan Associates, Inc. | 0,46 | 2,40 | 90,43 | 16,86 | 1,1941 | 0,0774 | |||
| EA / Electronic Arts Inc. | 0,56 | -5,54 | 88,72 | 4,38 | 1,1715 | -0,0550 | |||
| RYAN / Ryan Specialty Holdings, Inc. | 1,30 | -20,59 | 88,68 | -26,91 | 1,1710 | -0,5799 | |||
| DPZ / Domino's Pizza, Inc. | 0,19 | -5,31 | 86,46 | -7,13 | 1,1416 | -0,2018 | |||
| PLMR / Palomar Holdings, Inc. | 0,56 | -16,92 | 86,31 | -6,52 | 1,1397 | -0,1926 | |||
| AXON / Axon Enterprise, Inc. | 0,10 | -38,84 | 85,83 | -3,72 | 1,1333 | -0,1531 | |||
| IRTC / iRhythm Technologies, Inc. | 0,55 | 6,21 | 85,13 | 56,21 | 1,1240 | 0,3377 | |||
| VRNS / Varonis Systems, Inc. | 1,67 | 4,10 | 84,77 | 30,61 | 1,1194 | 0,1828 | |||
| BWXT / BWX Technologies, Inc. | 0,59 | 12,15 | 84,62 | 63,78 | 1,1173 | 0,3718 | |||
| VRSK / Verisk Analytics, Inc. | 0,27 | -17,88 | 84,07 | -14,05 | 1,1101 | -0,3013 | |||
| TYL / Tyler Technologies, Inc. | 0,14 | -5,67 | 84,01 | -3,81 | 1,1093 | -0,1510 | |||
| TOST / Toast, Inc. | 1,89 | -7,55 | 83,81 | 23,44 | 1,1066 | 0,1269 | |||
| RMD / ResMed Inc. | 0,32 | -9,42 | 83,66 | 4,40 | 1,1047 | -0,0516 | |||
| VRT / Vertiv Holdings Co | 0,64 | -5,08 | 81,58 | 68,83 | 1,0772 | 0,3799 | |||
| EVR / Evercore Inc. | 0,30 | 4,64 | 80,60 | 41,47 | 1,0642 | 0,2421 | |||
| BOOT / Boot Barn Holdings, Inc. | 0,53 | 13,38 | 80,27 | 60,42 | 1,0599 | 0,3379 | |||
| PIPR / Piper Sandler Companies | 0,28 | 11,59 | 77,70 | 25,23 | 1,0259 | 0,1307 | |||
| MTSI / MACOM Technology Solutions Holdings, Inc. | 0,54 | 8,35 | 77,36 | 54,67 | 1,0215 | 0,2997 | |||
| KNSL / Kinsale Capital Group, Inc. | 0,16 | -16,38 | 76,75 | -16,86 | 1,0134 | -0,3187 | |||
| DXCM / DexCom, Inc. | 0,88 | 4,37 | 76,63 | 33,41 | 1,0118 | 0,1830 | |||
| BRBR / BellRing Brands, Inc. | 1,31 | -6,11 | 75,65 | -26,95 | 0,9989 | -0,4955 | |||
| BFAM / Bright Horizons Family Solutions Inc. | 0,59 | -4,03 | 72,69 | -6,64 | 0,9598 | -0,1636 | |||
| LGND / Ligand Pharmaceuticals Incorporated | 0,60 | -0,40 | 68,76 | 7,69 | 0,9079 | -0,0134 | |||
| HALO / Halozyme Therapeutics, Inc. | 1,29 | -3,37 | 67,21 | -21,22 | 0,8874 | -0,3436 | |||
| RGEN / Repligen Corporation | 0,52 | -3,09 | 65,03 | -5,27 | 0,8587 | -0,1319 | |||
| PTC / PTC Inc. | 0,37 | -5,19 | 63,27 | 5,45 | 0,8354 | -0,0304 | |||
| PSTG / Pure Storage, Inc. | 1,09 | -4,64 | 62,74 | 24,03 | 0,8285 | 0,0985 | |||
| CSGP / CoStar Group, Inc. | 0,77 | 4,66 | 62,17 | 6,21 | 0,8209 | -0,0238 | |||
| ICLR / ICON Public Limited Company | 0,41 | -3,26 | 60,34 | -19,59 | 0,7967 | -0,2861 | |||
| ROK / Rockwell Automation, Inc. | 0,17 | -6,64 | 57,11 | 20,03 | 0,7542 | 0,0675 | |||
| TSCO / Tractor Supply Company | 1,08 | -6,62 | 56,90 | -10,57 | 0,7513 | -0,1668 | |||
| SITE / SiteOne Landscape Supply, Inc. | 0,46 | -2,01 | 55,85 | -2,41 | 0,7375 | -0,0884 | |||
| IDXX / IDEXX Laboratories, Inc. | 0,10 | -7,23 | 55,43 | 18,48 | 0,7319 | 0,0568 | |||
| CIEN / Ciena Corporation | 0,67 | -1,42 | 54,58 | 32,67 | 0,7207 | 0,1271 | |||
| MCHP / Microchip Technology Incorporated | 0,77 | -0,86 | 54,06 | 44,12 | 0,7138 | 0,1725 | |||
| ASO / Academy Sports and Outdoors, Inc. | 1,18 | 23,94 | 52,76 | 21,76 | 0,6967 | 0,0714 | |||
| MGY / Magnolia Oil & Gas Corporation | 2,30 | -4,90 | 51,61 | -15,36 | 0,6814 | -0,1984 | |||
| CWAN / Clearwater Analytics Holdings, Inc. | 2,29 | 32,92 | 50,14 | 8,77 | 0,6621 | -0,0032 | |||
| AZEK / The AZEK Company Inc. | 0,92 | -0,18 | 50,07 | 10,97 | 0,6611 | 0,0100 | |||
| SUPN / Supernus Pharmaceuticals, Inc. | 1,58 | -9,05 | 49,84 | -12,47 | 0,6580 | -0,1635 | |||
| RDDT / Reddit, Inc. | 0,33 | 35,01 | 49,73 | 93,79 | 0,6566 | 0,2863 | |||
| HUBB / Hubbell Incorporated | 0,12 | -5,90 | 49,25 | 16,14 | 0,6503 | 0,0384 | |||
| ECPG / Encore Capital Group, Inc. | 1,25 | 9,12 | 48,34 | 23,22 | 0,6383 | 0,0722 | |||
| OKTA / Okta, Inc. | 0,46 | -7,44 | 46,18 | -12,06 | 0,6098 | -0,1480 | |||
| SLAB / Silicon Laboratories Inc. | 0,31 | 9,44 | 46,07 | 43,27 | 0,6083 | 0,1443 | |||
| FN / Fabrinet | 0,16 | -1,24 | 45,77 | 47,35 | 0,6044 | 0,1561 | |||
| AR / Antero Resources Corporation | 1,13 | -5,04 | 45,70 | -5,42 | 0,6034 | -0,0938 | |||
| SDGR / Schrödinger, Inc. | 2,26 | 14,79 | 45,50 | 17,00 | 0,6008 | 0,0396 | |||
| AAON / AAON, Inc. | 0,61 | 0,76 | 44,80 | -4,88 | 0,5915 | -0,0881 | |||
| VNOM / Viper Energy, Inc. | 1,17 | -24,37 | 44,78 | -36,13 | 0,5913 | -0,4205 | |||
| BCPC / Balchem Corporation | 0,28 | -0,11 | 43,84 | -4,20 | 0,5789 | -0,0815 | |||
| TECH / Bio-Techne Corporation | 0,85 | 3,39 | 43,50 | -9,27 | 0,5744 | -0,1175 | |||
| NTNX / Nutanix, Inc. | 0,56 | -6,91 | 42,78 | 1,93 | 0,5649 | -0,0408 | |||
| PODD / Insulet Corporation | 0,13 | 11,79 | 42,05 | 33,75 | 0,5553 | 0,1016 | |||
| LSCC / Lattice Semiconductor Corporation | 0,86 | -3,36 | 42,02 | -9,73 | 0,5548 | -0,1169 | |||
| MEDP / Medpace Holdings, Inc. | 0,13 | -2,26 | 41,99 | 0,68 | 0,5544 | -0,0474 | |||
| POWI / Power Integrations, Inc. | 0,75 | 1,49 | 41,92 | 12,34 | 0,5536 | 0,0151 | |||
| MNDY / monday.com Ltd. | 0,13 | -5,58 | 41,43 | 22,11 | 0,5470 | 0,0575 | |||
| HOLX / Hologic, Inc. | 0,61 | -19,78 | 39,99 | -15,37 | 0,5280 | -0,1538 | |||
| TREX / Trex Company, Inc. | 0,73 | -2,55 | 39,50 | -8,79 | 0,5216 | -0,1033 | |||
| GMED / Globus Medical, Inc. | 0,65 | 0,55 | 38,28 | -18,93 | 0,5054 | -0,1759 | |||
| SG / Sweetgreen, Inc. | 2,57 | 89,51 | 38,20 | 12,71 | 0,5045 | 0,0153 | |||
| S / SentinelOne, Inc. | 1,96 | -1,08 | 35,86 | -0,54 | 0,4736 | -0,0468 | |||
| U / Unity Software Inc. | 1,47 | 77,63 | 35,49 | 119,44 | 0,4686 | 0,2352 | |||
| DT / Dynatrace, Inc. | 0,64 | 12,57 | 35,22 | 31,81 | 0,4650 | 0,0795 | |||
| SAIL / SailPoint, Inc. | 1,51 | 22,27 | 34,60 | 49,08 | 0,4569 | 0,1220 | |||
| MMS / Maximus, Inc. | 0,48 | 6,31 | 33,97 | 9,45 | 0,4485 | 0,0007 | |||
| GNRC / Generac Holdings Inc. | 0,23 | -4,47 | 33,57 | 8,02 | 0,4433 | -0,0052 | |||
| TENB / Tenable Holdings, Inc. | 0,98 | 2,77 | 33,16 | -0,76 | 0,4378 | -0,0443 | |||
| IBP / Installed Building Products, Inc. | 0,18 | -1,01 | 33,07 | 4,11 | 0,4367 | -0,0217 | |||
| BRZE / Braze, Inc. | 1,17 | 45,93 | 32,87 | 13,65 | 0,4341 | 0,0167 | |||
| SPOT / Spotify Technology S.A. | 0,04 | -29,44 | 32,82 | -1,56 | 0,4333 | -0,0477 | |||
| AMBA / Ambarella, Inc. | 0,49 | -1,17 | 32,63 | 29,73 | 0,4309 | 0,0679 | |||
| POOL / Pool Corporation | 0,11 | -4,47 | 32,60 | -12,53 | 0,4305 | -0,1074 | |||
| MGNI / Magnite, Inc. | 1,35 | 42,02 | 32,56 | 200,24 | 0,4300 | 0,2735 | |||
| VIK / Viking Holdings Ltd | 0,61 | 32,43 | 0,4282 | 0,4282 | |||||
| TNDM / Tandem Diabetes Care, Inc. | 1,74 | 1,81 | 32,39 | -0,95 | 0,4277 | -0,0442 | |||
| GTLB / GitLab Inc. | 0,71 | -4,67 | 32,01 | -8,50 | 0,4226 | -0,0821 | |||
| CGNX / Cognex Corporation | 0,99 | -4,22 | 31,56 | 1,85 | 0,4167 | -0,0304 | |||
| DRS / Leonardo DRS, Inc. | 0,68 | -12,22 | 31,51 | 24,09 | 0,4161 | 0,0496 | |||
| SAIA / Saia, Inc. | 0,11 | 4,30 | 31,18 | -18,22 | 0,4117 | -0,1384 | |||
| KRNT / Kornit Digital Ltd. | 1,53 | 12,82 | 30,40 | 17,72 | 0,4014 | 0,0288 | |||
| JBHT / J.B. Hunt Transport Services, Inc. | 0,21 | -6,49 | 29,86 | -9,24 | 0,3943 | -0,0805 | |||
| EXAS / Exact Sciences Corporation | 0,53 | 28,17 | 0,3719 | 0,3719 | |||||
| ILMN / Illumina, Inc. | 0,28 | -5,56 | 26,64 | 13,57 | 0,3517 | 0,0133 | |||
| AZTA / Azenta, Inc. | 0,81 | 0,42 | 24,84 | -10,77 | 0,3281 | -0,0737 | |||
| VIRT / Virtu Financial, Inc. | 0,55 | 12,89 | 24,55 | 32,64 | 0,3242 | 0,0571 | |||
| ANSS / ANSYS, Inc. | 0,07 | -7,72 | 24,24 | 2,39 | 0,3201 | -0,0216 | |||
| CPRT / Copart, Inc. | 0,48 | -17,59 | 23,50 | -28,54 | 0,3103 | -0,1642 | |||
| EZPW / EZCORP, Inc. | 1,67 | 0,11 | 23,21 | -5,60 | 0,3065 | -0,0483 | |||
| VSEC / VSE Corporation | 0,18 | -0,02 | 22,99 | 9,14 | 0,3035 | -0,0004 | |||
| CDNS / Cadence Design Systems, Inc. | 0,07 | -25,13 | 21,92 | -9,29 | 0,2894 | -0,0592 | |||
| PCOR / Procore Technologies, Inc. | 0,31 | 20,88 | 0,2757 | 0,2757 | |||||
| RBRK / Rubrik, Inc. | 0,23 | -10,86 | 20,57 | 30,96 | 0,2717 | 0,0450 | |||
| DSGX / The Descartes Systems Group Inc. | 0,20 | -0,28 | 20,39 | 0,53 | 0,2692 | -0,0235 | |||
| LASR / nLIGHT, Inc. | 1,03 | 13,68 | 20,36 | 187,92 | 0,2688 | 0,1668 | |||
| ROST / Ross Stores, Inc. | 0,16 | -14,32 | 20,32 | -14,47 | 0,2683 | -0,0745 | |||
| FAST / Fastenal Company | 0,45 | 88,00 | 18,98 | 1,81 | 0,2507 | -0,0184 | |||
| VST / Vistra Corp. | 0,10 | -18,13 | 18,60 | 35,11 | 0,2455 | 0,0469 | |||
| ONTO / Onto Innovation Inc. | 0,18 | -36,59 | 18,40 | -47,25 | 0,2429 | -0,2604 | |||
| POWL / Powell Industries, Inc. | 0,08 | 13,80 | 17,72 | 40,61 | 0,2340 | 0,0521 | |||
| KRMN / Karman Holdings Inc. | 0,35 | 32,66 | 17,47 | 99,95 | 0,2307 | 0,1046 | |||
| SMPL / The Simply Good Foods Company | 0,54 | 28,50 | 17,08 | 17,70 | 0,2255 | 0,0161 | |||
| VEEV / Veeva Systems Inc. | 0,06 | -17,43 | 16,73 | 2,66 | 0,2209 | -0,0142 | |||
| RVLV / Revolve Group, Inc. | 0,82 | 28,60 | 16,40 | 19,99 | 0,2166 | 0,0193 | |||
| LHX / L3Harris Technologies, Inc. | 0,06 | -17,80 | 15,70 | -1,49 | 0,2073 | -0,0227 | |||
| PRO / PROS Holdings, Inc. | 0,99 | -10,00 | 15,53 | -25,94 | 0,2050 | -0,0975 | |||
| AGYS / Agilysys, Inc. | 0,13 | 33,03 | 15,18 | 110,25 | 0,2004 | 0,0962 | |||
| MRVL / Marvell Technology, Inc. | 0,19 | -30,89 | 14,79 | -13,12 | 0,1953 | -0,0504 | |||
| SPSC / SPS Commerce, Inc. | 0,11 | 0,07 | 14,73 | 2,60 | 0,1945 | -0,0127 | |||
| ZETA / Zeta Global Holdings Corp. | 0,94 | 15,60 | 14,48 | 32,06 | 0,1913 | 0,0330 | |||
| MEG / Montrose Environmental Group, Inc. | 0,66 | 44,59 | 14,38 | 121,97 | 0,1898 | 0,0964 | |||
| BKR / Baker Hughes Company | 0,35 | -18,15 | 13,35 | -28,60 | 0,1763 | -0,0935 | |||
| LNN / Lindsay Corporation | 0,09 | 7,65 | 13,33 | 22,74 | 0,1760 | 0,0193 | |||
| XMTR / Xometry, Inc. | 0,39 | 13,29 | 0,1755 | 0,1755 | |||||
| COHR / Coherent Corp. | 0,15 | -8,67 | 13,24 | 25,46 | 0,1748 | 0,0225 | |||
| ROP / Roper Technologies, Inc. | 0,02 | -18,64 | 12,96 | -21,78 | 0,1711 | -0,0679 | |||
| RMBS / Rambus Inc. | 0,20 | 0,75 | 12,49 | 24,59 | 0,1649 | 0,0203 | |||
| FWRG / First Watch Restaurant Group, Inc. | 0,77 | 8,51 | 12,33 | 4,53 | 0,1629 | -0,0074 | |||
| FTNT / Fortinet, Inc. | 0,12 | -18,74 | 12,25 | -10,76 | 0,1617 | -0,0363 | |||
| ADSK / Autodesk, Inc. | 0,04 | -14,98 | 11,68 | 0,53 | 0,1542 | -0,0134 | |||
| BLFS / BioLife Solutions, Inc. | 0,53 | 6,94 | 11,45 | 0,85 | 0,1512 | -0,0126 | |||
| PANW / Palo Alto Networks, Inc. | 0,06 | -18,00 | 11,29 | -1,66 | 0,1491 | -0,0166 | |||
| HSIC / Henry Schein, Inc. | 0,14 | -15,31 | 10,57 | -9,68 | 0,1396 | -0,0293 | |||
| TER / Teradyne, Inc. | 0,12 | -15,80 | 10,56 | -8,34 | 0,1395 | -0,0268 | |||
| HUBG / Hub Group, Inc. | 0,31 | 0,18 | 10,49 | -9,90 | 0,1386 | -0,0295 | |||
| CRWD / CrowdStrike Holdings, Inc. | 0,02 | -38,64 | 10,16 | -11,36 | 0,1342 | -0,0313 | |||
| KEYS / Keysight Technologies, Inc. | 0,06 | -15,98 | 10,15 | -8,08 | 0,1341 | -0,0253 | |||
| FANG / Diamondback Energy, Inc. | 0,07 | -23,14 | 9,88 | -33,95 | 0,1305 | -0,0854 | |||
| CRDO / Credo Technology Group Holding Ltd | 0,10 | 9,25 | 0,1222 | 0,1222 | |||||
| HSTM / HealthStream, Inc. | 0,32 | 0,30 | 8,84 | -13,75 | 0,1167 | -0,0312 | |||
| MDB / MongoDB, Inc. | 0,04 | -15,90 | 8,46 | 0,68 | 0,1118 | -0,0095 | |||
| GLBE / Global-E Online Ltd. | 0,24 | 38,52 | 7,90 | 30,30 | 0,1043 | 0,0168 | |||
| GENI / Genius Sports Limited | 0,75 | 7,84 | 0,1036 | 0,1036 | |||||
| TITN / Titan Machinery Inc. | 0,38 | 7,61 | 0,1004 | 0,1004 | |||||
| SEI / Solaris Energy Infrastructure, Inc. | 0,27 | 0,97 | 7,59 | 31,27 | 0,1002 | 0,0168 | |||
| GPOR / Gulfport Energy Corporation | 0,04 | 7,49 | 0,0989 | 0,0989 | |||||
| BROS / Dutch Bros Inc. | 0,11 | 7,28 | 0,0961 | 0,0961 | |||||
| PAR / PAR Technology Corporation | 0,10 | 7,14 | 0,0943 | 0,0943 | |||||
| INTA / Intapp, Inc. | 0,12 | -35,84 | 6,38 | -43,26 | 0,0842 | -0,0780 | |||
| FOLD / Amicus Therapeutics, Inc. | 0,83 | 35,95 | 4,77 | -4,52 | 0,0630 | -0,0091 | |||
| SLP / Simulations Plus, Inc. | 0,27 | 4,69 | 0,0619 | 0,0619 | |||||
| CHEF / The Chefs' Warehouse, Inc. | 0,07 | -66,56 | 4,37 | -60,82 | 0,0577 | -0,1032 | |||
| PI / Impinj, Inc. | 0,04 | 3,97 | 0,0525 | 0,0525 | |||||
| MSFT / Microsoft Corporation | 0,00 | -2,34 | 1,23 | 29,46 | 0,0162 | 0,0025 | |||
| NVDD / Direxion Shares ETF Trust - Direxion Daily NVDA Bear 1X Shares | 0,01 | 0,00 | 1,10 | 45,68 | 0,0145 | 0,0036 | |||
| TSM / Taiwan Semiconductor Manufacturing Company Limited - Depositary Receipt (Common Stock) | 0,00 | 0,00 | 0,81 | 36,59 | 0,0107 | 0,0021 | |||
| AMZN / Amazon.com, Inc. | 0,00 | 0,00 | 0,74 | 15,36 | 0,0097 | 0,0005 | |||
| PLTR / Palantir Technologies Inc. | 0,00 | -98,52 | 0,58 | -97,61 | 0,0076 | -0,3405 | |||
| MELI / MercadoLibre, Inc. | 0,00 | 0,00 | 0,56 | 33,98 | 0,0074 | 0,0014 | |||
| META / Meta Platforms, Inc. | 0,00 | 34,54 | 0,52 | 72,19 | 0,0069 | 0,0025 | |||
| CME / CME Group Inc. | 0,00 | 0,00 | 0,34 | 3,63 | 0,0045 | -0,0002 | |||
| GOOGL / Alphabet Inc. | 0,00 | -12,57 | 0,34 | -0,29 | 0,0045 | -0,0004 | |||
| TJX / The TJX Companies, Inc. | 0,00 | 0,00 | 0,33 | 1,56 | 0,0043 | -0,0003 | |||
| RTX / RTX Corporation | 0,00 | 0,00 | 0,31 | 10,11 | 0,0040 | 0,0000 | |||
| ASML / ASML Holding N.V. - Depositary Receipt (Common Stock) | 0,00 | 0,00 | 0,29 | 20,92 | 0,0038 | 0,0004 | |||
| SHOP / Shopify Inc. | 0,00 | 0,26 | 0,0034 | 0,0034 | |||||
| SPGI / S&P Global Inc. | 0,00 | 0,00 | 0,25 | 4,10 | 0,0034 | -0,0002 | |||
| ISRG / Intuitive Surgical, Inc. | 0,00 | 0,00 | 0,25 | 10,04 | 0,0033 | 0,0000 | |||
| GLOB / Globant S.A. | 0,00 | -100,00 | 0,00 | 0,0000 | |||||
| NEOG / Neogen Corporation | 0,00 | -100,00 | 0,00 | 0,0000 |