Statistiques de base
| Profil de l'initié | STATE FARM MUTUAL AUTOMOBILE INSURANCE CO |
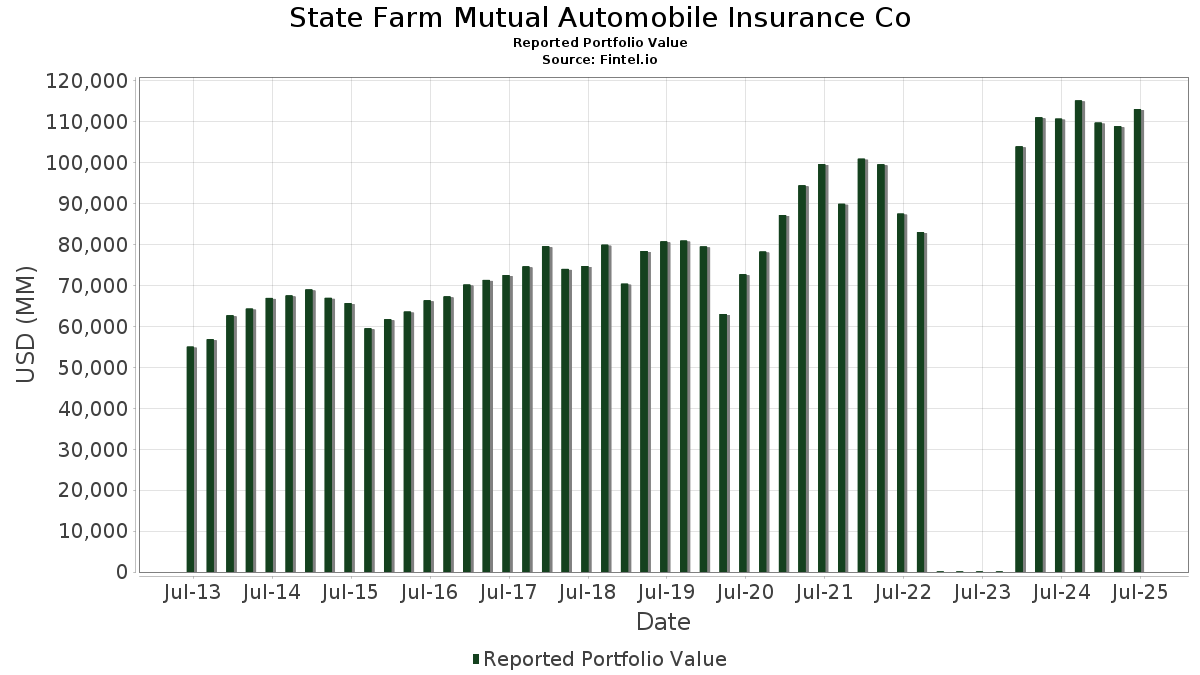
| Valeur du portefeuille | $ 113 084 911 147 |
| Positions actuelles | 120 |
Dernières positions, performances, ASG (à partir des dépôts 13F, 13D)
State Farm Mutual Automobile Insurance Co a déclaré un total de 120 positions dans ses derniers dépôts auprès de la SEC. La valeur la plus récente du portefeuille est calculée à 113 084 911 147 USD. Les actifs sous gestion réels (ASG) sont cette valeur plus les liquidités (qui ne sont pas divulguées). Les principales positions de State Farm Mutual Automobile Insurance Co sont Eli Lilly and Company (US:LLY) , Caterpillar Inc. (US:CAT) , Microsoft Corporation (US:MSFT) , Illinois Tool Works Inc. (US:ITW) , and Apple Inc. (US:AAPL) . Les nouvelles positions de State Farm Mutual Automobile Insurance Co incluent iShares Trust - iShares National Muni Bond ETF (US:MUB) , Vanguard Index Funds - Vanguard Value ETF (US:VTV) , . Les principales industries de State Farm Mutual Automobile Insurance Co sont "Wholesale Trade-durable Goods" (sic 50) , "Printing, Publishing, And Allied Industries" (sic 27) , and "Building Materials, Hardware, Garden Supply, And Mobile Home Dealers" (sic 52) .
Meilleures augmentations ce trimestre
Nous utilisons la variation de l'allocation du portefeuille car il s'agit de l'indicateur le plus significatif. Les changements peuvent être dus à des transactions ou à des variations de prix des actions.
| Titre | Actions (en millions) |
Valeur ($ en millions) |
% du portefeuille | ΔPortefeuille % |
|---|---|---|---|---|
| 41,39 | 3 316,18 | 2,9325 | 0,1909 | |
| 51,80 | 523,70 | 0,4631 | 0,0331 | |
| 0,06 | 36,91 | 0,0209 | 0,0126 | |
| 0,47 | 10,73 | 0,0061 | 0,0038 | |
| 0,07 | 9,38 | 0,0083 | 0,0021 | |
| 0,02 | 3,20 | 0,0018 | 0,0015 | |
| 0,02 | 1,81 | 0,0016 | 0,0014 | |
| 0,06 | 5,38 | 0,0030 | 0,0012 | |
| 0,06 | 3,13 | 0,0018 | 0,0011 | |
| 0,03 | 1,99 | 0,0011 | 0,0005 |
Principales baisses ce trimestre
Nous utilisons la variation de l'allocation du portefeuille car il s'agit de l'indicateur le plus significatif. Les changements peuvent être dus à des transactions ou à des variations de prix des actions.
| Titre | Actions (en millions) |
Valeur ($ en millions) |
% du portefeuille | ΔPortefeuille % |
|---|---|---|---|---|
| 12,51 | 9 754,62 | 5,5224 | -3,9774 | |
| 25,03 | 5 135,36 | 2,9073 | -2,2513 | |
| 31,68 | 4 838,43 | 2,7392 | -2,0844 | |
| 21,03 | 5 199,64 | 2,9437 | -1,8456 | |
| 30,52 | 3 290,09 | 1,8626 | -1,4704 | |
| 17,67 | 6 859,45 | 3,8833 | -1,4677 | |
| 12,00 | 3 385,16 | 1,9164 | -1,3582 | |
| 15,80 | 2 517,38 | 1,4252 | -1,0475 | |
| 15,89 | 2 478,50 | 1,4031 | -0,9997 | |
| 39,25 | 3 837,78 | 2,1727 | -0,9913 |
Déclarations 13D/G
Il s'agit d'une liste des déclarations 13D et 13G déposées au cours de la dernière année (le cas échéant). Cliquez sur l'icône du lien pour voir l'historique complet des transactions. Les lignes vertes indiquent de nouvelles positions. Les lignes rouges indiquent des positions fermées.
| Date de dépôt | Formulaire | Titre | Actions précédentes |
Actions actuelles |
ΔActions % | % de participation |
% ΔParticipation | |
|---|---|---|---|---|---|---|---|---|
| 2025-04-15 | ADT / ADT Inc. | 133 333 333 | 133 333 333 | 0,00 | 16,83 | 8,37 |
Déclarations 13F et dépôts de fonds
Ce formulaire a été déposé le 2025-08-12 pour la période de déclaration 2025-06-30. Cliquez sur l'icône du lien pour voir l'historique complet des transactions.
Mettre à niveau pour débloquer les données premium et exporter vers Excel ![]() .
.
| Titre | Type | Prix moyen de l'action | Actions (en millions) |
ΔActions (%) |
ΔActions (%) |
Valeur ($ en millions) |
Portefeuille (%) |
ΔPortefeuille (%) |
|
|---|---|---|---|---|---|---|---|---|---|
| LLY / Eli Lilly and Company | 12,51 | -0,10 | 9 754,62 | -5,71 | 5,5224 | -3,9774 | |||
| CAT / Caterpillar Inc. | 17,67 | 0,00 | 6 859,45 | 17,71 | 3,8833 | -1,4677 | |||
| MSFT / Microsoft Corporation | 10,84 | -0,29 | 5 390,37 | 32,11 | 3,0516 | -0,6949 | |||
| ITW / Illinois Tool Works Inc. | 21,03 | 0,00 | 5 199,64 | -0,31 | 2,9437 | -1,8456 | |||
| AAPL / Apple Inc. | 25,03 | -1,03 | 5 135,36 | -8,59 | 2,9073 | -2,2513 | |||
| JNJ / Johnson & Johnson | 31,68 | 0,00 | 4 838,43 | -7,89 | 2,7392 | -2,0844 | |||
| WMT / Walmart Inc. | 39,25 | 0,00 | 3 837,78 | 11,38 | 2,1727 | -0,9913 | |||
| DIS / The Walt Disney Company | 27,39 | -1,12 | 3 396,13 | 24,23 | 1,9226 | -0,5875 | |||
| APD / Air Products and Chemicals, Inc. | 12,00 | -0,75 | 3 385,16 | -5,07 | 1,9164 | -1,3582 | |||
| WFC / Wells Fargo & Company | 41,39 | -0,48 | 3 316,18 | 11,07 | 2,9325 | 0,1909 | |||
| XOM / Exxon Mobil Corporation | 30,52 | 0,00 | 3 290,09 | -9,36 | 1,8626 | -1,4704 | |||
| NUE / Nucor Corporation | 24,50 | 0,00 | 3 173,25 | 7,64 | 1,7965 | -0,9104 | |||
| PG / The Procter & Gamble Company | 15,80 | 0,00 | 2 517,38 | -6,51 | 1,4252 | -1,0475 | |||
| VMC / Vulcan Materials Company | 9,55 | 0,00 | 2 492,05 | 11,80 | 1,4108 | -0,6361 | |||
| ZTS / Zoetis Inc. | 15,89 | 0,00 | 2 478,50 | -5,28 | 1,4031 | -0,9997 | |||
| ADM / Archer-Daniels-Midland Company | 46,80 | 0,00 | 2 469,92 | 9,94 | 1,3983 | -0,6647 | |||
| INTU / Intuit Inc. | 3,06 | 0,00 | 2 408,99 | 28,28 | 1,3638 | -0,3606 | |||
| ASML / ASML Holding N.V. - Depositary Receipt (Common Stock) | 2,76 | 0,00 | 2 210,37 | 20,94 | 1,2514 | -0,4269 | |||
| CVX / Chevron Corporation | 13,33 | 0,00 | 1 909,33 | -14,41 | 1,0809 | -0,9674 | |||
| GOOGL / Alphabet Inc. | 10,78 | 0,00 | 1 899,38 | 13,96 | 1,0753 | -0,4551 | |||
| ABT / Abbott Laboratories | 13,59 | 0,00 | 1 847,98 | 2,53 | 1,0462 | -0,6088 | |||
| DE / Deere & Company | 2,91 | 0,00 | 1 479,36 | 8,34 | 0,8375 | -0,4163 | |||
| META / Meta Platforms, Inc. | 1,91 | 0,00 | 1 409,38 | 28,06 | 0,7979 | -0,2127 | |||
| PFE / Pfizer Inc. | 54,51 | 0,00 | 1 321,29 | -4,34 | 0,7480 | -0,5203 | |||
| KO / The Coca-Cola Company | 18,23 | 0,00 | 1 289,56 | -1,21 | 0,7301 | -0,4686 | |||
| KLAC / KLA Corporation | 1,42 | 0,00 | 1 272,08 | 31,77 | 0,7202 | -0,1663 | |||
| MKC / McCormick & Company, Incorporated | 16,52 | 0,00 | 1 252,75 | -7,88 | 0,7092 | -0,5396 | |||
| MMM / 3M Company | 8,00 | 0,00 | 1 217,63 | 3,66 | 0,6893 | -0,3892 | |||
| ADT / ADT Inc. | 133,33 | 0,00 | 1 129,33 | 4,05 | 0,6393 | -0,3573 | |||
| ADP / Automatic Data Processing, Inc. | 3,66 | 0,00 | 1 127,91 | 0,94 | 0,6385 | -0,3875 | |||
| ABBV / AbbVie Inc. | 5,96 | 0,00 | 1 106,73 | -11,41 | 0,6266 | -0,5206 | |||
| MRK / Merck & Co., Inc. | 13,79 | 0,00 | 1 092,01 | -11,81 | 0,6182 | -0,5188 | |||
| GE / General Electric Company | 3,99 | 0,00 | 1 026,33 | 28,60 | 0,5810 | -0,1518 | |||
| TXN / Texas Instruments Incorporated | 4,40 | 0,00 | 914,11 | 15,54 | 0,5175 | -0,2090 | |||
| GATX / GATX Corporation | 5,43 | -2,38 | 833,42 | -3,46 | 0,4718 | -0,3209 | |||
| MTB / M&T Bank Corporation | 4,12 | 0,00 | 799,74 | 8,53 | 0,4528 | -0,2239 | |||
| EMR / Emerson Electric Co. | 5,84 | 0,00 | 778,50 | 21,61 | 0,4407 | -0,1471 | |||
| AMGN / Amgen Inc. | 2,72 | 0,00 | 758,24 | -10,38 | 0,4293 | -0,3476 | |||
| ATR / AptarGroup, Inc. | 4,74 | 0,00 | 742,19 | 5,43 | 0,4202 | -0,2263 | |||
| GLW / Corning Incorporated | 13,92 | 0,00 | 732,04 | 14,88 | 0,4144 | -0,1707 | |||
| T / AT&T Inc. | 24,15 | 0,00 | 698,82 | 2,33 | 0,3956 | -0,2314 | |||
| UNP / Union Pacific Corporation | 3,02 | 0,00 | 694,39 | -2,61 | 0,3931 | -0,2616 | |||
| RIO / Rio Tinto Group - Depositary Receipt (Common Stock) | 10,93 | 0,00 | 637,65 | -2,91 | 0,3610 | -0,2421 | |||
| DCI / Donaldson Company, Inc. | 9,14 | 0,00 | 634,04 | 3,41 | 0,3589 | -0,2040 | |||
| CL / Colgate-Palmolive Company | 6,73 | 0,00 | 611,81 | -2,99 | 0,3464 | -0,2327 | |||
| INTC / Intel Corporation | 26,74 | 0,00 | 598,89 | -1,36 | 0,3390 | -0,2185 | |||
| RNR / RenaissanceRe Holdings Ltd. | 2,40 | 0,00 | 582,79 | 1,21 | 0,3299 | -0,1988 | |||
| ANET / Arista Networks Inc | 5,62 | 0,00 | 574,90 | 32,05 | 0,3255 | -0,0743 | |||
| CTVA / Corteva, Inc. | 7,63 | 0,00 | 569,01 | 18,43 | 0,3221 | -0,1190 | |||
| NTRS / Northern Trust Corporation | 4,41 | 0,00 | 559,13 | 28,53 | 0,3165 | -0,0829 | |||
| PEP / PepsiCo, Inc. | 4,16 | 0,00 | 549,34 | -11,94 | 0,3110 | -0,2618 | |||
| HGTY / Hagerty, Inc. | 51,80 | 0,00 | 523,70 | 11,84 | 0,4631 | 0,0331 | |||
| AMZN / Amazon.com, Inc. | 2,25 | 0,00 | 492,89 | 15,31 | 0,2790 | -0,1135 | |||
| A / Agilent Technologies, Inc. | 3,83 | 0,00 | 451,42 | 0,88 | 0,2556 | -0,1553 | |||
| NVO / Novo Nordisk A/S - Depositary Receipt (Common Stock) | 6,14 | 0,00 | 423,97 | -0,60 | 0,2400 | -0,1517 | |||
| UL / Unilever PLC - Depositary Receipt (Common Stock) | 6,89 | 0,00 | 421,32 | 2,72 | 0,2385 | -0,1381 | |||
| DUK / Duke Energy Corporation | 3,57 | 0,00 | 421,18 | -3,25 | 0,2384 | -0,1613 | |||
| VZ / Verizon Communications Inc. | 9,71 | 0,00 | 420,16 | -4,61 | 0,2379 | -0,1666 | |||
| V / Visa Inc. | 1,16 | 0,00 | 411,40 | 1,31 | 0,2329 | -0,1400 | |||
| GOOG / Alphabet Inc. | 1,84 | 0,00 | 327,17 | 13,54 | 0,1852 | -0,0794 | |||
| MDT / Medtronic plc | 3,62 | 0,00 | 315,74 | -2,99 | 0,1788 | -0,1201 | |||
| USB / U.S. Bancorp | 6,72 | 0,00 | 304,07 | 7,18 | 0,1721 | -0,0884 | |||
| IFF / International Flavors & Fragrances Inc. | 3,82 | 0,00 | 281,07 | -5,23 | 0,1591 | -0,1132 | |||
| SYY / Sysco Corporation | 3,44 | 0,00 | 260,81 | 0,93 | 0,1476 | -0,0896 | |||
| CTRA / Coterra Energy Inc. | 9,71 | 0,00 | 246,34 | -12,18 | 0,1395 | -0,1181 | |||
| ECL / Ecolab Inc. | 0,75 | 0,00 | 200,89 | 6,28 | 0,1137 | -0,0598 | |||
| K / Kellanova | 2,42 | 0,00 | 192,17 | -3,59 | 0,1088 | -0,0742 | |||
| BAX / Baxter International Inc. | 6,23 | 0,00 | 188,49 | -11,54 | 0,1067 | -0,0890 | |||
| GWW / W.W. Grainger, Inc. | 0,17 | 0,00 | 175,24 | 5,31 | 0,0992 | -0,0536 | |||
| SOLV / Solventum Corporation | 2,07 | 0,00 | 156,93 | -0,26 | 0,0888 | -0,0556 | |||
| ADBE / Adobe Inc. | 0,38 | 0,00 | 146,13 | 0,87 | 0,0827 | -0,0503 | |||
| HNI / HNI Corporation | 2,92 | -3,58 | 143,85 | 6,92 | 0,0814 | -0,0421 | |||
| CTAS / Cintas Corporation | 0,61 | 0,00 | 136,85 | 8,44 | 0,0775 | -0,0384 | |||
| VCIT / Vanguard Scottsdale Funds - Vanguard Intermediate-Term Corporate Bond ETF | 1,61 | 0,00 | 133,67 | 1,42 | 0,0757 | -0,0453 | |||
| SHEL / Shell plc - Depositary Receipt (Common Stock) | 1,86 | 0,00 | 130,82 | -3,92 | 0,0741 | -0,0510 | |||
| DOW / Dow Inc. | 4,82 | 0,00 | 127,54 | -24,17 | 0,0722 | -0,0822 | |||
| HP / Helmerich & Payne, Inc. | 7,84 | 0,00 | 118,88 | -41,96 | 0,0673 | -0,1208 | |||
| FAST / Fastenal Company | 2,83 | 100,00 | 118,77 | 8,32 | 0,0672 | -0,0334 | |||
| GEHC / GE HealthCare Technologies Inc. | 1,33 | 0,00 | 98,45 | -8,23 | 0,0871 | -0,0114 | |||
| BDX / Becton, Dickinson and Company | 0,51 | 0,00 | 87,55 | -24,80 | 0,0496 | -0,0573 | |||
| WST / West Pharmaceutical Services, Inc. | 0,39 | 0,00 | 84,95 | -2,27 | 0,0481 | -0,0317 | |||
| APH / Amphenol Corporation | 0,84 | 0,00 | 82,74 | 50,56 | 0,0468 | -0,0036 | |||
| BHP / BHP Group Limited - Depositary Receipt (Common Stock) | 1,35 | 0,00 | 64,87 | -0,93 | 0,0367 | -0,0234 | |||
| IEX / IDEX Corporation | 0,34 | 0,00 | 58,98 | -2,98 | 0,0334 | -0,0224 | |||
| MTD / Mettler-Toledo International Inc. | 0,04 | 0,00 | 48,73 | -0,52 | 0,0276 | -0,0174 | |||
| ISRG / Intuitive Surgical, Inc. | 0,09 | 0,00 | 46,53 | 9,72 | 0,0263 | -0,0126 | |||
| GGG / Graco Inc. | 0,54 | 0,00 | 46,00 | 2,95 | 0,0260 | -0,0150 | |||
| LRCX / Lam Research Corporation | 0,46 | 0,00 | 44,32 | 33,89 | 0,0251 | -0,0053 | |||
| WAT / Waters Corporation | 0,12 | 0,00 | 42,27 | -5,30 | 0,0239 | -0,0171 | |||
| NDSN / Nordson Corporation | 0,19 | 0,00 | 39,94 | 6,27 | 0,0226 | -0,0119 | |||
| VOO / Vanguard Index Funds - Vanguard S&P 500 ETF | 0,06 | 271,36 | 36,91 | 310,46 | 0,0209 | 0,0126 | |||
| IGIB / iShares Trust - iShares 5-10 Year Investment Grade Corporate Bond ETF | 0,68 | 0,00 | 36,24 | 1,47 | 0,0205 | -0,0123 | |||
| SSD / Simpson Manufacturing Co., Inc. | 0,18 | 0,00 | 28,25 | -1,13 | 0,0160 | -0,0102 | |||
| VCSH / Vanguard Scottsdale Funds - Vanguard Short-Term Corporate Bond ETF | 0,33 | 1,55 | 26,39 | 2,27 | 0,0149 | -0,0088 | |||
| PPG / PPG Industries, Inc. | 0,17 | 0,00 | 19,44 | 4,02 | 0,0110 | -0,0062 | |||
| TECH / Bio-Techne Corporation | 0,32 | 0,00 | 16,54 | -12,24 | 0,0094 | -0,0079 | |||
| IGSB / iShares Trust - iShares 1-5 Year Investment Grade Corporate Bond ETF | 0,30 | 0,00 | 15,59 | 0,74 | 0,0088 | -0,0054 | |||
| VETZ / . Tidal Trust I - Academy Veteran Impact ETF | 0,77 | 0,00 | 15,39 | -0,37 | 0,0087 | -0,0055 | |||
| GWRE / Guidewire Software, Inc. | 0,05 | 0,00 | 11,75 | 25,66 | 0,0067 | -0,0019 | |||
| GOVT / iShares Trust - iShares U.S. Treasury Bond ETF | 0,47 | 327,16 | 10,73 | 327,06 | 0,0061 | 0,0038 | |||
| AMD / Advanced Micro Devices, Inc. | 0,07 | 0,00 | 9,38 | 38,11 | 0,0083 | 0,0021 | |||
| WDS / Woodside Energy Group Ltd - Depositary Receipt (Common Stock) | 0,49 | 0,00 | 7,52 | 6,50 | 0,0043 | -0,0022 | |||
| ILMN / Illumina, Inc. | 0,08 | 0,00 | 7,42 | 20,26 | 0,0042 | -0,0015 | |||
| IEFA / iShares Trust - iShares Core MSCI EAFE ETF | 0,06 | 139,90 | 5,38 | 164,81 | 0,0030 | 0,0012 | |||
| VYM / Vanguard Whitehall Funds - Vanguard High Dividend Yield ETF | 0,02 | 938,20 | 3,20 | 974,50 | 0,0018 | 0,0015 | |||
| USIG / iShares Trust - iShares Broad USD Investment Grade Corporate Bond ETF | 0,06 | 350,09 | 3,13 | 353,77 | 0,0018 | 0,0011 | |||
| IEMG / iShares, Inc. - iShares Core MSCI Emerging Markets ETF | 0,03 | 167,65 | 1,99 | 198,06 | 0,0011 | 0,0005 | |||
| VYMI / Vanguard Whitehall Funds - Vanguard International High Dividend Yield ETF | 0,02 | 865,56 | 1,81 | 952,33 | 0,0016 | 0,0014 | |||
| SCHA / Schwab Strategic Trust - Schwab U.S. Small-Cap ETF | 0,06 | 174,66 | 1,49 | 197,00 | 0,0008 | 0,0004 | |||
| AMAT / Applied Materials, Inc. | 0,01 | 0,00 | 1,10 | 26,21 | 0,0006 | -0,0002 | |||
| VTEB / Vanguard Municipal Bond Funds - Vanguard Tax-Exempt Bond ETF | 0,02 | 126,89 | 1,09 | 124,02 | 0,0006 | 0,0002 | |||
| SCHP / Schwab Strategic Trust - Schwab U.S. TIPS ETF | 0,03 | 312,47 | 0,93 | 310,57 | 0,0005 | 0,0003 | |||
| FLOT / iShares Trust - iShares Floating Rate Bond ETF | 0,01 | 321,80 | 0,69 | 323,46 | 0,0004 | 0,0002 | |||
| EMB / iShares Trust - iShares J.P. Morgan USD Emerging Markets Bond ETF | 0,01 | 312,24 | 0,49 | 321,55 | 0,0003 | 0,0002 | |||
| USHY / iShares Trust - iShares Broad USD High Yield Corporate Bond ETF | 0,01 | 423,34 | 0,39 | 436,11 | 0,0002 | 0,0002 | |||
| MUB / iShares Trust - iShares National Muni Bond ETF | 0,00 | 0,33 | 0,0003 | 0,0003 | |||||
| VGSH / Vanguard Scottsdale Funds - Vanguard Short-Term Treasury ETF | 0,00 | 861,52 | 0,28 | 872,41 | 0,0002 | 0,0001 | |||
| SHYG / iShares Trust - iShares 0-5 Year High Yield Corporate Bond ETF | 0,01 | 1 232,25 | 0,23 | 1 247,06 | 0,0001 | 0,0001 | |||
| SUB / iShares Trust - iShares Short-Term National Muni Bond ETF | 0,00 | 195,69 | 0,20 | 200,00 | 0,0001 | 0,0001 | |||
| VTV / Vanguard Index Funds - Vanguard Value ETF | 0,00 | 0,10 | 0,0001 | 0,0001 | |||||
| NE / Noble Corporation plc | 0,00 | -100,00 | 0,00 | 0,0000 | |||||
| ENB / Enbridge Inc. | 0,00 | -100,00 | 0,00 | 0,0000 | |||||
| VERSX / Vanguard Emerging Markets Stock Index Fund | 0,00 | -100,00 | 0,00 | 0,0000 | |||||
| VAL / Valaris Limited | 0,00 | -100,00 | 0,00 | 0,0000 |