Statistiques de base
| Valeur du portefeuille | $ 165 392 994 |
| Positions actuelles | 55 |
Dernières positions, performances, ASG (à partir des dépôts 13F, 13D)
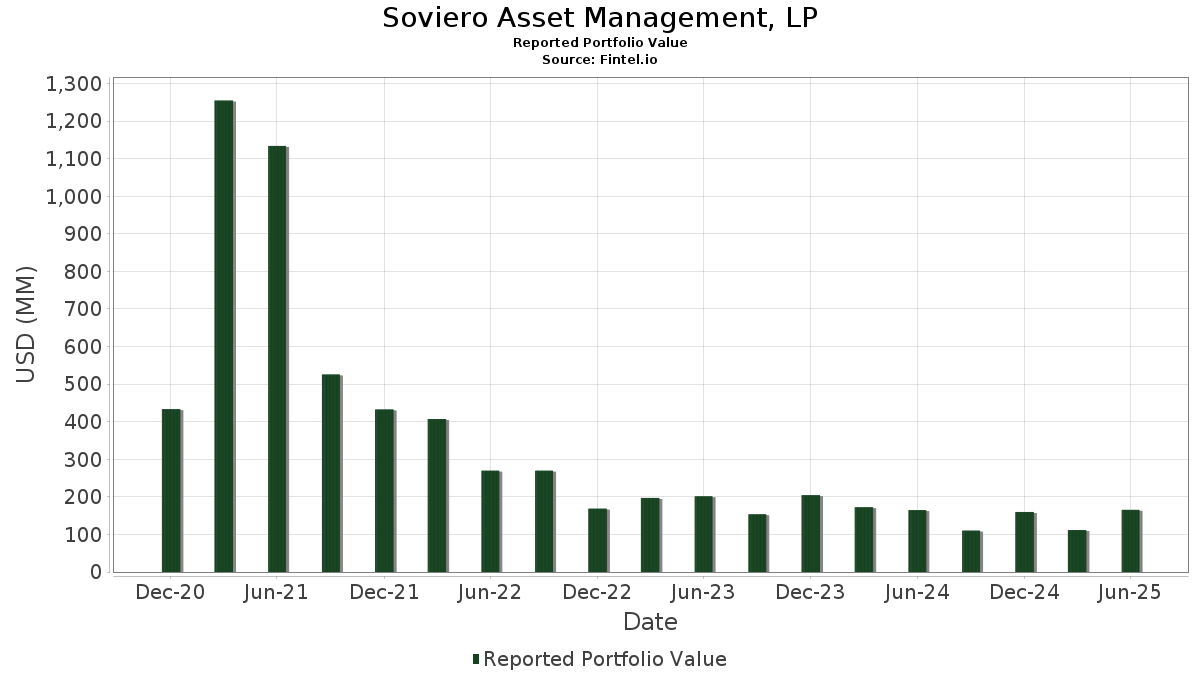
Soviero Asset Management, LP a déclaré un total de 55 positions dans ses derniers dépôts auprès de la SEC. La valeur la plus récente du portefeuille est calculée à 165 392 994 USD. Les actifs sous gestion réels (ASG) sont cette valeur plus les liquidités (qui ne sont pas divulguées). Les principales positions de Soviero Asset Management, LP sont Flex Ltd. (US:FLEX) , Western Digital Corporation (US:WDC) , ON Semiconductor Corporation (US:ON) , Teladoc Health, Inc. (US:TDOC) , and Citigroup Inc. (US:C) . Les nouvelles positions de Soviero Asset Management, LP incluent Citigroup Inc. (US:C) , L3Harris Technologies, Inc. (US:LHX) , TSS, Inc. (US:TSSI) , MarineMax, Inc. (US:HZO) , and ZIM Integrated Shipping Services Ltd. (US:ZIM) . Les principales industries de Soviero Asset Management, LP sont "Stone, Clay, Glass, And Concrete Products" (sic 32) , "Transportation Equipment" (sic 37) , and "Transportation By Air" (sic 45) .
Meilleures augmentations ce trimestre
Nous utilisons la variation de l'allocation du portefeuille car il s'agit de l'indicateur le plus significatif. Les changements peuvent être dus à des transactions ou à des variations de prix des actions.
| Titre | Actions (en millions) |
Valeur ($ en millions) |
% du portefeuille | ΔPortefeuille % |
|---|---|---|---|---|
| 0,10 | 4,98 | 3,0104 | 3,0104 | |
| 0,57 | 4,96 | 3,0018 | 3,0018 | |
| 0,06 | 4,94 | 2,9850 | 2,9850 | |
| 0,28 | 4,78 | 2,8898 | 2,8898 | |
| 0,02 | 4,77 | 2,8816 | 2,8816 | |
| 0,16 | 4,61 | 2,7890 | 2,7890 | |
| 0,03 | 3,57 | 2,1611 | 2,1611 | |
| 0,14 | 3,57 | 2,1584 | 2,1584 | |
| 0,19 | 3,42 | 2,0701 | 2,0701 | |
| 0,05 | 3,35 | 2,0225 | 2,0225 |
Principales baisses ce trimestre
Nous utilisons la variation de l'allocation du portefeuille car il s'agit de l'indicateur le plus significatif. Les changements peuvent être dus à des transactions ou à des variations de prix des actions.
| Titre | Actions (en millions) |
Valeur ($ en millions) |
% du portefeuille | ΔPortefeuille % |
|---|---|---|---|---|
| 0,00 | 0,00 | -2,9624 | ||
| 0,19 | 0,96 | 0,5824 | -2,1916 | |
| 0,04 | 2,20 | 1,3292 | -1,7748 | |
| 0,24 | 3,27 | 1,9764 | -1,4965 | |
| 0,24 | 2,94 | 1,7776 | -1,4843 | |
| 0,02 | 4,39 | 2,6530 | -1,4363 | |
| 0,21 | 2,27 | 1,3738 | -1,2034 | |
| 0,43 | 3,27 | 1,9759 | -1,1895 | |
| 0,14 | 2,35 | 1,4187 | -0,7320 | |
| 0,04 | 3,34 | 2,0193 | -0,6301 |
Déclarations 13D/G
Il s'agit d'une liste des déclarations 13D et 13G déposées au cours de la dernière année (le cas échéant). Cliquez sur l'icône du lien pour voir l'historique complet des transactions. Les lignes vertes indiquent de nouvelles positions. Les lignes rouges indiquent des positions fermées.
| Date de dépôt | Formulaire | Titre | Actions précédentes |
Actions actuelles |
ΔActions % | % de participation |
% ΔParticipation | |
|---|---|---|---|---|---|---|---|---|
| 2024-11-14 | PBPB / Potbelly Corporation | 1 628 340 | 683 000 | -58,06 | 2,30 | -58,93 | ||
| 2024-11-14 | RRGB / Red Robin Gourmet Burgers, Inc. | 1 289 699 | 0 | -100,00 | 0,00 | -100,00 |
Déclarations 13F et dépôts de fonds
Ce formulaire a été déposé le 2025-08-14 pour la période de déclaration 2025-06-30. Cliquez sur l'icône du lien pour voir l'historique complet des transactions.
Mettre à niveau pour débloquer les données premium et exporter vers Excel ![]() .
.
| Titre | Type | Prix moyen de l'action | Actions (en millions) |
ΔActions (%) |
ΔActions (%) |
Valeur ($ en millions) |
Portefeuille (%) |
ΔPortefeuille (%) |
|
|---|---|---|---|---|---|---|---|---|---|
| FLEX / Flex Ltd. | Call | 0,13 | 0,00 | 6,51 | 50,93 | 3,9388 | 0,0729 | ||
| WDC / Western Digital Corporation | Call | 0,08 | -20,00 | 5,12 | 26,61 | 3,0952 | -0,5255 | ||
| ON / ON Semiconductor Corporation | 0,10 | 4,98 | 3,0104 | 3,0104 | |||||
| TDOC / Teladoc Health, Inc. | 0,57 | 4,96 | 3,0018 | 3,0018 | |||||
| C / Citigroup Inc. | 0,06 | 4,94 | 2,9850 | 2,9850 | |||||
| CORZ / Core Scientific, Inc. | 0,28 | 4,78 | 2,8898 | 2,8898 | |||||
| LHX / L3Harris Technologies, Inc. | 0,02 | 4,77 | 2,8816 | 2,8816 | |||||
| UAA / Under Armour, Inc. | 0,68 | 84,86 | 4,67 | 102,03 | 2,8246 | 0,7537 | |||
| CE / Celanese Corporation | 0,08 | 61,54 | 4,65 | 57,42 | 2,8101 | 0,1664 | |||
| TSSI / TSS, Inc. | 0,16 | 4,61 | 2,7890 | 2,7890 | |||||
| WDC / Western Digital Corporation | 0,07 | -1,39 | 4,54 | 56,12 | 2,7470 | 0,1401 | |||
| ON / ON Semiconductor Corporation | Call | 0,09 | 0,00 | 4,45 | 28,80 | 2,6935 | -0,4039 | ||
| AMZN / Amazon.com, Inc. | 0,02 | -16,67 | 4,39 | -3,92 | 2,6530 | -1,4363 | |||
| HIMX / Himax Technologies, Inc. - Depositary Receipt (Common Stock) | 0,43 | 28,89 | 3,86 | 56,58 | 2,3312 | 0,1262 | |||
| ANF / Abercrombie & Fitch Co. | 0,04 | 12,50 | 3,73 | 22,07 | 2,2542 | -0,4815 | |||
| PBF / PBF Energy Inc. | Call | 0,17 | 70,00 | 3,68 | 92,93 | 2,2274 | 0,5178 | ||
| MU / Micron Technology, Inc. | 0,03 | 3,57 | 2,1611 | 2,1611 | |||||
| HZO / MarineMax, Inc. | 0,14 | 3,57 | 2,1584 | 2,1584 | |||||
| PYPL / PayPal Holdings, Inc. | 0,05 | 213,33 | 3,49 | 257,16 | 2,1120 | 1,2355 | |||
| PBF / PBF Energy Inc. | 0,16 | 23,08 | 3,47 | 39,74 | 2,0963 | -0,1261 | |||
| CENX / Century Aluminum Company | 0,19 | 3,42 | 2,0701 | 2,0701 | |||||
| ACLS / Axcelis Technologies, Inc. | 0,05 | 3,35 | 2,0225 | 2,0225 | |||||
| ROKU / Roku, Inc. | 0,04 | -9,52 | 3,34 | 12,88 | 2,0193 | -0,6301 | |||
| ADNT / Adient plc | 0,17 | 3,31 | 2,0002 | 2,0002 | |||||
| PR / Permian Resources Corporation | 0,24 | -14,29 | 3,27 | -15,73 | 1,9764 | -1,4965 | |||
| CLF / Cleveland-Cliffs Inc. | Call | 0,43 | 0,00 | 3,27 | -7,53 | 1,9759 | -1,1895 | ||
| PINS / Pinterest, Inc. | 0,09 | 3,23 | 1,9514 | 1,9514 | |||||
| VAL / Valaris Limited | 0,07 | 11,11 | 2,95 | 19,17 | 1,7822 | -0,4328 | |||
| PBPB / Potbelly Corporation | 0,24 | -37,34 | 2,94 | -19,28 | 1,7776 | -1,4843 | |||
| PPTA / Perpetua Resources Corp. | 0,24 | 40,12 | 2,91 | 59,18 | 1,7616 | 0,1219 | |||
| ZIM / ZIM Integrated Shipping Services Ltd. | 0,17 | 2,77 | 1,6733 | 1,6733 | |||||
| CPNG / Coupang, Inc. | 0,09 | 2,70 | 1,6303 | 1,6303 | |||||
| HIMX / Himax Technologies, Inc. - Depositary Receipt (Common Stock) | Call | 0,30 | 500,00 | 2,68 | 629,97 | 1,6198 | 1,2907 | ||
| AMTM / Amentum Holdings, Inc. | 0,11 | 2,60 | 1,5703 | 1,5703 | |||||
| SPWH / Sportsman's Warehouse Holdings, Inc. | 0,74 | 54,17 | 2,55 | 435,22 | 1,5436 | 1,1163 | |||
| TREX / Trex Company, Inc. | 0,05 | 67,14 | 2,54 | 56,46 | 1,5387 | 0,0819 | |||
| CLOV / Clover Health Investments, Corp. | 0,90 | 260,00 | 2,51 | 179,93 | 1,5182 | 0,7145 | |||
| JBLU / JetBlue Airways Corporation | 0,56 | 2,37 | 1,4322 | 1,4322 | |||||
| HBAN / Huntington Bancshares Incorporated | 0,14 | -12,50 | 2,35 | -2,29 | 1,4187 | -0,7320 | |||
| SD / SandRidge Energy, Inc. | 0,21 | -16,67 | 2,27 | -21,03 | 1,3738 | -1,2034 | |||
| WMB / The Williams Companies, Inc. | 0,04 | -39,66 | 2,20 | -36,58 | 1,3292 | -1,7748 | |||
| ZIM / ZIM Integrated Shipping Services Ltd. | Call | 0,13 | 2,09 | 1,2647 | 1,2647 | ||||
| ELF / e.l.f. Beauty, Inc. | 0,02 | 1,99 | 1,2038 | 1,2038 | |||||
| RKLB / Rocket Lab Corporation | 0,05 | 1,75 | 1,0597 | 1,0597 | |||||
| XRX / Xerox Holdings Corporation | 0,32 | 1,69 | 1,0196 | 1,0196 | |||||
| PDYN / Palladyne AI Corp. | 0,19 | 1,65 | 0,9948 | 0,9948 | |||||
| CFLT / Confluent, Inc. | 0,06 | 1,50 | 0,9044 | 0,9044 | |||||
| TDOC / Teladoc Health, Inc. | Call | 0,14 | 0,00 | 1,22 | 9,43 | 0,7373 | -0,2607 | ||
| UAMY / United States Antimony Corporation | 0,51 | 180,22 | 1,11 | 177,75 | 0,6722 | 0,3136 | |||
| CAL / Caleres, Inc. | 0,09 | 1,10 | 0,6650 | 0,6650 | |||||
| TROX / Tronox Holdings plc | 0,19 | -56,82 | 0,96 | -68,91 | 0,5824 | -2,1916 | |||
| VERA / Vera Therapeutics, Inc. | 0,03 | 0,71 | 0,4273 | 0,4273 | |||||
| CHPT / ChargePoint Holdings, Inc. | 0,90 | 0,63 | 0,3827 | 0,3827 | |||||
| SERV / Serve Robotics Inc. | 0,04 | 0,40 | 0,2421 | 0,2421 | |||||
| INVZ / Innoviz Technologies Ltd. | 0,20 | 0,33 | 0,1983 | 0,1983 | |||||
| AAPL / Apple Inc. | 0,00 | -100,00 | 0,00 | 0,0000 | |||||
| OPRA / Opera Limited - Depositary Receipt (Common Stock) | 0,00 | -100,00 | 0,00 | 0,0000 | |||||
| MWA / Mueller Water Products, Inc. | 0,00 | -100,00 | 0,00 | 0,0000 | |||||
| FLEX / Flex Ltd. | 0,00 | -100,00 | 0,00 | -100,00 | -2,9624 | ||||
| PATH / UiPath Inc. | Call | 0,00 | -100,00 | 0,00 | 0,0000 | ||||
| LW / Lamb Weston Holdings, Inc. | 0,00 | -100,00 | 0,00 | 0,0000 | |||||
| GENI / Genius Sports Limited | 0,00 | -100,00 | 0,00 | 0,0000 | |||||
| FCX / Freeport-McMoRan Inc. | 0,00 | -100,00 | 0,00 | 0,0000 | |||||
| HON / Honeywell International Inc. | 0,00 | -100,00 | 0,00 | 0,0000 | |||||
| NET / Cloudflare, Inc. | 0,00 | -100,00 | 0,00 | 0,0000 | |||||
| SEDG / SolarEdge Technologies, Inc. | Call | 0,00 | -100,00 | 0,00 | 0,0000 | ||||
| RRC / Range Resources Corporation | 0,00 | -100,00 | 0,00 | 0,0000 | |||||
| CELH / Celsius Holdings, Inc. | 0,00 | -100,00 | 0,00 | 0,0000 | |||||
| BIGC / Commerce.com, Inc. | 0,00 | -100,00 | 0,00 | 0,0000 | |||||
| LW / Lamb Weston Holdings, Inc. | Call | 0,00 | -100,00 | 0,00 | 0,0000 | ||||
| RGTI / Rigetti Computing, Inc. | 0,00 | -100,00 | 0,00 | 0,0000 |