Statistiques de base
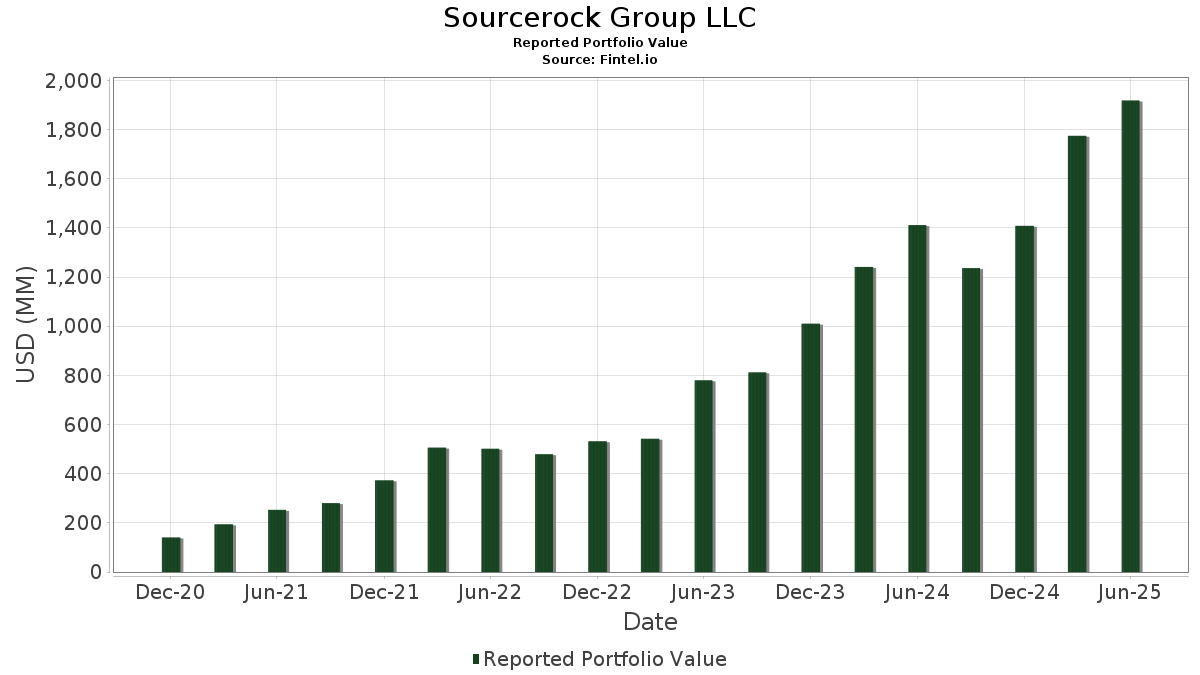
| Valeur du portefeuille | $ 1 917 938 032 |
| Positions actuelles | 39 |
Dernières positions, performances, ASG (à partir des dépôts 13F, 13D)
Sourcerock Group LLC a déclaré un total de 39 positions dans ses derniers dépôts auprès de la SEC. La valeur la plus récente du portefeuille est calculée à 1 917 938 032 USD. Les actifs sous gestion réels (ASG) sont cette valeur plus les liquidités (qui ne sont pas divulguées). Les principales positions de Sourcerock Group LLC sont Antero Resources Corporation (US:AR) , EQT Corporation (US:EQT) , Noble Corporation plc (US:NE) , Tenaris S.A. - Depositary Receipt (Common Stock) (US:TS) , and Chord Energy Corporation (US:CHRD) . Les nouvelles positions de Sourcerock Group LLC incluent Cameco Corporation (US:CCJ) , Peabody Energy Corporation (US:BTU) , Coterra Energy Inc. (US:CTRA) , Range Resources Corporation (US:RRC) , and Kinder Morgan, Inc. (US:KMI) . Les principales industries de Sourcerock Group LLC sont "Engineering, Accounting, Research, Management, And Related Services" (sic 87) , "Amusement And Recreation Services" (sic 79) , and "Heavy Construction Other Than Building Construction Contractors" (sic 16) .
Meilleures augmentations ce trimestre
Nous utilisons la variation de l'allocation du portefeuille car il s'agit de l'indicateur le plus significatif. Les changements peuvent être dus à des transactions ou à des variations de prix des actions.
| Titre | Actions (en millions) |
Valeur ($ en millions) |
% du portefeuille | ΔPortefeuille % |
|---|---|---|---|---|
| 1,66 | 85,33 | 4,4489 | 4,4489 | |
| 1,75 | 55,71 | 2,9046 | 2,7392 | |
| 0,58 | 43,24 | 2,2546 | 2,2546 | |
| 5,18 | 137,64 | 7,1767 | 1,7985 | |
| 2,00 | 91,37 | 4,7640 | 1,7374 | |
| 2,09 | 28,09 | 1,4647 | 1,4647 | |
| 2,06 | 23,65 | 1,2333 | 1,2333 | |
| 13,80 | 81,86 | 4,2679 | 1,2113 | |
| 0,54 | 44,45 | 2,3174 | 1,1979 | |
| 0,86 | 21,80 | 1,1365 | 1,1365 |
Principales baisses ce trimestre
Nous utilisons la variation de l'allocation du portefeuille car il s'agit de l'indicateur le plus significatif. Les changements peuvent être dus à des transactions ou à des variations de prix des actions.
| Titre | Actions (en millions) |
Valeur ($ en millions) |
% du portefeuille | ΔPortefeuille % |
|---|---|---|---|---|
| 2,73 | 159,01 | 8,2909 | -8,0486 | |
| 3,62 | 99,76 | 5,2014 | -3,6917 | |
| 0,20 | 4,08 | 0,2125 | -3,5480 | |
| 1,03 | 99,95 | 5,2111 | -1,2117 | |
| 0,00 | 0,00 | -0,9597 | ||
| 0,36 | 2,27 | 0,1182 | -0,8653 | |
| 2,93 | 86,56 | 4,5131 | -0,8181 | |
| 11,19 | 94,92 | 4,9490 | -0,5742 | |
| 0,79 | 12,30 | 0,6411 | -0,3778 | |
| 2,28 | 31,85 | 1,6607 | -0,3232 |
Déclarations 13D/G
Il s'agit d'une liste des déclarations 13D et 13G déposées au cours de la dernière année (le cas échéant). Cliquez sur l'icône du lien pour voir l'historique complet des transactions. Les lignes vertes indiquent de nouvelles positions. Les lignes rouges indiquent des positions fermées.
| Date de dépôt | Formulaire | Titre | Actions précédentes |
Actions actuelles |
ΔActions % | % de participation |
% ΔParticipation | |
|---|---|---|---|---|---|---|---|---|
| 2025-08-15 | PUMP / ProPetro Holding Corp. | 8 408 391 | 8,10 | |||||
| 2025-08-15 | TALO / Talos Energy Inc. | 7 465 773 | 11 193 177 | 49,93 | 6,30 | 5,00 |
Déclarations 13F et dépôts de fonds
Ce formulaire a été déposé le 2025-08-14 pour la période de déclaration 2025-06-30. Cliquez sur l'icône du lien pour voir l'historique complet des transactions.
Mettre à niveau pour débloquer les données premium et exporter vers Excel ![]() .
.
| Titre | Type | Prix moyen de l'action | Actions (en millions) |
ΔActions (%) |
ΔActions (%) |
Valeur ($ en millions) |
Portefeuille (%) |
ΔPortefeuille (%) |
|
|---|---|---|---|---|---|---|---|---|---|
| AR / Antero Resources Corporation | 8,16 | 10,62 | 328,53 | 10,18 | 17,1293 | 0,3255 | |||
| EQT / EQT Corporation | 2,73 | -49,75 | 159,01 | -45,15 | 8,2909 | -8,0486 | |||
| NE / Noble Corporation plc | 5,18 | 28,75 | 137,64 | 44,24 | 7,1767 | 1,7985 | |||
| TS / Tenaris S.A. - Depositary Receipt (Common Stock) | 3,09 | 25,95 | 115,42 | 20,44 | 6,0179 | 0,6172 | |||
| CHRD / Chord Energy Corporation | 1,03 | 2,07 | 99,95 | -12,30 | 5,2111 | -1,2117 | |||
| CIVI / Civitas Resources, Inc. | 3,62 | -19,85 | 99,76 | -36,78 | 5,2014 | -3,6917 | |||
| TALO / Talos Energy Inc. | 11,19 | 11,02 | 94,92 | -3,15 | 4,9490 | -0,5742 | |||
| CRC / California Resources Corporation | 2,00 | 63,80 | 91,37 | 70,14 | 4,7640 | 1,7374 | |||
| AA / Alcoa Corporation | 2,93 | -5,43 | 86,56 | -8,50 | 4,5131 | -0,8181 | |||
| FLR / Fluor Corporation | 1,66 | 85,33 | 4,4489 | 4,4489 | |||||
| PTEN / Patterson-UTI Energy, Inc. | 13,80 | 109,21 | 81,86 | 50,93 | 4,2679 | 1,2113 | |||
| DVN / Devon Energy Corporation | 1,75 | 2 132,29 | 55,71 | 1 798,70 | 2,9046 | 2,7392 | |||
| PUMP / ProPetro Holding Corp. | 8,41 | 66,42 | 50,20 | 35,17 | 2,6173 | 0,5244 | |||
| OKE / ONEOK, Inc. | 0,54 | 171,97 | 44,45 | 123,76 | 2,3174 | 1,1979 | |||
| CCJ / Cameco Corporation | 0,58 | 43,24 | 2,2546 | 2,2546 | |||||
| PCG / PG&E Corporation | 2,28 | 11,51 | 31,85 | -9,52 | 1,6607 | -0,3232 | |||
| PR / Permian Resources Corporation | 2,09 | -0,30 | 28,40 | -1,95 | 1,4808 | -0,1517 | |||
| BTU / Peabody Energy Corporation | 2,09 | 28,09 | 1,4647 | 1,4647 | |||||
| CENX / Century Aluminum Company | 1,42 | 612,04 | 25,66 | 591,33 | 1,3380 | 1,1288 | |||
| LNG / Cheniere Energy, Inc. | 0,10 | 94,23 | 24,72 | 104,41 | 1,2889 | 0,6073 | |||
| LBRT / Liberty Energy Inc. | 2,06 | 23,65 | 1,2333 | 1,2333 | |||||
| CTRA / Coterra Energy Inc. | 0,86 | 21,80 | 1,1365 | 1,1365 | |||||
| UGI / UGI Corporation | 0,56 | -22,27 | 20,56 | -14,40 | 1,0721 | -0,2817 | |||
| DTM / DT Midstream, Inc. | 0,16 | -23,17 | 17,65 | -12,47 | 0,9203 | -0,2162 | |||
| TRP / TC Energy Corporation | 0,31 | 15,10 | 0,7871 | 0,7871 | |||||
| SR / Spire Inc. | 0,18 | -8,58 | 13,05 | -14,73 | 0,6803 | -0,1820 | |||
| RRC / Range Resources Corporation | 0,31 | 12,57 | 0,6552 | 0,6552 | |||||
| VG / Venture Global, Inc. | 0,79 | -55,04 | 12,30 | -31,99 | 0,6411 | -0,3778 | |||
| KMI / Kinder Morgan, Inc. | 0,41 | 12,12 | 0,6320 | 0,6320 | |||||
| XEL / Xcel Energy Inc. | 0,14 | 102,37 | 9,65 | 94,67 | 0,5030 | 0,2237 | |||
| FCX / Freeport-McMoRan Inc. | 0,22 | 9,54 | 0,4973 | 0,4973 | |||||
| SWX / Southwest Gas Holdings, Inc. | 0,12 | 8,94 | 0,4662 | 0,4662 | |||||
| GLNG / Golar LNG Limited | 0,18 | 77,98 | 7,34 | 92,98 | 0,3826 | 0,1683 | |||
| KGS / Kodiak Gas Services, Inc. | 0,18 | -36,67 | 6,21 | -41,82 | 0,3238 | -0,2777 | |||
| CMS / CMS Energy Corporation | 0,07 | 5,04 | 0,2626 | 0,2626 | |||||
| HAL / Halliburton Company | 0,20 | -92,40 | 4,08 | -93,89 | 0,2125 | -3,5480 | |||
| HLX / Helix Energy Solutions Group, Inc. | 0,36 | -82,70 | 2,27 | -87,01 | 0,1182 | -0,8653 | |||
| XOP / SPDR Series Trust - SPDR S&P Oil & Gas Exploration & Production ETF | 0,02 | -12,43 | 2,26 | -16,37 | 0,1177 | -0,0344 | |||
| EE / Excelerate Energy, Inc. | 0,04 | 1,17 | 0,0611 | 0,0611 | |||||
| TLNE / Talen Energy Corporation | 0,00 | -100,00 | 0,00 | 0,0000 | |||||
| FRO / Frontline plc | 0,00 | -100,00 | 0,00 | 0,0000 | |||||
| DHT / DHT Holdings, Inc. | 0,00 | -100,00 | 0,00 | 0,0000 | |||||
| VST / Vistra Corp. | 0,00 | -100,00 | 0,00 | 0,0000 | |||||
| SGML / Sigma Lithium Corporation | 0,00 | -100,00 | 0,00 | -100,00 | -0,9597 | ||||
| LNT / Alliant Energy Corporation | 0,00 | -100,00 | 0,00 | 0,0000 | |||||
| STNG / Scorpio Tankers Inc. | 0,00 | -100,00 | 0,00 | 0,0000 | |||||
| NRG / NRG Energy, Inc. | 0,00 | -100,00 | 0,00 | 0,0000 | |||||
| NFG / National Fuel Gas Company | 0,00 | -100,00 | 0,00 | 0,0000 | |||||
| BTE / Baytex Energy Corp. | 0,00 | -100,00 | 0,00 | 0,0000 | |||||
| NXT / Nextracker Inc. | 0,00 | -100,00 | 0,00 | 0,0000 |