Statistiques de base
| Profil de l'initié | Select Equity Group, L.P. |
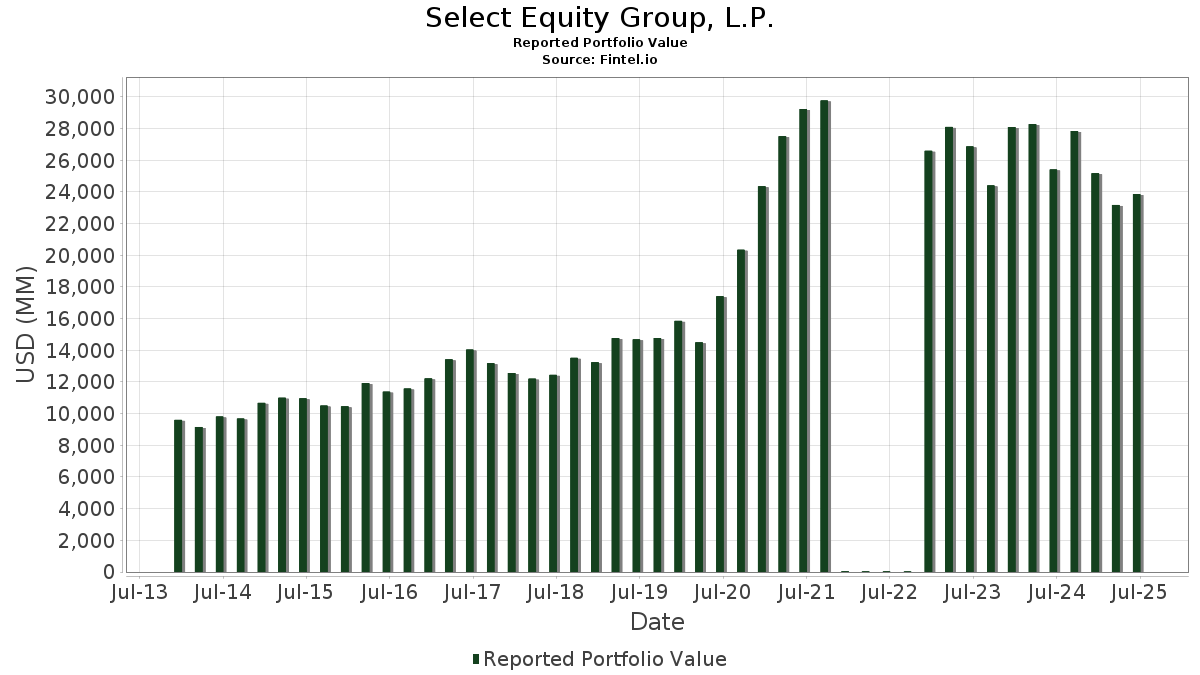
| Valeur du portefeuille | $ 23 862 889 621 |
| Positions actuelles | 152 |
Dernières positions, performances, ASG (à partir des dépôts 13F, 13D)
Select Equity Group, L.P. a déclaré un total de 152 positions dans ses derniers dépôts auprès de la SEC. La valeur la plus récente du portefeuille est calculée à 23 862 889 621 USD. Les actifs sous gestion réels (ASG) sont cette valeur plus les liquidités (qui ne sont pas divulguées). Les principales positions de Select Equity Group, L.P. sont Live Nation Entertainment, Inc. (US:LYV) , Viking Holdings Ltd (US:VIK) , Somnigroup International Inc. (US:SGI) , CRH plc (US:CRH) , and Westinghouse Air Brake Technologies Corporation (US:WAB) . Les nouvelles positions de Select Equity Group, L.P. incluent Newmont Corporation (US:NEM) , NVIDIA Corporation (US:NVDA) , Newmont Corporation (US:NEM) , Nasdaq, Inc. (US:NDAQ) , and SilverSun Technologies, Inc. (US:SSNT) . Les principales industries de Select Equity Group, L.P. sont "Apparel And Other Finished Products Made From Fabrics And Similar Materials" (sic 23) , "Food And Kindred Products" (sic 20) , and "Hotels, Rooming Houses, Camps, And Other Lodging Places" (sic 70) .
Meilleures augmentations ce trimestre
Nous utilisons la variation de l'allocation du portefeuille car il s'agit de l'indicateur le plus significatif. Les changements peuvent être dus à des transactions ou à des variations de prix des actions.
| Titre | Actions (en millions) |
Valeur ($ en millions) |
% du portefeuille | ΔPortefeuille % |
|---|---|---|---|---|
| 0,34 | 671,85 | 2,8155 | 1,2728 | |
| 4,10 | 239,05 | 1,0018 | 1,0018 | |
| 1,02 | 384,55 | 1,6115 | 0,9527 | |
| 2,26 | 511,86 | 2,1450 | 0,8173 | |
| 17,88 | 952,87 | 3,9931 | 0,7931 | |
| 1,09 | 172,83 | 0,7243 | 0,7243 | |
| 12,71 | 670,89 | 2,8114 | 0,6812 | |
| 2,25 | 259,12 | 1,0859 | 0,6051 | |
| 4,05 | 723,77 | 3,0331 | 0,4773 | |
| 1,92 | 111,84 | 0,4687 | 0,4687 |
Principales baisses ce trimestre
Nous utilisons la variation de l'allocation du portefeuille car il s'agit de l'indicateur le plus significatif. Les changements peuvent être dus à des transactions ou à des variations de prix des actions.
| Titre | Actions (en millions) |
Valeur ($ en millions) |
% du portefeuille | ΔPortefeuille % |
|---|---|---|---|---|
| 5,19 | 267,40 | 1,1206 | -1,1016 | |
| 1,57 | 81,71 | 0,3424 | -1,0815 | |
| 2,55 | 141,13 | 0,5914 | -0,7762 | |
| 4,73 | 680,76 | 2,8528 | -0,7632 | |
| 2,92 | 150,21 | 0,6295 | -0,7281 | |
| 5,75 | 637,03 | 2,6695 | -0,6984 | |
| 2,92 | 235,45 | 0,9867 | -0,5512 | |
| 0,55 | 57,44 | 0,2407 | -0,5218 | |
| 1,47 | 91,05 | 0,3816 | -0,4855 | |
| 0,54 | 191,84 | 0,8039 | -0,3585 |
Déclarations 13D/G
Il s'agit d'une liste des déclarations 13D et 13G déposées au cours de la dernière année (le cas échéant). Cliquez sur l'icône du lien pour voir l'historique complet des transactions. Les lignes vertes indiquent de nouvelles positions. Les lignes rouges indiquent des positions fermées.
| Date de dépôt | Formulaire | Titre | Actions précédentes |
Actions actuelles |
ΔActions % | % de participation |
% ΔParticipation | |
|---|---|---|---|---|---|---|---|---|
| 2025-08-14 | FBIN / Fortune Brands Innovations, Inc. | 8 559 466 | 5 194 296 | -39,32 | 4,30 | -37,68 | ||
| 2025-05-15 | MIDD / The Middleby Corporation | 6 561 001 | 5 517 126 | -15,91 | 10,30 | -15,57 | ||
| 2025-05-15 | SCI / Service Corporation International | 9 123 512 | 7 019 395 | -23,06 | 4,90 | -22,22 | ||
| 2025-05-15 | DAY / Dayforce Inc. | 11 400 740 | 5 436 576 | -52,31 | 3,40 | -52,78 | ||
| 2025-05-15 | SGI / Somnigroup International Inc. | 18 770 274 | 15 130 546 | -19,39 | 7,30 | -32,41 | ||
| 2025-02-27 | SIG / Signet Jewelers Limited | 4 306 370 | 4 217 695 | -2,06 | 9,70 | -2,02 | ||
| 2025-02-14 | VIK / Viking Holdings Ltd | 17 279 911 | 5,70 | |||||
| 2025-02-14 | TTC / The Toro Company | 5 557 179 | 4 905 975 | -11,72 | 4,80 | -11,11 | ||
| 2025-02-14 | LYV / Live Nation Entertainment, Inc. | 12 573 719 | 8 442 456 | -32,86 | 3,60 | -33,33 | ||
| 2025-02-14 | CNM / Core & Main, Inc. | 16 375 022 | 13 182 779 | -19,49 | 6,90 | -18,82 | ||
| 2025-02-14 | NEOG / Neogen Corporation | 13 241 197 | 9 396 150 | -29,04 | 4,30 | -29,51 | ||
| 2024-11-14 | MTN / Vail Resorts, Inc. | 2 722 916 | 616 355 | -77,36 | 1,60 | -77,78 | ||
| 2024-11-14 | RVTY / Revvity, Inc. | 11 272 550 | 5 174 224 | -54,10 | 4,30 | -52,75 | ||
| 2024-11-14 | MORN / Morningstar, Inc. | 2 984 115 | 1 759 321 | -41,04 | 4,10 | -41,43 | ||
| 2024-11-14 | OSW / OneSpaWorld Holdings Limited | 8 448 600 | 5 165 163 | -38,86 | 4,97 | -41,53 | ||
| 2024-11-14 | NAPA / The Duckhorn Portfolio, Inc. | 8 406 702 | 176 255 | -97,90 | 0,10 | -98,63 | ||
| 2024-11-14 | BRO / Brown & Brown, Inc. | 14 310 766 | 9 573 280 | -33,10 | 3,30 | -34,00 | ||
| 2024-11-14 | CLH / Clean Harbors, Inc. | 2 957 014 | 1 671 042 | -43,49 | 3,10 | -43,64 | ||
| 2024-11-14 | ITT / ITT Inc. | 4 237 979 | 5,20 |
Déclarations 13F et dépôts de fonds
Ce formulaire a été déposé le 2025-08-14 pour la période de déclaration 2025-06-30. Cliquez sur l'icône du lien pour voir l'historique complet des transactions.
Mettre à niveau pour débloquer les données premium et exporter vers Excel ![]() .
.
| Titre | Type | Prix moyen de l'action | Actions (en millions) |
ΔActions (%) |
ΔActions (%) |
Valeur ($ en millions) |
Portefeuille (%) |
ΔPortefeuille (%) |
|
|---|---|---|---|---|---|---|---|---|---|
| LYV / Live Nation Entertainment, Inc. | 6,85 | -3,34 | 1 036,48 | 11,99 | 4,3435 | 0,3498 | |||
| VIK / Viking Holdings Ltd | 17,88 | -4,16 | 952,87 | 28,49 | 3,9931 | 0,7931 | |||
| SGI / Somnigroup International Inc. | 13,84 | -8,51 | 941,59 | 3,98 | 3,9458 | 0,0383 | |||
| CRH / CRH plc | 9,70 | -6,48 | 890,20 | -2,41 | 3,7305 | -0,2054 | |||
| WAB / Westinghouse Air Brake Technologies Corporation | 4,06 | -11,27 | 849,86 | 2,43 | 3,5614 | -0,0187 | |||
| CDW / CDW Corporation | 4,05 | 9,65 | 723,77 | 22,19 | 3,0331 | 0,4773 | |||
| CNM / Core & Main, Inc. | 11,47 | -10,99 | 691,95 | 11,19 | 2,8997 | 0,2144 | |||
| MIDD / The Middleby Corporation | 4,73 | -14,26 | 680,76 | -18,77 | 2,8528 | -0,7632 | |||
| MKL / Markel Group Inc. | 0,34 | 75,90 | 671,85 | 87,92 | 2,8155 | 1,2728 | |||
| TSCO / Tractor Supply Company | 12,71 | 41,89 | 670,89 | 35,89 | 2,8114 | 0,6812 | |||
| ITT / ITT Inc. | 4,23 | -11,29 | 663,04 | 7,72 | 2,7785 | 0,1226 | |||
| TRMB / Trimble Inc. | 8,64 | -6,34 | 656,82 | 8,40 | 2,7525 | 0,1379 | |||
| MLM / Martin Marietta Materials, Inc. | 1,18 | -0,68 | 649,57 | 14,03 | 2,7221 | 0,2641 | |||
| BRO / Brown & Brown, Inc. | 5,75 | -8,43 | 637,03 | -18,39 | 2,6695 | -0,6984 | |||
| ALC / Alcon Inc. | 6,76 | 23,44 | 596,38 | 15,73 | 2,4992 | 0,2757 | |||
| PAYX / Paychex, Inc. | 4,05 | 15,94 | 589,32 | 9,31 | 2,4696 | 0,1434 | |||
| SCI / Service Corporation International | 6,92 | -1,29 | 563,67 | 0,19 | 2,3621 | -0,0655 | |||
| LH / Labcorp Holdings Inc. | 2,13 | -3,93 | 559,88 | 8,36 | 2,3462 | 0,1167 | |||
| TSM / Taiwan Semiconductor Manufacturing Company Limited - Depositary Receipt (Common Stock) | 2,26 | 21,92 | 511,86 | 66,35 | 2,1450 | 0,8173 | |||
| STE / STERIS plc | 2,05 | -7,35 | 493,04 | -1,80 | 2,0661 | -0,1003 | |||
| EME / EMCOR Group, Inc. | 0,91 | -12,21 | 485,07 | 27,04 | 2,0327 | 0,3851 | |||
| PWR / Quanta Services, Inc. | 1,02 | 69,32 | 384,55 | 151,85 | 1,6115 | 0,9527 | |||
| CPAY / Corpay, Inc. | 1,13 | -7,63 | 373,60 | -12,11 | 1,5656 | -0,2685 | |||
| MORN / Morningstar, Inc. | 1,11 | -5,05 | 349,50 | -0,60 | 1,4646 | -0,0526 | |||
| SIG / Signet Jewelers Limited | 3,92 | -2,82 | 311,47 | 33,15 | 1,3052 | 0,2959 | |||
| IDXX / IDEXX Laboratories, Inc. | 0,57 | 23,66 | 307,71 | 57,93 | 1,2895 | 0,4488 | |||
| CP / Canadian Pacific Kansas City Limited | 3,38 | -11,75 | 268,05 | -0,29 | 1,1233 | -0,0366 | |||
| FBIN / Fortune Brands Innovations, Inc. | 5,19 | -38,60 | 267,40 | -48,08 | 1,1206 | -1,1016 | |||
| BJ / BJ's Wholesale Club Holdings, Inc. | 2,41 | 38,64 | 260,03 | 31,02 | 1,0897 | 0,2333 | |||
| SHOP / Shopify Inc. | 2,25 | 92,50 | 259,12 | 132,56 | 1,0859 | 0,6051 | |||
| KEX / Kirby Corporation | 2,17 | 10,81 | 245,64 | 24,41 | 1,0294 | 0,1774 | |||
| NEM / Newmont Corporation | Call | 4,10 | 239,05 | 1,0018 | 1,0018 | ||||
| JLL / Jones Lang LaSalle Incorporated | 0,93 | -12,11 | 238,77 | -9,32 | 1,0006 | -0,1355 | |||
| ENTG / Entegris, Inc. | 2,92 | -28,34 | 235,45 | -33,94 | 0,9867 | -0,5512 | |||
| CAE / CAE Inc. | 7,91 | 0,58 | 231,35 | 19,68 | 0,9695 | 0,1354 | |||
| CLH / Clean Harbors, Inc. | 0,95 | -13,29 | 218,92 | 1,70 | 0,9174 | -0,0115 | |||
| TDY / Teledyne Technologies Incorporated | 0,43 | 7,12 | 218,67 | 10,26 | 0,9164 | 0,0606 | |||
| V / Visa Inc. | 0,54 | -29,71 | 191,84 | -28,79 | 0,8039 | -0,3585 | |||
| NVDA / NVIDIA Corporation | 1,09 | 172,83 | 0,7243 | 0,7243 | |||||
| WDAY / Workday, Inc. | 0,67 | 31,15 | 160,56 | 34,78 | 0,6729 | 0,1588 | |||
| TECH / Bio-Techne Corporation | 2,92 | -45,59 | 150,21 | -52,26 | 0,6295 | -0,7281 | |||
| DAY / Dayforce Inc. | 2,55 | -53,11 | 141,13 | -55,47 | 0,5914 | -0,7762 | |||
| ADBE / Adobe Inc. | 0,36 | -29,26 | 140,76 | -28,64 | 0,5899 | -0,2613 | |||
| CR / Crane Company | 0,74 | 1,12 | 139,94 | 25,35 | 0,5864 | 0,1047 | |||
| INTU / Intuit Inc. | 0,17 | -25,05 | 136,17 | -3,85 | 0,5706 | -0,0405 | |||
| PTC / PTC Inc. | 0,78 | 26,66 | 133,58 | 40,88 | 0,5598 | 0,1506 | |||
| GOOG / Alphabet Inc. | 0,69 | 66,95 | 121,83 | 89,57 | 0,5105 | 0,2332 | |||
| MSFT / Microsoft Corporation | 0,24 | 53,46 | 121,30 | 103,34 | 0,5083 | 0,2509 | |||
| NEM / Newmont Corporation | 1,92 | 111,84 | 0,4687 | 0,4687 | |||||
| CRM / Salesforce, Inc. | 0,41 | 7,26 | 110,46 | 8,99 | 0,4629 | 0,0256 | |||
| NDAQ / Nasdaq, Inc. | 1,23 | 110,26 | 0,4621 | 0,4621 | |||||
| ZTS / Zoetis Inc. | 0,69 | 95,25 | 108,19 | 84,93 | 0,4534 | 0,2010 | |||
| COO / The Cooper Companies, Inc. | 1,44 | 92,49 | 102,60 | 62,39 | 0,4300 | 0,1573 | |||
| AVGO / Broadcom Inc. | 0,36 | 1 445,11 | 99,31 | 2 444,43 | 0,4162 | 0,3993 | |||
| APO / Apollo Global Management, Inc. | 0,69 | 52,86 | 97,78 | 58,36 | 0,4098 | 0,1433 | |||
| AMZN / Amazon.com, Inc. | 0,43 | 7,65 | 95,22 | 24,13 | 0,3990 | 0,0680 | |||
| APG / APi Group Corporation | 1,86 | -58,77 | 95,16 | -41,14 | 0,3988 | -0,2989 | |||
| BKFOF / Brookfield Corporation - Preferred Stock | 1,47 | -61,61 | 91,05 | -54,69 | 0,3816 | -0,4855 | |||
| GRMN / Garmin Ltd. | 0,43 | -23,75 | 90,67 | -26,70 | 0,3800 | -0,1538 | |||
| DHR / Danaher Corporation | 0,42 | 96,18 | 82,45 | 89,04 | 0,3455 | 0,1573 | |||
| FTV / Fortive Corporation | 1,57 | -65,24 | 81,71 | -75,24 | 0,3424 | -1,0815 | |||
| PKG / Packaging Corporation of America | 0,42 | -38,74 | 79,57 | -41,70 | 0,3335 | -0,2555 | |||
| META / Meta Platforms, Inc. | 0,10 | 75,46 | 76,58 | 124,70 | 0,3209 | 0,1739 | |||
| ROL / Rollins, Inc. | 1,27 | 149,57 | 71,40 | 160,62 | 0,2992 | 0,1810 | |||
| SSNT / SilverSun Technologies, Inc. | 3,25 | 70,01 | 0,2934 | 0,2934 | |||||
| BWXT / BWX Technologies, Inc. | 0,48 | 68,90 | 0,2887 | 0,2887 | |||||
| APH / Amphenol Corporation | 0,68 | -26,56 | 66,84 | 10,57 | 0,2801 | 0,0193 | |||
| BIO / Bio-Rad Laboratories, Inc. | 0,26 | -3,47 | 61,78 | -4,35 | 0,2589 | -0,0198 | |||
| NET / Cloudflare, Inc. | 0,30 | -52,85 | 59,39 | -18,06 | 0,2489 | -0,0639 | |||
| TMO / Thermo Fisher Scientific Inc. | 0,15 | 7,78 | 59,38 | -12,18 | 0,2489 | -0,0429 | |||
| PYPL / PayPal Holdings, Inc. | 0,78 | -15,72 | 57,82 | -4,00 | 0,2423 | -0,0176 | |||
| MHK / Mohawk Industries, Inc. | 0,55 | -64,60 | 57,44 | -67,50 | 0,2407 | -0,5218 | |||
| OWL / Blue Owl Capital Inc. | 2,76 | 42,28 | 52,93 | 36,39 | 0,2218 | 0,0544 | |||
| MTD / Mettler-Toledo International Inc. | 0,04 | 46,33 | 0,1942 | 0,1942 | |||||
| KKR / KKR & Co. Inc. | 0,35 | 46,09 | 0,1931 | 0,1931 | |||||
| NET / Cloudflare, Inc. | Call | 0,23 | 1 208,57 | 44,85 | 2 174,09 | 0,1879 | 0,1794 | ||
| MIR / Mirion Technologies, Inc. | 2,03 | -11,55 | 43,65 | 31,34 | 0,1829 | 0,0395 | |||
| WSM / Williams-Sonoma, Inc. | 0,27 | -6,25 | 43,58 | -3,13 | 0,1826 | -0,0115 | |||
| NOW / ServiceNow, Inc. | 0,04 | 37,18 | 0,1558 | 0,1558 | |||||
| USLM / United States Lime & Minerals, Inc. | 0,36 | 4,83 | 35,55 | 18,37 | 0,1490 | 0,0194 | |||
| DOCU / DocuSign, Inc. | 0,46 | -6,96 | 35,48 | -10,97 | 0,1487 | -0,0233 | |||
| CARG / CarGurus, Inc. | 1,05 | 14,91 | 35,15 | 32,03 | 0,1473 | 0,0324 | |||
| FXI / iShares Trust - iShares China Large-Cap ETF | Call | 0,92 | 2,68 | 33,64 | 5,32 | 0,1410 | 0,0031 | ||
| WTM / White Mountains Insurance Group, Ltd. | 0,02 | -36,17 | 32,09 | -40,48 | 0,1345 | -0,0982 | |||
| IRDM / Iridium Communications Inc. | 1,00 | 12,87 | 30,21 | 24,64 | 0,1266 | 0,0220 | |||
| CASY / Casey's General Stores, Inc. | 0,06 | -40,26 | 30,20 | -29,77 | 0,1265 | -0,0590 | |||
| OSW / OneSpaWorld Holdings Limited | 1,42 | 4,40 | 28,93 | 26,78 | 0,1212 | 0,0228 | |||
| SPGI / S&P Global Inc. | 0,05 | -33,38 | 27,15 | -30,86 | 0,1138 | -0,0557 | |||
| MCO / Moody's Corporation | 0,05 | 24,25 | 26,87 | 33,83 | 0,1126 | 0,0260 | |||
| CWST / Casella Waste Systems, Inc. | 0,23 | 12,73 | 26,77 | 16,64 | 0,1122 | 0,0132 | |||
| CINF / Cincinnati Financial Corporation | 0,18 | -44,19 | 26,20 | -43,73 | 0,1098 | -0,0911 | |||
| GDDY / GoDaddy Inc. | 0,14 | 25,77 | 0,1080 | 0,1080 | |||||
| CHEF / The Chefs' Warehouse, Inc. | 0,39 | -13,15 | 25,10 | 1,76 | 0,1052 | -0,0012 | |||
| FMC / FMC Corporation | Call | 0,59 | 2,26 | 24,76 | 1,19 | 0,1038 | -0,0018 | ||
| MSCI / MSCI Inc. | 0,04 | 10,34 | 24,56 | 12,53 | 0,1029 | 0,0088 | |||
| RAL / Ralliant Corporation | 0,49 | 23,67 | 0,0992 | 0,0992 | |||||
| FORM / FormFactor, Inc. | 0,62 | 78,59 | 21,25 | 117,23 | 0,0890 | 0,0468 | |||
| PII / Polaris Inc. | 0,52 | -67,89 | 21,15 | -68,12 | 0,0886 | -0,1976 | |||
| FAST / Fastenal Company | 0,47 | -38,50 | 19,82 | -66,69 | 0,0831 | -0,1737 | |||
| ALKT / Alkami Technology, Inc. | 0,58 | 9,55 | 17,37 | 25,78 | 0,0728 | 0,0132 | |||
| AMRZ / Amrize AG | 0,35 | 17,18 | 0,0720 | 0,0720 | |||||
| DKS / DICK'S Sporting Goods, Inc. | 0,08 | 16,73 | 0,0701 | 0,0701 | |||||
| CDRE / Cadre Holdings, Inc. | 0,49 | 8,50 | 15,46 | 16,71 | 0,0648 | 0,0076 | |||
| KAI / Kadant Inc. | 0,04 | -44,66 | 14,17 | -47,86 | 0,0594 | -0,0579 | |||
| LLY / Eli Lilly and Company | Put | 0,02 | 114,81 | 13,56 | 102,77 | 0,0568 | 0,0280 | ||
| CSW / CSW Industrials, Inc. | 0,04 | 14,83 | 12,57 | 12,97 | 0,0527 | 0,0047 | |||
| ALRM / Alarm.com Holdings, Inc. | 0,22 | 9,08 | 12,37 | 10,88 | 0,0518 | 0,0037 | |||
| PTLO / Portillo's Inc. | 1,03 | -3,44 | 12,07 | -5,22 | 0,0506 | -0,0044 | |||
| BMI / Badger Meter, Inc. | 0,05 | 30,86 | 12,03 | 68,49 | 0,0504 | 0,0196 | |||
| ROST / Ross Stores, Inc. | 0,09 | 11,88 | 0,0498 | 0,0498 | |||||
| BL / BlackLine, Inc. | 0,21 | 112,89 | 11,87 | 148,96 | 0,0498 | 0,0292 | |||
| FELE / Franklin Electric Co., Inc. | 0,13 | 40,51 | 11,68 | 34,31 | 0,0489 | 0,0114 | |||
| KRMN / Karman Holdings Inc. | 0,23 | 15,88 | 11,44 | 74,66 | 0,0479 | 0,0197 | |||
| WAY / Waystar Holding Corp. | 0,28 | 11,25 | 0,0471 | 0,0471 | |||||
| GE / General Electric Company | 0,04 | 10,87 | 0,0456 | 0,0456 | |||||
| LAMR / Lamar Advertising Company | 0,09 | -69,68 | 10,69 | -67,66 | 0,0448 | -0,0978 | |||
| BWIN / The Baldwin Insurance Group, Inc. | 0,24 | 50,66 | 10,40 | 44,32 | 0,0436 | 0,0125 | |||
| VRRM / Verra Mobility Corporation | 0,41 | -23,14 | 10,40 | -13,31 | 0,0436 | -0,0082 | |||
| BIP / Brookfield Infrastructure Partners L.P. - Limited Partnership | 0,31 | -88,31 | 10,38 | -86,85 | 0,0435 | -0,2971 | |||
| MYRG / MYR Group Inc. | 0,06 | 34,78 | 10,34 | 116,25 | 0,0433 | 0,0227 | |||
| WINA / Winmark Corporation | 0,03 | 16,01 | 10,27 | 37,81 | 0,0430 | 0,0109 | |||
| AON / Aon plc | 0,03 | 10,00 | 0,0419 | 0,0419 | |||||
| ERII / Energy Recovery, Inc. | 0,77 | 15,37 | 9,84 | -7,22 | 0,0412 | -0,0045 | |||
| OUT / OUTFRONT Media Inc. | 0,60 | 22,57 | 9,73 | 23,93 | 0,0408 | 0,0069 | |||
| CERT / Certara, Inc. | 0,83 | -24,47 | 9,67 | -10,74 | 0,0405 | -0,0062 | |||
| BOOT / Boot Barn Holdings, Inc. | 0,06 | -38,16 | 9,64 | -12,50 | 0,0404 | -0,0071 | |||
| MLAB / Mesa Laboratories, Inc. | 0,10 | 38,30 | 9,63 | 9,82 | 0,0404 | 0,0025 | |||
| COHR / Coherent Corp. | 0,11 | -41,38 | 9,44 | -19,47 | 0,0395 | -0,0110 | |||
| ADEA / Adeia Inc. | 0,54 | 6,37 | 7,66 | 13,76 | 0,0321 | 0,0030 | |||
| FNV N / Franco-Nevada Corporation | 0,05 | 7,66 | 0,0321 | 0,0321 | |||||
| SPSC / SPS Commerce, Inc. | 0,06 | 15,28 | 7,53 | 18,20 | 0,0315 | 0,0041 | |||
| CLFD / Clearfield, Inc. | 0,17 | -3,13 | 7,41 | 41,50 | 0,0311 | 0,0085 | |||
| GOGO / Gogo Inc. | 0,50 | 24,08 | 7,34 | 111,34 | 0,0308 | 0,0158 | |||
| ACA / Arcosa, Inc. | 0,08 | 54,87 | 7,26 | 74,15 | 0,0304 | 0,0124 | |||
| JOE / The St. Joe Company | 0,13 | 6,35 | 0,0266 | 0,0266 | |||||
| CIEN / Ciena Corporation | 0,07 | -2,88 | 5,68 | 30,71 | 0,0238 | 0,0051 | |||
| CLBT / Cellebrite DI Ltd. | 0,35 | 5,56 | 0,0233 | 0,0233 | |||||
| LOAR / Loar Holdings Inc. | 0,06 | 191,83 | 5,46 | 256,07 | 0,0229 | 0,0162 | |||
| UBER / Uber Technologies, Inc. | 0,06 | -54,36 | 5,43 | -41,57 | 0,0228 | -0,0174 | |||
| MLNK / MeridianLink, Inc. | 0,32 | 3,77 | 5,18 | -9,10 | 0,0217 | -0,0029 | |||
| GSHD / Goosehead Insurance, Inc | 0,04 | 342,34 | 4,57 | 295,42 | 0,0192 | 0,0142 | |||
| MRCY / Mercury Systems, Inc. | 0,08 | 351,57 | 4,51 | 464,58 | 0,0189 | 0,0155 | |||
| EL / The Estée Lauder Companies Inc. | Call | 0,05 | -38,11 | 3,87 | -24,24 | 0,0162 | -0,0058 | ||
| PTON / Peloton Interactive, Inc. | 0,51 | 3,56 | 0,0149 | 0,0149 | |||||
| AIN / Albany International Corp. | 0,05 | -61,14 | 3,44 | -60,53 | 0,0144 | -0,0232 | |||
| PII / Polaris Inc. | Call | 0,08 | 3,11 | 0,0130 | 0,0130 | ||||
| VFC / V.F. Corporation | Call | 0,23 | 104,90 | 2,70 | 55,17 | 0,0113 | 0,0038 | ||
| TENB / Tenable Holdings, Inc. | 0,07 | 32,72 | 2,28 | 28,20 | 0,0096 | 0,0019 | |||
| DOO / BRP Inc. | 0,04 | 1,79 | 0,0075 | 0,0075 | |||||
| INTC / Intel Corporation | 0,03 | 0,58 | 0,0024 | 0,0024 | |||||
| GFS / GLOBALFOUNDRIES Inc. | 0,01 | 0,57 | 0,0024 | 0,0024 | |||||
| TRI / Thomson Reuters Corporation | 0,00 | 0,00 | 0,42 | 16,34 | 0,0018 | 0,0002 | |||
| POOL / Pool Corporation | 0,00 | -100,00 | 0,00 | 0,0000 | |||||
| ATS / ATS Corporation | 0,00 | -100,00 | 0,00 | 0,0000 | |||||
| AMD / Advanced Micro Devices, Inc. | 0,00 | -100,00 | 0,00 | -100,00 | -0,0070 | ||||
| BE / Bloom Energy Corporation | 0,00 | -100,00 | 0,00 | -100,00 | -0,0094 | ||||
| RMD / ResMed Inc. | Put | 0,00 | -100,00 | 0,00 | 0,0000 | ||||
| TYL / Tyler Technologies, Inc. | 0,00 | -100,00 | 0,00 | 0,0000 | |||||
| CACI / CACI International Inc | 0,00 | -100,00 | 0,00 | 0,0000 | |||||
| IWM / iShares Trust - iShares Russell 2000 ETF | Put | 0,00 | -100,00 | 0,00 | 0,0000 | ||||
| MKC / McCormick & Company, Incorporated | 0,00 | -100,00 | 0,00 | 0,0000 | |||||
| AEIS / Advanced Energy Industries, Inc. | 0,00 | -100,00 | 0,00 | 0,0000 | |||||
| NEOG / Neogen Corporation | 0,00 | -100,00 | 0,00 | 0,0000 | |||||
| NCNO / nCino, Inc. | 0,00 | -100,00 | 0,00 | 0,0000 | |||||
| TTC / The Toro Company | 0,00 | -100,00 | 0,00 | 0,0000 | |||||
| SAIA / Saia, Inc. | 0,00 | -100,00 | 0,00 | 0,0000 | |||||
| NKE / NIKE, Inc. | 0,00 | -100,00 | 0,00 | 0,0000 | |||||
| IWR / iShares Trust - iShares Russell Mid-Cap ETF | 0,00 | -100,00 | 0,00 | 0,0000 | |||||
| CIGI / Colliers International Group Inc. | 0,00 | -100,00 | 0,00 | 0,0000 | |||||
| SSB / SouthState Bank Corporation | 0,00 | -100,00 | 0,00 | 0,0000 | |||||
| SSNC / SS&C Technologies Holdings, Inc. | 0,00 | -100,00 | 0,00 | 0,0000 | |||||
| SPOT / Spotify Technology S.A. | 0,00 | -100,00 | 0,00 | 0,0000 | |||||
| AOS / A. O. Smith Corporation | 0,00 | -100,00 | 0,00 | 0,0000 | |||||
| LNTH / Lantheus Holdings, Inc. | 0,00 | -100,00 | 0,00 | 0,0000 | |||||
| H / Hyatt Hotels Corporation | 0,00 | -100,00 | 0,00 | 0,0000 | |||||
| MRVL / Marvell Technology, Inc. | 0,00 | -100,00 | 0,00 | 0,0000 |