Statistiques de base
| Valeur du portefeuille | $ 2 004 074 000 |
| Positions actuelles | 140 |
Dernières positions, performances, ASG (à partir des dépôts 13F, 13D)
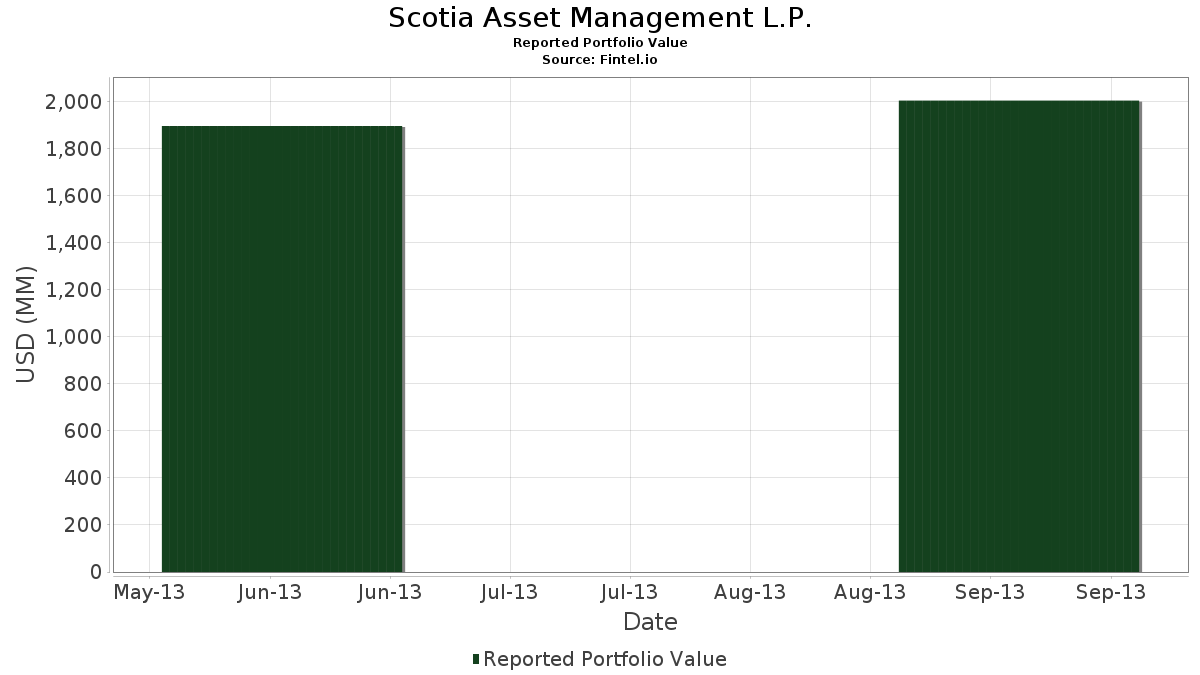
Scotia Asset Management L.P. a déclaré un total de 140 positions dans ses derniers dépôts auprès de la SEC. La valeur la plus récente du portefeuille est calculée à 2 004 074 000 USD. Les actifs sous gestion réels (ASG) sont cette valeur plus les liquidités (qui ne sont pas divulguées). Les principales positions de Scotia Asset Management L.P. sont The Toronto-Dominion Bank (US:TD) , Royal Bank of Canada (US:RY) , BCE Inc. (US:BCE) , Enbridge Inc. (US:ENB) , and TC Energy Corporation (US:TRP) . Les nouvelles positions de Scotia Asset Management L.P. incluent (US:CTRX) , Aflac Incorporated (US:AFL) , Stanley Black & Decker, Inc. (US:SWK) , Agilent Technologies, Inc. (US:A) , and Franklin Resources, Inc. (US:BEN) .
Meilleures augmentations ce trimestre
Nous utilisons la variation de l'allocation du portefeuille car il s'agit de l'indicateur le plus significatif. Les changements peuvent être dus à des transactions ou à des variations de prix des actions.
| Titre | Actions (en millions) |
Valeur ($ en millions) |
% du portefeuille | ΔPortefeuille % |
|---|---|---|---|---|
| 2,24 | 201,84 | 10,0713 | 10,0713 | |
| 2,75 | 176,45 | 8,8044 | 8,8044 | |
| 2,53 | 108,26 | 5,4021 | 5,4021 | |
| 2,40 | 100,22 | 5,0008 | 5,0008 | |
| 2,24 | 98,60 | 4,9198 | 4,9198 | |
| 1,46 | 83,66 | 4,1745 | 4,1745 | |
| 0,82 | 82,92 | 4,1374 | 4,1374 | |
| 1,00 | 79,92 | 3,9879 | 3,9879 | |
| 2,11 | 75,55 | 3,7699 | 3,7699 | |
| 1,12 | 74,57 | 3,7208 | 3,7208 |
Principales baisses ce trimestre
Nous utilisons la variation de l'allocation du portefeuille car il s'agit de l'indicateur le plus significatif. Les changements peuvent être dus à des transactions ou à des variations de prix des actions.
| Titre | Actions (en millions) |
Valeur ($ en millions) |
% du portefeuille | ΔPortefeuille % |
|---|
Déclarations 13F et dépôts de fonds
Ce formulaire a été déposé le 2013-11-14 pour la période de déclaration 2013-09-30. Cliquez sur l'icône du lien pour voir l'historique complet des transactions.
Mettre à niveau pour débloquer les données premium et exporter vers Excel ![]() .
.
| Titre | Type | Prix moyen de l'action | Actions (en millions) |
ΔActions (%) |
ΔActions (%) |
Valeur ($ en millions) |
Portefeuille (%) |
ΔPortefeuille (%) |
|
|---|---|---|---|---|---|---|---|---|---|
| TD / The Toronto-Dominion Bank | 2,24 | 2,28 | 201,84 | 14,59 | 10,0713 | 10,0713 | |||
| RY / Royal Bank of Canada | 2,75 | 3,92 | 176,45 | 14,21 | 8,8044 | 8,8044 | |||
| BCE / BCE Inc. | 2,53 | -13,91 | 108,26 | -10,32 | 5,4021 | 5,4021 | |||
| ENB / Enbridge Inc. | 2,40 | 1,17 | 100,22 | 0,45 | 5,0008 | 5,0008 | |||
| TRP / TC Energy Corporation | 2,24 | -5,19 | 98,60 | -3,32 | 4,9198 | 4,9198 | |||
| BNS / The Bank of Nova Scotia | 1,46 | 9,14 | 83,66 | 16,87 | 4,1745 | 4,1745 | |||
| CNI / Canadian National Railway Company | 0,82 | 1,70 | 82,92 | 5,78 | 4,1374 | 4,1374 | |||
| CM / Canadian Imperial Bank of Commerce | 1,00 | -3,14 | 79,92 | 8,67 | 3,9879 | 3,9879 | |||
| SU / Suncor Energy Inc. | 2,11 | -8,50 | 75,55 | 10,93 | 3,7699 | 3,7699 | |||
| BMO / Bank of Montreal | 1,12 | 3,59 | 74,57 | 19,14 | 3,7208 | 3,7208 | |||
| RCI / Rogers Communications Inc. | 1,67 | 4,20 | 71,75 | 14,30 | 3,5802 | 3,5802 | |||
| TRI / Thomson Reuters Corporation | 1,59 | 4,03 | 55,52 | 11,42 | 2,7706 | 2,7706 | |||
| CVE / Cenovus Energy Inc. | 1,79 | 2,92 | 53,46 | 7,61 | 2,6676 | 2,6676 | |||
| TECK.B / Teck Resources Limited | 1,82 | 19,79 | 48,82 | 50,57 | 2,4362 | 2,4362 | |||
| SJRWF / Shaw Communications Inc. - Class A | 2,07 | 6,41 | 48,20 | 2,90 | 2,4053 | 2,4053 | |||
| MFC / HEXAOM | 2,66 | 12,38 | 44,03 | 16,10 | 2,1968 | 2,1968 | |||
| POT / Potash Corp. of Saskatchewan, Inc. | 1,09 | -21,90 | 34,06 | -36,02 | 1,6996 | 1,6996 | |||
| SLFYF / Sun Life Financial, Inc. - 4.75% PRF PERPETUAL CAD 25 - Cls A Ser 1 | 1,03 | 5,21 | 32,88 | 13,39 | 1,6407 | 1,6407 | |||
| MGA / Magna International Inc. | 0,40 | -12,84 | 32,76 | 0,93 | 1,6344 | 1,6344 | |||
| GG / Goldcorp, Inc. | 1,18 | 2,13 | 30,66 | 6,94 | 1,5301 | 1,5301 | |||
| ECA / EnCana Corp. | 1,56 | -4,10 | 26,98 | -2,09 | 1,3461 | 1,3461 | |||
| CNQ / Canadian Natural Resources Limited | 0,83 | -16,63 | 26,25 | -7,12 | 1,3096 | 1,3096 | |||
| TU / TELUS Corporation | 0,78 | 10,85 | 26,03 | 25,81 | 1,2987 | 1,2987 | |||
| VET / Vermilion Energy Inc. | 0,42 | -18,71 | 23,21 | -8,64 | 1,1584 | 1,1584 | |||
| BAMH / Brookfield Finance Inc - 4.625% NT REDEEM 16/10/2080 USD 25 | 0,60 | 2,44 | 22,43 | 6,57 | 1,1191 | 1,1191 | |||
| GLD / SPDR Gold Trust | 0,17 | -5,64 | 21,56 | 1,56 | 1,0756 | 1,0756 | |||
| GE / General Electric Company | 0,66 | 8,63 | 15,76 | 11,92 | 0,7863 | 0,7863 | |||
| JNJ / Johnson & Johnson | 0,18 | -1,33 | 15,45 | -0,35 | 0,7708 | 0,7708 | |||
| PFE / Pfizer Inc. | 0,45 | 7,68 | 12,92 | 10,45 | 0,6445 | 0,6445 | |||
| AGU / Agrium Inc. | 0,14 | 5,55 | 11,74 | 2,26 | 0,5860 | 0,5860 | |||
| IMO / Imperial Oil Limited | 0,26 | -7,25 | 11,21 | 6,62 | 0,5593 | 0,5593 | |||
| THI / Tim Hortons, Inc. | 0,18 | -31,34 | 10,38 | -26,42 | 0,5177 | 0,5177 | |||
| PG / The Procter & Gamble Company | 0,13 | 11,58 | 9,52 | 9,57 | 0,4751 | 0,4751 | |||
| WFC / Wells Fargo & Company | 0,21 | 9,15 | 8,54 | 9,29 | 0,4260 | 0,4260 | |||
| 91911K102 / Bausch Health Companies | 0,08 | -4,36 | 8,48 | 15,58 | 0,4230 | 0,4230 | |||
| MCD / McDonald's Corporation | 0,09 | 14,85 | 8,24 | 11,63 | 0,4113 | 0,4113 | |||
| IBM / International Business Machines Corporation | 0,04 | 5,53 | 7,73 | 2,28 | 0,3857 | 0,3857 | |||
| PEP / PepsiCo, Inc. | 0,09 | 1,61 | 7,19 | -1,22 | 0,3587 | 0,3587 | |||
| SPY / SPDR S&P 500 ETF | 0,04 | -0,41 | 7,02 | 4,31 | 0,3501 | 0,3501 | |||
| TLM / | 0,58 | -15,45 | 6,68 | -15,02 | 0,3333 | 0,3333 | |||
| MSFT / Microsoft Corporation | 0,20 | -2,04 | 6,59 | -5,49 | 0,3288 | 0,3288 | |||
| GOLD / Barrick Mining Corporation | 0,35 | -60,75 | 6,58 | -53,72 | 0,3281 | 0,3281 | |||
| JPM / JPMorgan Chase & Co. | 0,12 | 12,60 | 5,98 | 10,27 | 0,2984 | 0,2984 | |||
| DOV / Dover Corporation | 0,07 | -0,91 | 5,86 | 14,65 | 0,2922 | 0,2922 | |||
| PM / Philip Morris International Inc. | 0,06 | 26,80 | 5,09 | 26,76 | 0,2538 | 0,2538 | |||
| VFC / V.F. Corporation | 0,03 | 8,55 | 5,07 | 11,94 | 0,2531 | 0,2531 | |||
| VZ / Verizon Communications Inc. | 0,11 | 9,44 | 5,00 | 1,50 | 0,2495 | 0,2495 | |||
| XOM / Exxon Mobil Corporation | 0,06 | 6,21 | 4,79 | 1,16 | 0,2388 | 0,2388 | |||
| 07317Q956 / Baytex Energy Trust | 0,11 | 1,06 | 4,69 | 15,67 | 0,2342 | 0,2342 | |||
| CTRX / | 0,09 | 4,19 | 0,2093 | 0,2093 | |||||
| ADP / Automatic Data Processing, Inc. | 0,06 | 1,87 | 4,05 | 7,11 | 0,2023 | 0,2023 | |||
| TGT / Target Corporation | 0,06 | 8,39 | 4,01 | 0,73 | 0,2003 | 0,2003 | |||
| AAPL / Apple Inc. | 0,01 | 11,95 | 3,84 | 34,79 | 0,1914 | 0,1914 | |||
| CSCO / Cisco Systems, Inc. | 0,16 | 1,03 | 3,75 | -2,67 | 0,1871 | 0,1871 | |||
| CP / Canadian Pacific Kansas City Limited | 0,03 | -0,05 | 3,69 | 1,60 | 0,1842 | 0,1842 | |||
| FNV / Franco-Nevada Corporation | 0,08 | 0,18 | 3,64 | 26,87 | 0,1814 | 0,1814 | |||
| ABBV / AbbVie Inc. | 0,08 | 11,77 | 3,63 | 20,93 | 0,1813 | 0,1813 | |||
| HON / Honeywell International Inc. | 0,04 | -6,72 | 3,62 | -2,35 | 0,1808 | 0,1808 | |||
| C / Citigroup Inc. | 0,07 | 23,90 | 3,47 | 25,34 | 0,1730 | 0,1730 | |||
| 74005P104 / Praxair, Inc. | 0,03 | 0,36 | 3,15 | 4,78 | 0,1574 | 0,1574 | |||
| GIB / CGI Inc. | 0,09 | 8,42 | 3,12 | 29,85 | 0,1554 | 0,1554 | |||
| CB / Chubb Limited | 0,03 | 15,18 | 3,10 | 21,48 | 0,1549 | 0,1549 | |||
| CVS / CVS Health Corporation | 0,05 | -8,51 | 3,09 | -9,17 | 0,1541 | 0,1541 | |||
| YRI / Yamana Gold Inc | 0,29 | -2,34 | 3,07 | 6,41 | 0,1531 | 0,1531 | |||
| QCOM / QUALCOMM Incorporated | 0,04 | 4,23 | 3,00 | 14,96 | 0,1495 | 0,1495 | |||
| MRK / Merck & Co., Inc. | 0,06 | 44,21 | 2,97 | 47,83 | 0,1480 | 0,1480 | |||
| BDX / Becton, Dickinson and Company | 0,03 | 0,75 | 2,94 | 2,01 | 0,1468 | 0,1468 | |||
| GOOGL / Alphabet Inc. | 0,00 | 15,06 | 2,92 | 14,51 | 0,1457 | 0,1457 | |||
| PAYX / Paychex, Inc. | 0,07 | -2,41 | 2,80 | 8,62 | 0,1396 | 0,1396 | |||
| USB / U.S. Bancorp | 0,07 | 9,62 | 2,71 | 10,92 | 0,1354 | 0,1354 | |||
| MMM / 3M Company | 0,02 | 2,58 | 2,62 | 12,03 | 0,1306 | 0,1306 | |||
| DOW / Dow Inc. | 0,04 | 61,69 | 2,39 | 80,38 | 0,1193 | 0,0494 | |||
| VIAB / Viacom, Inc. | 0,03 | 9,22 | 2,35 | 34,21 | 0,1171 | 0,1171 | |||
| BAC / Bank of America Corporation | 0,17 | -22,94 | 2,28 | -17,28 | 0,1139 | 0,1139 | |||
| FDO / | 0,03 | 10,45 | 2,21 | 27,66 | 0,1101 | 0,1101 | |||
| ORCL / Oracle Corporation | 0,07 | 15,39 | 2,20 | 24,62 | 0,1096 | 0,1096 | |||
| WMT / Walmart Inc. | 0,03 | 23,57 | 2,09 | 22,72 | 0,1043 | 0,1043 | |||
| CCJ / Cameco Corporation | 0,11 | -15,91 | 2,00 | -26,53 | 0,0996 | 0,0996 | |||
| ABT / Abbott Laboratories | 0,06 | 769,13 | 1,89 | 727,07 | 0,0945 | 0,0945 | |||
| OXY / Occidental Petroleum Corporation | 0,02 | 3,64 | 1,82 | 8,66 | 0,0908 | 0,0908 | |||
| BPR / Brookfield Property REIT Inc. | 0,09 | -9,03 | 1,80 | -12,83 | 0,0899 | 0,0899 | |||
| COP / ConocoPhillips | 0,02 | -3,77 | 1,68 | 10,56 | 0,0836 | 0,0836 | |||
| CVX / Chevron Corporation | 0,01 | 4,44 | 1,57 | 7,24 | 0,0783 | 0,0783 | |||
| CMCSA / Comcast Corporation | 0,03 | 54,70 | 1,49 | 66,85 | 0,0743 | 0,0743 | |||
| UNP / Union Pacific Corporation | 0,01 | 10,22 | 1,46 | 10,93 | 0,0730 | 0,0730 | |||
| DHR / Danaher Corporation | 0,02 | 7,39 | 1,46 | 17,65 | 0,0729 | 0,0729 | |||
| HD / The Home Depot, Inc. | 0,02 | -1,78 | 1,40 | -3,77 | 0,0700 | 0,0700 | |||
| MDT / Medtronic plc | 0,03 | -4,32 | 1,39 | -0,99 | 0,0696 | 0,0696 | |||
| AFL / Aflac Incorporated | 0,02 | 1,39 | 0,0696 | 0,0696 | |||||
| CL / Colgate-Palmolive Company | 0,02 | -2,94 | 1,35 | 0,45 | 0,0673 | 0,0673 | |||
| CAE / CAE Inc. | 0,12 | -0,01 | 1,28 | 5,51 | 0,0640 | 0,0640 | |||
| PPL / Pembina Pipeline Corporation | 0,04 | -91,49 | 1,23 | -90,79 | 0,0613 | 0,0613 | |||
| CINF / Cincinnati Financial Corporation | 0,02 | 22,75 | 1,09 | 26,15 | 0,0546 | 0,0546 | |||
| 112823109 / Brookfield Canada Office Properties | 0,04 | 0,00 | 1,04 | 2,88 | 0,0517 | 0,0517 | |||
| SWK / Stanley Black & Decker, Inc. | 0,01 | 1,02 | 0,0507 | 0,0507 | |||||
| T / AT&T Inc. | 0,03 | 5,44 | 0,95 | 0,74 | 0,0475 | 0,0475 | |||
| AEM / Agnico Eagle Mines Limited | 0,03 | -77,31 | 0,92 | -78,23 | 0,0461 | 0,0461 | |||
| CAH / Cardinal Health, Inc. | 0,02 | -44,24 | 0,90 | -38,36 | 0,0451 | 0,0451 | |||
| A / Agilent Technologies, Inc. | 0,02 | 0,86 | 0,0431 | 0,0431 | |||||
| AXXDF / Alderon Iron Ore Corp. | 0,56 | 21,74 | 0,83 | 90,18 | 0,0416 | 0,0416 | |||
| KMB / Kimberly-Clark Corporation | 0,01 | -4,32 | 0,77 | -7,21 | 0,0385 | 0,0385 | |||
| SDY / SPDR Series Trust - SPDR S&P Dividend ETF | 0,01 | 5,27 | 0,74 | 9,43 | 0,0371 | 0,0371 | |||
| TAC / TransAlta Corporation | 0,05 | 5,31 | 0,70 | -0,29 | 0,0348 | 0,0348 | |||
| BWA / BorgWarner Inc. | 0,01 | 0,00 | 0,68 | 17,65 | 0,0339 | 0,0339 | |||
| PPG / PPG Industries, Inc. | 0,00 | -27,47 | 0,63 | -17,26 | 0,0313 | 0,0313 | |||
| GM / General Motors Company | 0,02 | 0,00 | 0,63 | 8,09 | 0,0313 | 0,0313 | |||
| EMR / Emerson Electric Co. | 0,01 | 5,32 | 0,62 | 24,95 | 0,0310 | 0,0310 | |||
| F / Ford Motor Company | 0,04 | 1,33 | 0,61 | 10,47 | 0,0305 | 0,0305 | |||
| LYB / LyondellBasell Industries N.V. | 0,01 | 0,00 | 0,60 | 10,54 | 0,0298 | 0,0298 | |||
| MO / Altria Group, Inc. | 0,02 | 3,03 | 0,58 | 1,05 | 0,0289 | 0,0289 | |||
| MAS / Masco Corporation | 0,03 | 0,00 | 0,58 | 9,25 | 0,0289 | 0,0289 | |||
| SLB / Schlumberger Limited | 0,01 | -18,00 | 0,52 | 1,18 | 0,0257 | 0,0257 | |||
| TXT / Textron Inc. | 0,02 | 0,00 | 0,48 | 5,99 | 0,0239 | 0,0239 | |||
| APD / Air Products and Chemicals, Inc. | 0,00 | -44,46 | 0,46 | -35,31 | 0,0229 | 0,0229 | |||
| SPG / Simon Property Group, Inc. | 0,00 | 0,00 | 0,45 | -6,12 | 0,0222 | 0,0222 | |||
| C.WSA / Citigroup, Inc. | 0,00 | -25,19 | 0,42 | -21,30 | 0,0212 | 0,0212 | |||
| PGF / Invesco Exchange-Traded Fund Trust - Invesco Financial Preferred ETF | 0,07 | -15,56 | 0,39 | 1,05 | 0,0193 | 0,0193 | |||
| KO / The Coca-Cola Company | 0,01 | 2,90 | 0,36 | -2,68 | 0,0181 | 0,0181 | |||
| GRP.U / Granite Real Estate Investment Trust | 0,01 | -4,50 | 0,36 | -0,55 | 0,0181 | 0,0181 | |||
| ACN / Accenture plc | 0,00 | -14,80 | 0,35 | -12,78 | 0,0177 | 0,0177 | |||
| ADM / Archer-Daniels-Midland Company | 0,01 | 56,88 | 0,35 | 70,67 | 0,0177 | 0,0177 | |||
| BRK.A / Berkshire Hathaway Inc. | 0,00 | 0,00 | 0,34 | 1,19 | 0,0170 | 0,0170 | |||
| SIAL / Sigma-Aldrich Corporation | 0,00 | -8,45 | 0,34 | -2,60 | 0,0168 | 0,0168 | |||
| BEN / Franklin Resources, Inc. | 0,01 | 0,33 | 0,0166 | 0,0166 | |||||
| DIS / The Walt Disney Company | 0,00 | -13,60 | 0,31 | -11,78 | 0,0153 | 0,0153 | |||
| BRK.B / Berkshire Hathaway Inc. | 0,00 | 7,13 | 0,31 | 8,48 | 0,0153 | 0,0153 | |||
| EFA / iShares Trust - iShares MSCI EAFE ETF | 0,00 | -68,96 | 0,29 | -65,43 | 0,0144 | 0,0144 | |||
| MET / MetLife, Inc. | 0,01 | -15,29 | 0,26 | -13,09 | 0,0129 | 0,0129 | |||
| ESRX / Express Scripts Holding Co. | 0,00 | -50,03 | 0,23 | -50,00 | 0,0113 | 0,0113 | |||
| TAHO / Tahoe Resources Inc. | 0,01 | -1,01 | 0,22 | 26,14 | 0,0111 | 0,0111 | |||
| ITW / Illinois Tool Works Inc. | 0,00 | -10,73 | 0,22 | -1,35 | 0,0110 | 0,0110 | |||
| NSC / Norfolk Southern Corporation | 0,00 | -8,23 | 0,22 | -2,24 | 0,0109 | 0,0109 | |||
| META / Meta Platforms, Inc. | 0,00 | 0,21 | 0,0104 | 0,0104 | |||||
| J / Jacobs Solutions Inc. | 0,00 | 0,20 | 0,0102 | 0,0102 | |||||
| WAG / | 0,00 | 0,20 | 0,0101 | 0,0101 | |||||
| NOK / Nokia Oyj - Depositary Receipt (Common Stock) | 0,02 | 0,02 | 0,15 | 73,26 | 0,0074 | 0,0029 | |||
| BB / BlackBerry Limited | 0,02 | -24,61 | 0,14 | -43,55 | 0,0070 | 0,0070 | |||
| RMX / Rubicon Minerals Corp. | 0,01 | 0,00 | 0,02 | 0,00 | 0,0009 | 0,0009 | |||
| DML / Denison Mines Corp. | 0,01 | -33,33 | 0,01 | -35,29 | 0,0005 | 0,0005 | |||
| SWSH / Swisher Hygiene, Inc. | 0,01 | 0,00 | 0,01 | -33,33 | 0,0003 | 0,0003 | |||
| FCX / Freeport-McMoRan Inc. | 0,00 | -100,00 | 0,00 | -100,00 | 0,0000 | 0,0000 | |||
| CROSSHAIR ENERGY CORP / (22765F105) | 0,00 | -100,00 | 0,00 | 0,0000 |