Statistiques de base
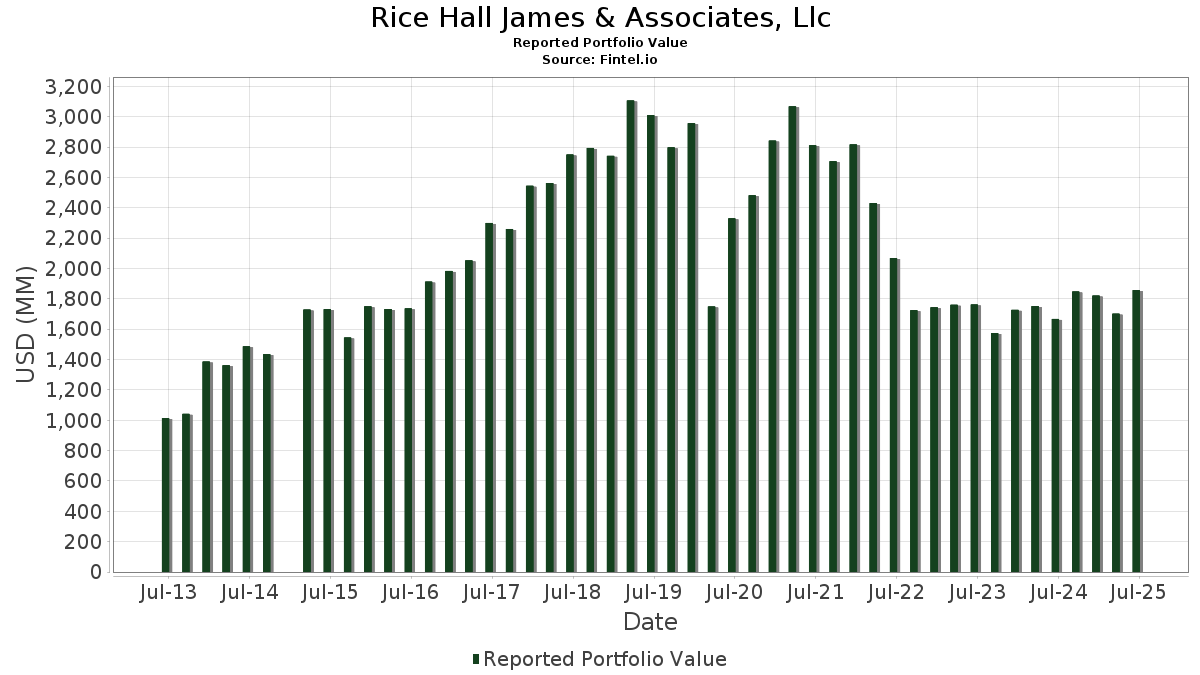
| Valeur du portefeuille | $ 1 857 081 392 |
| Positions actuelles | 247 |
Dernières positions, performances, ASG (à partir des dépôts 13F, 13D)
Rice Hall James & Associates, Llc a déclaré un total de 247 positions dans ses derniers dépôts auprès de la SEC. La valeur la plus récente du portefeuille est calculée à 1 857 081 392 USD. Les actifs sous gestion réels (ASG) sont cette valeur plus les liquidités (qui ne sont pas divulguées). Les principales positions de Rice Hall James & Associates, Llc sont Arlo Technologies, Inc. (US:ARLO) , Verona Pharma plc - Depositary Receipt (Common Stock) (US:VRNA) , Donnelley Financial Solutions, Inc. (US:DFIN) , Stride, Inc. (US:LRN) , and TKO Group Holdings, Inc. (US:TKO) . Les nouvelles positions de Rice Hall James & Associates, Llc incluent OR Royalties Inc. (DE:A417BX) , Latham Group, Inc. (US:SWIM) , MACOM Technology Solutions Holdings, Inc. (US:MTSI) , Cognex Corporation (US:CGNX) , and Costco Wholesale Corporation (US:COST) . Les principales industries de Rice Hall James & Associates, Llc sont "Apparel And Accessory Stores" (sic 56) , "Building Materials, Hardware, Garden Supply, And Mobile Home Dealers" (sic 52) , and "Paper And Allied Products" (sic 26) .
Meilleures augmentations ce trimestre
Nous utilisons la variation de l'allocation du portefeuille car il s'agit de l'indicateur le plus significatif. Les changements peuvent être dus à des transactions ou à des variations de prix des actions.
| Titre | Actions (en millions) |
Valeur ($ en millions) |
% du portefeuille | ΔPortefeuille % |
|---|---|---|---|---|
| 3,85 | 65,33 | 3,5181 | 1,1980 | |
| 0,14 | 23,44 | 1,2624 | 0,8723 | |
| 0,18 | 28,11 | 1,5136 | 0,6583 | |
| 0,83 | 51,45 | 2,7706 | 0,6489 | |
| 0,12 | 36,01 | 1,9389 | 0,5131 | |
| 0,10 | 16,33 | 0,8792 | 0,3231 | |
| 1,29 | 13,47 | 0,7252 | 0,2906 | |
| 0,34 | 38,35 | 2,0651 | 0,2286 | |
| 0,15 | 3,82 | 0,2057 | 0,2057 | |
| 0,58 | 3,71 | 0,2000 | 0,2000 |
Principales baisses ce trimestre
Nous utilisons la variation de l'allocation du portefeuille car il s'agit de l'indicateur le plus significatif. Les changements peuvent être dus à des transactions ou à des variations de prix des actions.
| Titre | Actions (en millions) |
Valeur ($ en millions) |
% du portefeuille | ΔPortefeuille % |
|---|---|---|---|---|
| 0,33 | 48,35 | 2,6036 | -0,8496 | |
| 0,90 | 41,34 | 2,2260 | -0,7502 | |
| 0,08 | 8,37 | 0,4508 | -0,5123 | |
| 0,13 | 24,75 | 1,3329 | -0,4721 | |
| 0,54 | 43,11 | 2,3214 | -0,4327 | |
| 0,72 | 45,48 | 2,4489 | -0,3955 | |
| 0,70 | 25,88 | 1,3935 | -0,3676 | |
| 0,31 | 31,66 | 1,7050 | -0,3206 | |
| 0,53 | 12,18 | 0,6558 | -0,1944 | |
| 0,26 | 47,17 | 2,5400 | -0,1821 |
Déclarations 13D/G
Il s'agit d'une liste des déclarations 13D et 13G déposées au cours de la dernière année (le cas échéant). Cliquez sur l'icône du lien pour voir l'historique complet des transactions. Les lignes vertes indiquent de nouvelles positions. Les lignes rouges indiquent des positions fermées.
| Date de dépôt | Formulaire | Titre | Actions précédentes |
Actions actuelles |
ΔActions % | % de participation |
% ΔParticipation | |
|---|---|---|---|---|---|---|---|---|
| 2025-05-01 | TRAK / ReposiTrak, Inc. | 1 016 408 | 853 131 | -16,06 | 4,67 | -16,61 | ||
| 2025-02-03 | CNTY / Century Casinos, Inc. | 1 408 036 | 1 588 310 | 12,80 | 5,18 | 9,98 |
Déclarations 13F et dépôts de fonds
Ce formulaire a été déposé le 2025-08-11 pour la période de déclaration 2025-06-30. Cliquez sur l'icône du lien pour voir l'historique complet des transactions.
Mettre à niveau pour débloquer les données premium et exporter vers Excel ![]() .
.
| Titre | Type | Prix moyen de l'action | Actions (en millions) |
ΔActions (%) |
ΔActions (%) |
Valeur ($ en millions) |
Portefeuille (%) |
ΔPortefeuille (%) |
|
|---|---|---|---|---|---|---|---|---|---|
| ARLO / Arlo Technologies, Inc. | 3,85 | -3,69 | 65,33 | 65,49 | 3,5181 | 1,1980 | |||
| VRNA / Verona Pharma plc - Depositary Receipt (Common Stock) | 0,61 | -26,13 | 57,50 | 10,05 | 3,0965 | 0,0257 | |||
| DFIN / Donnelley Financial Solutions, Inc. | 0,83 | 1,04 | 51,45 | 42,51 | 2,7706 | 0,6489 | |||
| LRN / Stride, Inc. | 0,33 | -28,31 | 48,35 | -17,72 | 2,6036 | -0,8496 | |||
| TKO / TKO Group Holdings, Inc. | 0,26 | -14,47 | 47,17 | 1,84 | 2,5400 | -0,1821 | |||
| WNS / WNS (Holdings) Limited | 0,72 | -8,64 | 45,48 | -6,04 | 2,4489 | -0,3955 | |||
| PBH / Prestige Consumer Healthcare Inc. | 0,54 | -0,96 | 43,11 | -8,01 | 2,3214 | -0,4327 | |||
| ACIW / ACI Worldwide, Inc. | 0,90 | -2,73 | 41,34 | -18,37 | 2,2260 | -0,7502 | |||
| LGND / Ligand Pharmaceuticals Incorporated | 0,34 | 13,50 | 38,35 | 22,72 | 2,0651 | 0,2286 | |||
| FN / Fabrinet | 0,12 | -0,52 | 36,01 | 48,42 | 1,9389 | 0,5131 | |||
| ESTA / Establishment Labs Holdings Inc. | 0,84 | 1,24 | 35,78 | 5,97 | 1,9266 | -0,0576 | |||
| FOUR / Shift4 Payments, Inc. | 0,34 | -0,78 | 33,80 | 20,35 | 1,8202 | 0,1696 | |||
| MEDP / Medpace Holdings, Inc. | 0,10 | -0,65 | 32,16 | 2,34 | 1,7315 | -0,1150 | |||
| EEFT / Euronet Worldwide, Inc. | 0,31 | -3,18 | 31,66 | -8,14 | 1,7050 | -0,3206 | |||
| AWI / Armstrong World Industries, Inc. | 0,19 | -0,75 | 31,34 | 14,44 | 1,6874 | 0,0781 | |||
| XPO / XPO, Inc. | 0,24 | -0,34 | 30,81 | 17,00 | 1,6590 | 0,1115 | |||
| YOU / Clear Secure, Inc. | 1,04 | -1,23 | 28,98 | 5,82 | 1,5604 | -0,0489 | |||
| WIX / Wix.com Ltd. | 0,18 | 99,14 | 28,11 | 93,14 | 1,5136 | 0,6583 | |||
| WEX / WEX Inc. | 0,19 | 31,13 | 27,90 | 22,67 | 1,5024 | 0,1657 | |||
| ASND / Ascendis Pharma A/S - Depositary Receipt (Common Stock) | 0,16 | -0,43 | 27,63 | 10,27 | 1,4881 | 0,0153 | |||
| DOCS / Doximity, Inc. | 0,43 | -0,80 | 26,46 | 4,86 | 1,4250 | -0,0581 | |||
| LKQ / LKQ Corporation | 0,70 | -0,74 | 25,88 | -13,65 | 1,3935 | -0,3676 | |||
| ZD / Ziff Davis, Inc. | 0,83 | 38,32 | 25,19 | 11,41 | 1,3563 | 0,0277 | |||
| AGM / Federal Agricultural Mortgage Corporation | 0,13 | -22,22 | 24,75 | -19,41 | 1,3329 | -0,4721 | |||
| DOX / Amdocs Limited | 0,26 | -0,91 | 23,84 | -1,19 | 1,2839 | -0,1342 | |||
| GTLS / Chart Industries, Inc. | 0,14 | 209,69 | 23,44 | 253,27 | 1,2624 | 0,8723 | |||
| RDWR / Radware Ltd. | 0,75 | -12,28 | 22,20 | 19,44 | 1,1955 | 0,1032 | |||
| ITRN / Ituran Location and Control Ltd. | 0,51 | 3,82 | 19,70 | 11,19 | 1,0607 | 0,0196 | |||
| BCRX / BioCryst Pharmaceuticals, Inc. | 2,06 | 1,61 | 18,46 | 21,40 | 0,9940 | 0,1004 | |||
| LMAT / LeMaitre Vascular, Inc. | 0,21 | 1,54 | 17,76 | 0,51 | 0,9564 | -0,0821 | |||
| KNSA / Kiniksa Pharmaceuticals, Ltd. | 0,64 | 2,19 | 17,66 | 27,31 | 0,9509 | 0,1358 | |||
| SUPN / Supernus Pharmaceuticals, Inc. | 0,52 | 1,70 | 16,54 | -2,12 | 0,8905 | -0,1024 | |||
| MTN / Vail Resorts, Inc. | 0,10 | 75,71 | 16,33 | 72,55 | 0,8792 | 0,3231 | |||
| TRAK / ReposiTrak, Inc. | 0,83 | -3,07 | 16,25 | -6,04 | 0,8748 | -0,1413 | |||
| FOLD / Amicus Therapeutics, Inc. | 2,76 | 37,32 | 15,82 | -3,57 | 0,8517 | -0,1122 | |||
| NGVT / Ingevity Corporation | 0,37 | 0,39 | 15,76 | 9,27 | 0,8484 | 0,0010 | |||
| CRAI / CRA International, Inc. | 0,08 | 2,23 | 15,61 | 10,60 | 0,8406 | 0,0111 | |||
| ACAD / ACADIA Pharmaceuticals Inc. | 0,67 | -0,36 | 14,45 | 29,40 | 0,7780 | 0,1218 | |||
| SSTK / Shutterstock, Inc. | 0,75 | 12,65 | 14,23 | 14,64 | 0,7664 | 0,0368 | |||
| NBIX / Neurocrine Biosciences, Inc. | 0,11 | -1,18 | 13,62 | 12,31 | 0,7335 | 0,0207 | |||
| NEXN / Nexxen International Ltd. | 1,29 | 46,05 | 13,47 | 82,10 | 0,7252 | 0,2906 | |||
| OZK / Bank OZK | 0,28 | -0,88 | 13,22 | 7,36 | 0,7121 | -0,0118 | |||
| MMS / Maximus, Inc. | 0,18 | -0,91 | 12,92 | 2,01 | 0,6959 | -0,0486 | |||
| FC / Franklin Covey Co. | 0,53 | 1,89 | 12,18 | -15,82 | 0,6558 | -0,1944 | |||
| ALKS / Alkermes plc | 0,42 | -1,10 | 12,07 | -14,31 | 0,6500 | -0,1778 | |||
| MIRM / Mirum Pharmaceuticals, Inc. | 0,23 | -1,15 | 11,81 | 11,66 | 0,6357 | 0,0144 | |||
| HROW / Harrow, Inc. | 0,37 | 25,14 | 11,32 | 43,67 | 0,6095 | 0,1465 | |||
| GNTX / Gentex Corporation | 0,45 | -0,99 | 9,82 | -6,56 | 0,5288 | -0,0888 | |||
| POOL / Pool Corporation | 0,03 | -1,18 | 9,71 | -9,52 | 0,5229 | -0,1078 | |||
| CEVA / CEVA, Inc. | 0,44 | 1,24 | 9,69 | -13,11 | 0,5218 | -0,1336 | |||
| LCII / LCI Industries | 0,10 | 1,79 | 9,25 | 6,17 | 0,4983 | -0,0139 | |||
| EOLS / Evolus, Inc. | 1,00 | 8,10 | 9,17 | -17,24 | 0,4940 | -0,1574 | |||
| ASPN / Aspen Aerogels, Inc. | 1,54 | 86,35 | 9,14 | 72,65 | 0,4923 | 0,1811 | |||
| FVRR / Fiverr International Ltd. | 0,31 | 5,42 | 9,00 | 30,57 | 0,4848 | 0,0796 | |||
| VITL / Vital Farms, Inc. | 0,23 | -3,58 | 9,00 | 21,89 | 0,4845 | 0,0507 | |||
| ETSY / Etsy, Inc. | 0,18 | -0,48 | 8,97 | 5,80 | 0,4832 | -0,0152 | |||
| ROAD / Construction Partners, Inc. | 0,08 | -16,78 | 8,79 | 23,07 | 0,4734 | 0,0536 | |||
| INSM / Insmed Incorporated | 0,09 | -1,44 | 8,73 | 30,02 | 0,4702 | 0,0755 | |||
| PRGS / Progress Software Corporation | 0,14 | 2,64 | 8,72 | 27,20 | 0,4697 | 0,0667 | |||
| RBA / RB Global, Inc. | 0,08 | -51,75 | 8,37 | -48,91 | 0,4508 | -0,5123 | |||
| OPRX / OptimizeRx Corporation | 0,61 | 5,45 | 8,20 | 64,40 | 0,4417 | 0,1484 | |||
| AEHR / Aehr Test Systems, Inc. | 0,61 | -1,27 | 7,92 | 75,12 | 0,4264 | 0,1607 | |||
| LQDT / Liquidity Services, Inc. | 0,33 | 7,90 | 7,78 | -17,92 | 0,4191 | -0,1381 | |||
| GENI / Genius Sports Limited | 0,72 | -7,23 | 7,52 | -3,61 | 0,4049 | -0,0536 | |||
| WLDN / Willdan Group, Inc. | 0,12 | 5,44 | 7,46 | 61,89 | 0,4019 | 0,1309 | |||
| VRDN / Viridian Therapeutics, Inc. | 0,52 | 42,09 | 7,21 | 47,37 | 0,3882 | 0,1007 | |||
| ADMA / ADMA Biologics, Inc. | 0,39 | -4,46 | 7,11 | -12,30 | 0,3830 | -0,0937 | |||
| PNTG / The Pennant Group, Inc. | 0,23 | -4,94 | 6,83 | 12,82 | 0,3677 | 0,0120 | |||
| MLTX / MoonLake Immunotherapeutics | 0,14 | 3,49 | 6,72 | 25,04 | 0,3617 | 0,0460 | |||
| ATEN / A10 Networks, Inc. | 0,34 | -4,72 | 6,54 | 12,83 | 0,3522 | 0,0115 | |||
| VREX / Varex Imaging Corporation | 0,75 | 30,77 | 6,53 | -2,26 | 0,3515 | -0,0410 | |||
| PCRX / Pacira BioSciences, Inc. | 0,26 | 1,08 | 6,22 | -2,80 | 0,3350 | -0,0411 | |||
| AAOI / Applied Optoelectronics, Inc. | 0,24 | 29,58 | 6,14 | 116,89 | 0,3305 | 0,1642 | |||
| SSTI / SoundThinking, Inc. | 0,45 | 6,38 | 5,84 | -18,07 | 0,3142 | -0,1043 | |||
| PRLB / Proto Labs, Inc. | 0,15 | -4,18 | 5,82 | 9,49 | 0,3136 | 0,0010 | |||
| MIR / Mirion Technologies, Inc. | 0,27 | -0,10 | 5,81 | 48,34 | 0,3128 | 0,0827 | |||
| SCPH / scPharmaceuticals Inc. | 1,47 | 5,33 | 5,61 | 52,61 | 0,3021 | 0,0860 | |||
| NPKI / NPK International Inc. | 0,66 | -5,07 | 5,58 | 39,04 | 0,3007 | 0,0647 | |||
| NSSC / Napco Security Technologies, Inc. | 0,19 | -4,35 | 5,53 | 23,37 | 0,2979 | 0,0344 | |||
| GRBK / Green Brick Partners, Inc. | 0,09 | -5,17 | 5,47 | 2,28 | 0,2946 | -0,0198 | |||
| EHC / Encompass Health Corporation | 0,04 | -0,14 | 5,06 | 20,91 | 0,2724 | 0,0265 | |||
| TTGT / TechTarget, Inc. | 0,64 | 111,70 | 4,96 | 11,07 | 0,2669 | 0,0046 | |||
| CCSI / Consensus Cloud Solutions, Inc. | 0,21 | 1,47 | 4,84 | 1,38 | 0,2605 | -0,0199 | |||
| DORM / Dorman Products, Inc. | 0,04 | -0,30 | 4,69 | 1,45 | 0,2528 | -0,0191 | |||
| AUPH / Aurinia Pharmaceuticals Inc. | 0,55 | 144,16 | 4,66 | 157,28 | 0,2511 | 0,1445 | |||
| DCO / Ducommun Incorporated | 0,06 | -7,80 | 4,65 | 31,29 | 0,2504 | 0,0422 | |||
| OABI / OmniAb, Inc. | 2,63 | 1,80 | 4,57 | -26,19 | 0,2461 | -0,1179 | |||
| HCSG / Healthcare Services Group, Inc. | 0,30 | -7,81 | 4,47 | 37,46 | 0,2405 | 0,0496 | |||
| LOB / Live Oak Bancshares, Inc. | 0,15 | -4,66 | 4,42 | 6,59 | 0,2379 | -0,0057 | |||
| LINC / Lincoln Educational Services Corporation | 0,19 | -20,74 | 4,40 | 15,11 | 0,2372 | 0,0123 | |||
| RMBS / Rambus Inc. | 0,07 | 0,17 | 4,40 | 23,85 | 0,2371 | 0,0282 | |||
| OLO / Olo Inc. | 0,49 | -7,83 | 4,38 | 35,83 | 0,2356 | 0,0463 | |||
| UFPT / UFP Technologies, Inc. | 0,02 | -7,62 | 4,38 | 11,84 | 0,2356 | 0,0056 | |||
| GXO / GXO Logistics, Inc. | 0,09 | -1,10 | 4,31 | 23,23 | 0,2320 | 0,0266 | |||
| KTOS / Kratos Defense & Security Solutions, Inc. | 0,09 | -0,15 | 4,16 | 56,20 | 0,2239 | 0,0675 | |||
| ASUR / Asure Software, Inc. | 0,41 | 5,43 | 4,04 | 7,76 | 0,2176 | -0,0028 | |||
| HAE / Haemonetics Corporation | 0,05 | -0,92 | 4,00 | 16,36 | 0,2153 | 0,0133 | |||
| MRCY / Mercury Systems, Inc. | 0,07 | 60,47 | 4,00 | 100,60 | 0,2152 | 0,0981 | |||
| GMED / Globus Medical, Inc. | 0,07 | -0,27 | 3,96 | -19,59 | 0,2134 | -0,0762 | |||
| URGN / UroGen Pharma Ltd. | 0,29 | 12,54 | 3,94 | 39,38 | 0,2124 | 0,0461 | |||
| PRO / PROS Holdings, Inc. | 0,25 | -4,41 | 3,91 | -21,34 | 0,2105 | -0,0815 | |||
| DY / Dycom Industries, Inc. | 0,02 | -19,51 | 3,90 | 29,11 | 0,2102 | 0,0325 | |||
| UTMD / Utah Medical Products, Inc. | 0,07 | -7,55 | 3,88 | -6,09 | 0,2091 | -0,0339 | |||
| HWKN / Hawkins, Inc. | 0,03 | -11,99 | 3,87 | 18,08 | 0,2082 | 0,0158 | |||
| IRMD / IRADIMED CORPORATION | 0,06 | -7,87 | 3,83 | 4,94 | 0,2061 | -0,0082 | |||
| A417BX / OR Royalties Inc. | 0,15 | 3,82 | 0,2057 | 0,2057 | |||||
| FIGS / FIGS, Inc. | 0,68 | -4,02 | 3,81 | 17,93 | 0,2054 | 0,0153 | |||
| BV / BrightView Holdings, Inc. | 0,23 | -0,15 | 3,81 | 29,50 | 0,2050 | 0,0322 | |||
| HURN / Huron Consulting Group Inc. | 0,03 | -7,99 | 3,80 | -11,78 | 0,2048 | -0,0486 | |||
| ADUS / Addus HomeCare Corporation | 0,03 | -0,20 | 3,77 | 16,26 | 0,2029 | 0,0124 | |||
| GATX / GATX Corporation | 0,02 | -0,22 | 3,75 | -1,32 | 0,2019 | -0,0214 | |||
| MGNI / Magnite, Inc. | 0,15 | -1,24 | 3,74 | 108,83 | 0,2012 | 0,0960 | |||
| CMPO / CompoSecure, Inc. | 0,26 | 5,45 | 3,73 | 36,65 | 0,2010 | 0,0405 | |||
| SWIM / Latham Group, Inc. | 0,58 | 3,71 | 0,2000 | 0,2000 | |||||
| TTEK / Tetra Tech, Inc. | 0,10 | -0,15 | 3,70 | 22,74 | 0,1994 | 0,0221 | |||
| ALG / Alamo Group Inc. | 0,02 | -8,01 | 3,70 | 12,74 | 0,1992 | 0,0063 | |||
| LNTH / Lantheus Holdings, Inc. | 0,04 | -0,22 | 3,65 | -16,31 | 0,1967 | -0,0598 | |||
| GFF / Griffon Corporation | 0,05 | -13,47 | 3,62 | -12,42 | 0,1948 | -0,0479 | |||
| APG / APi Group Corporation | 0,07 | -25,99 | 3,56 | 5,67 | 0,1917 | -0,0063 | |||
| EB / Eventbrite, Inc. | 1,34 | -30,49 | 3,53 | -13,36 | 0,1903 | -0,0494 | |||
| ANIP / ANI Pharmaceuticals, Inc. | 0,05 | -7,87 | 3,52 | -10,20 | 0,1897 | -0,0409 | |||
| GDDY / GoDaddy Inc. | 0,02 | 0,16 | 3,52 | 0,11 | 0,1894 | -0,0171 | |||
| AMSC / American Superconductor Corporation | 0,09 | 14,48 | 3,48 | 131,51 | 0,1872 | 0,0989 | |||
| VCYT / Veracyte, Inc. | 0,13 | 11,12 | 3,47 | 1,29 | 0,1867 | -0,0145 | |||
| CNTY / Century Casinos, Inc. | 1,62 | 1,60 | 3,44 | 27,17 | 0,1851 | 0,0262 | |||
| PTC / PTC Inc. | 0,02 | -0,92 | 3,23 | 10,20 | 0,1740 | 0,0017 | |||
| STRL / Sterling Infrastructure, Inc. | 0,01 | -7,99 | 3,14 | 87,56 | 0,1689 | 0,0706 | |||
| MTSI / MACOM Technology Solutions Holdings, Inc. | 0,02 | 2,96 | 0,1592 | 0,1592 | |||||
| LASR / nLIGHT, Inc. | 0,15 | -43,77 | 2,90 | 42,38 | 0,1560 | 0,0365 | |||
| MAMA / Mama's Creations, Inc. | 0,35 | -7,28 | 2,88 | 18,22 | 0,1552 | 0,0119 | |||
| THR / Thermon Group Holdings, Inc. | 0,10 | -7,84 | 2,86 | -7,05 | 0,1541 | -0,0269 | |||
| LIND / Lindblad Expeditions Holdings, Inc. | 0,24 | -7,95 | 2,82 | 15,89 | 0,1520 | 0,0088 | |||
| TRNS / Transcat, Inc. | 0,03 | -7,92 | 2,82 | 6,30 | 0,1517 | -0,0040 | |||
| CBZ / CBIZ, Inc. | 0,04 | -7,80 | 2,81 | -12,86 | 0,1515 | -0,0382 | |||
| ERII / Energy Recovery, Inc. | 0,22 | -8,12 | 2,81 | -26,10 | 0,1515 | -0,0722 | |||
| IOVA / Iovance Biotherapeutics, Inc. | 1,59 | 1,43 | 2,74 | -47,62 | 0,1474 | -0,1597 | |||
| SMP / Standard Motor Products, Inc. | 0,09 | -7,66 | 2,74 | 13,80 | 0,1474 | 0,0060 | |||
| PRMB / Primo Brands Corporation | 0,09 | -13,33 | 2,72 | -27,68 | 0,1463 | -0,0745 | |||
| NVDA / NVIDIA Corporation | 0,02 | -0,69 | 2,65 | 44,75 | 0,1427 | 0,0351 | |||
| SKY / Champion Homes, Inc. | 0,04 | -12,35 | 2,55 | -42,08 | 0,1373 | -0,1215 | |||
| CLFD / Clearfield, Inc. | 0,06 | 28,36 | 2,54 | 87,52 | 0,1368 | 0,0572 | |||
| ENSG / The Ensign Group, Inc. | 0,02 | -0,14 | 2,51 | 19,02 | 0,1352 | 0,0112 | |||
| USPH / U.S. Physical Therapy, Inc. | 0,03 | -7,74 | 2,51 | -0,32 | 0,1350 | -0,0128 | |||
| FIBK / First Interstate BancSystem, Inc. | 0,09 | -0,16 | 2,48 | 0,45 | 0,1334 | -0,0116 | |||
| CODA / Coda Octopus Group, Inc. | 0,30 | 5,57 | 2,45 | 38,41 | 0,1322 | 0,0279 | |||
| IAS / Integral Ad Science Holding Corp. | 0,29 | 24,63 | 2,44 | 28,55 | 0,1312 | 0,0198 | |||
| TRS / TriMas Corporation | 0,09 | 2,43 | 0,1311 | 0,1311 | |||||
| RGEN / Repligen Corporation | 0,02 | -0,20 | 2,41 | -2,43 | 0,1300 | -0,0154 | |||
| HRMY / Harmony Biosciences Holdings, Inc. | 0,08 | -0,37 | 2,41 | -5,16 | 0,1298 | -0,0195 | |||
| MLAB / Mesa Laboratories, Inc. | 0,03 | -7,41 | 2,39 | -26,48 | 0,1286 | -0,0623 | |||
| PLOW / Douglas Dynamics, Inc. | 0,08 | -8,06 | 2,30 | 16,62 | 0,1240 | 0,0080 | |||
| HLIO / Helios Technologies, Inc. | 0,07 | 21,24 | 2,26 | 26,06 | 0,1220 | 0,0164 | |||
| CSCO / Cisco Systems, Inc. | 0,03 | -0,25 | 2,26 | 12,16 | 0,1217 | 0,0033 | |||
| PTLO / Portillo's Inc. | 0,19 | -7,56 | 2,22 | -9,28 | 0,1195 | -0,0242 | |||
| ACLS / Axcelis Technologies, Inc. | 0,03 | -3,51 | 2,21 | 35,39 | 0,1191 | 0,0231 | |||
| CLB / Core Laboratories Inc. | 0,18 | -7,75 | 2,06 | -29,12 | 0,1109 | -0,0598 | |||
| VPG / Vishay Precision Group, Inc. | 0,07 | -7,64 | 2,05 | 7,73 | 0,1103 | -0,0014 | |||
| VVX / V2X, Inc. | 0,04 | -0,12 | 2,02 | -1,17 | 0,1089 | -0,0113 | |||
| GDYN / Grid Dynamics Holdings, Inc. | 0,17 | -7,59 | 2,01 | -31,80 | 0,1082 | -0,0650 | |||
| SRRK / Scholar Rock Holding Corporation | 0,06 | 5,89 | 2,01 | 16,61 | 0,1082 | 0,0070 | |||
| IPGP / IPG Photonics Corporation | 0,03 | -1,72 | 1,98 | 6,85 | 0,1066 | -0,0023 | |||
| PDFS / PDF Solutions, Inc. | 0,09 | 1,96 | 0,1056 | 0,1056 | |||||
| MTRN / Materion Corporation | 0,02 | -0,01 | 1,96 | -2,73 | 0,1054 | -0,0129 | |||
| TNDM / Tandem Diabetes Care, Inc. | 0,10 | -0,95 | 1,94 | -3,63 | 0,1043 | -0,0138 | |||
| UPLD / Upland Software, Inc. | 0,97 | 5,44 | 1,89 | -28,10 | 0,1018 | -0,0528 | |||
| BIGC / Commerce.com, Inc. | 0,38 | -8,02 | 1,89 | -20,19 | 0,1018 | -0,0374 | |||
| DCBO / Docebo Inc. | 0,06 | -55,01 | 1,87 | -54,65 | 0,1009 | -0,1419 | |||
| TCMD / Tactile Systems Technology, Inc. | 0,18 | 11,16 | 1,84 | -14,75 | 0,0990 | -0,0277 | |||
| JOUT / Johnson Outdoors Inc. | 0,06 | -16,15 | 1,82 | 2,18 | 0,0982 | -0,0067 | |||
| FWRG / First Watch Restaurant Group, Inc. | 0,11 | -33,10 | 1,78 | -35,54 | 0,0959 | -0,0665 | |||
| SMID / Smith-Midland Corporation | 0,05 | 5,62 | 1,74 | 14,06 | 0,0935 | 0,0041 | |||
| AXGN / Axogen, Inc. | 0,16 | -15,74 | 1,73 | -50,60 | 0,0931 | -0,1125 | |||
| CGNX / Cognex Corporation | 0,05 | 1,72 | 0,0928 | 0,0928 | |||||
| BWXT / BWX Technologies, Inc. | 0,01 | -1,10 | 1,71 | 44,38 | 0,0920 | 0,0225 | |||
| SLP / Simulations Plus, Inc. | 0,10 | -7,96 | 1,70 | -34,53 | 0,0917 | -0,0611 | |||
| VMD / Viemed Healthcare, Inc. | 0,24 | -8,12 | 1,65 | -12,83 | 0,0890 | -0,0224 | |||
| AIOT / PowerFleet, Inc. | 0,37 | -7,59 | 1,60 | -27,45 | 0,0863 | -0,0435 | |||
| LUCK / Lucky Strike Entertainment Corporation | 0,17 | 98,30 | 1,60 | 85,58 | 0,0860 | 0,0354 | |||
| HLX / Helix Energy Solutions Group, Inc. | 0,25 | -0,08 | 1,58 | -24,96 | 0,0853 | -0,0388 | |||
| CW / Curtiss-Wright Corporation | 0,00 | -0,75 | 1,55 | 52,86 | 0,0835 | 0,0239 | |||
| VICR / Vicor Corporation | 0,03 | -0,14 | 1,54 | -3,22 | 0,0827 | -0,0105 | |||
| WOOF / Petco Health and Wellness Company, Inc. | 0,53 | -8,44 | 1,51 | -15,06 | 0,0814 | -0,0232 | |||
| GO / Grocery Outlet Holding Corp. | 0,12 | 1,48 | 0,0797 | 0,0797 | |||||
| QEPC / Q.E.P. Co., Inc. | 0,12 | -3,66 | 1,47 | -27,08 | 0,0789 | -0,0392 | |||
| AVNS / Avanos Medical, Inc. | 0,12 | -7,58 | 1,45 | -21,09 | 0,0780 | -0,0298 | |||
| PLBC / Plumas Bancorp | 0,03 | 467,08 | 1,40 | 484,52 | 0,0753 | 0,0612 | |||
| TVTX / Travere Therapeutics, Inc. | 0,09 | 5,64 | 1,39 | -12,78 | 0,0746 | -0,0187 | |||
| LLY / Eli Lilly and Company | 0,00 | 0,00 | 1,32 | -5,59 | 0,0709 | -0,0111 | |||
| JNJ / Johnson & Johnson | 0,01 | -1,16 | 1,31 | -9,00 | 0,0703 | -0,0140 | |||
| ON / ON Semiconductor Corporation | 0,02 | 2,42 | 1,30 | 31,94 | 0,0699 | 0,0121 | |||
| XYL / Xylem Inc. | 0,01 | -0,52 | 1,27 | 7,71 | 0,0685 | -0,0009 | |||
| AZTA / Azenta, Inc. | 0,04 | -0,89 | 1,24 | -11,91 | 0,0665 | -0,0159 | |||
| SNBR / Sleep Number Corporation | 0,18 | 2,10 | 1,22 | 8,86 | 0,0655 | -0,0002 | |||
| BRK.A / Berkshire Hathaway Inc. | 0,00 | 0,00 | 1,19 | -8,74 | 0,0641 | -0,0126 | |||
| OMCL / Omnicell, Inc. | 0,04 | -44,05 | 1,15 | -52,96 | 0,0621 | -0,0819 | |||
| NGS / Natural Gas Services Group, Inc. | 0,04 | -32,70 | 1,15 | -20,93 | 0,0621 | -0,0236 | |||
| VMC / Vulcan Materials Company | 0,00 | -0,11 | 1,14 | 11,67 | 0,0614 | 0,0014 | |||
| DOV / Dover Corporation | 0,01 | -0,22 | 1,08 | 4,06 | 0,0580 | -0,0028 | |||
| ABBV / AbbVie Inc. | 0,01 | 5,29 | 1,01 | -6,69 | 0,0541 | -0,0092 | |||
| COST / Costco Wholesale Corporation | 0,00 | 0,99 | 0,0533 | 0,0533 | |||||
| TDY / Teledyne Technologies Incorporated | 0,00 | 1,29 | 0,93 | 4,28 | 0,0499 | -0,0023 | |||
| EXEL / Exelixis, Inc. | 0,02 | -0,04 | 0,91 | 19,32 | 0,0493 | 0,0042 | |||
| MXCT / MaxCyte, Inc. | 0,42 | -8,04 | 0,91 | -26,61 | 0,0491 | -0,0238 | |||
| IWO / iShares Trust - iShares Russell 2000 Growth ETF | 0,00 | 1,28 | 0,91 | 13,36 | 0,0489 | 0,0018 | |||
| ABT / Abbott Laboratories | 0,01 | 11,27 | 0,84 | 14,13 | 0,0453 | 0,0020 | |||
| CIEN / Ciena Corporation | 0,01 | 0,03 | 0,80 | 34,74 | 0,0430 | 0,0082 | |||
| BRK.A / Berkshire Hathaway Inc. | 0,00 | 0,00 | 0,73 | -8,77 | 0,0392 | -0,0077 | |||
| RHLD / Resolute Holdings Management, Inc. | 0,02 | 5,44 | 0,70 | 7,18 | 0,0378 | -0,0007 | |||
| EBAY / eBay Inc. | 0,01 | -0,25 | 0,69 | 9,64 | 0,0374 | 0,0002 | |||
| CR / Crane Company | 0,00 | -0,47 | 0,68 | 23,41 | 0,0366 | 0,0042 | |||
| KEX / Kirby Corporation | 0,01 | -0,34 | 0,63 | 11,84 | 0,0341 | 0,0008 | |||
| FLWS / 1-800-FLOWERS.COM, Inc. | 0,12 | -40,09 | 0,61 | -50,04 | 0,0326 | -0,0387 | |||
| IEX / IDEX Corporation | 0,00 | -0,15 | 0,59 | -3,12 | 0,0318 | -0,0040 | |||
| TFX / Teleflex Incorporated | 0,00 | 1,66 | 0,57 | -12,92 | 0,0309 | -0,0078 | |||
| JPM / JPMorgan Chase & Co. | 0,00 | 2,28 | 0,57 | 20,97 | 0,0308 | 0,0030 | |||
| CDW / CDW Corporation | 0,00 | -1,45 | 0,52 | 9,89 | 0,0281 | 0,0002 | |||
| TECH / Bio-Techne Corporation | 0,01 | 0,73 | 0,52 | -11,54 | 0,0281 | -0,0066 | |||
| EW / Edwards Lifesciences Corporation | 0,01 | -0,56 | 0,52 | 7,25 | 0,0279 | -0,0005 | |||
| CVX / Chevron Corporation | 0,00 | 2,60 | 0,51 | -12,09 | 0,0274 | -0,0067 | |||
| YMAB / Y-mAbs Therapeutics, Inc. | 0,11 | 5,75 | 0,49 | 7,63 | 0,0266 | -0,0004 | |||
| AAPL / Apple Inc. | 0,00 | 0,00 | 0,49 | -7,56 | 0,0263 | -0,0048 | |||
| BTMD / biote Corp. | 0,12 | 0,49 | 0,0263 | 0,0263 | |||||
| XOM / Exxon Mobil Corporation | 0,00 | 12,73 | 0,48 | 2,14 | 0,0257 | -0,0018 | |||
| J / Jacobs Solutions Inc. | 0,00 | 0,00 | 0,47 | 8,64 | 0,0251 | -0,0001 | |||
| KNX / Knight-Swift Transportation Holdings Inc. | 0,01 | -0,48 | 0,43 | 1,18 | 0,0231 | -0,0018 | |||
| BRKR / Bruker Corporation | 0,01 | 0,08 | 0,43 | -1,39 | 0,0230 | -0,0024 | |||
| SYY / Sysco Corporation | 0,01 | 0,00 | 0,41 | 0,73 | 0,0223 | -0,0018 | |||
| ZBH / Zimmer Biomet Holdings, Inc. | 0,00 | -7,89 | 0,41 | -25,91 | 0,0219 | -0,0103 | |||
| GBCI / Glacier Bancorp, Inc. | 0,01 | -0,81 | 0,40 | -3,41 | 0,0214 | -0,0028 | |||
| DLB / Dolby Laboratories, Inc. | 0,01 | 0,19 | 0,40 | -7,26 | 0,0213 | -0,0038 | |||
| MSFT / Microsoft Corporation | 0,00 | 4,87 | 0,40 | 39,08 | 0,0213 | 0,0046 | |||
| WMT / Walmart Inc. | 0,00 | 0,00 | 0,39 | 11,49 | 0,0209 | 0,0004 | |||
| DENN / Denny's Corporation | 0,09 | 5,80 | 0,38 | 17,90 | 0,0206 | 0,0016 | |||
| KBR / KBR, Inc. | 0,01 | -0,63 | 0,38 | -4,34 | 0,0202 | -0,0029 | |||
| MCO / Moody's Corporation | 0,00 | 12,72 | 0,35 | 21,40 | 0,0187 | 0,0019 | |||
| GJR / Strats Trust For Procter & Gambel Security - Preferred Security | 0,00 | 15,56 | 0,33 | 8,17 | 0,0178 | -0,0002 | |||
| ICLR / ICON Public Limited Company | 0,00 | -3,40 | 0,33 | -19,71 | 0,0178 | -0,0064 | |||
| BMRN / BioMarin Pharmaceutical Inc. | 0,01 | -1,90 | 0,32 | -23,61 | 0,0171 | -0,0074 | |||
| WDFC / WD-40 Company | 0,00 | 0,00 | 0,31 | -6,69 | 0,0166 | -0,0028 | |||
| MMC / Marsh & McLennan Companies, Inc. | 0,00 | 0,00 | 0,30 | -10,33 | 0,0159 | -0,0035 | |||
| CXT / Crane NXT, Co. | 0,00 | -0,11 | 0,26 | 4,94 | 0,0137 | -0,0006 | |||
| HAS / Hasbro, Inc. | 0,00 | -0,98 | 0,25 | 18,87 | 0,0136 | 0,0011 | |||
| DVN / Devon Energy Corporation | 0,01 | -0,43 | 0,25 | -15,41 | 0,0134 | -0,0039 | |||
| COLM / Columbia Sportswear Company | 0,00 | -0,71 | 0,23 | -19,86 | 0,0124 | -0,0045 | |||
| RCKT / Rocket Pharmaceuticals, Inc. | 0,09 | 5,57 | 0,23 | -61,23 | 0,0122 | -0,0221 | |||
| SBUX / Starbucks Corporation | 0,00 | 0,00 | 0,22 | -6,28 | 0,0121 | -0,0020 | |||
| PLRX / Pliant Therapeutics, Inc. | 0,16 | 5,39 | 0,19 | -9,22 | 0,0101 | -0,0021 | |||
| SWI / SolarWinds Corporation | 0,00 | -100,00 | 0,00 | 0,0000 | |||||
| OR / OR Royalties Inc. | 0,00 | -100,00 | 0,00 | 0,0000 | |||||
| HAIN / The Hain Celestial Group, Inc. | 0,00 | -100,00 | 0,00 | 0,0000 | |||||
| MEG / Montrose Environmental Group, Inc. | 0,00 | -100,00 | 0,00 | 0,0000 | |||||
| CLNE / Clean Energy Fuels Corp. | 0,00 | -100,00 | 0,00 | 0,0000 | |||||
| AIN / Albany International Corp. | 0,00 | -100,00 | 0,00 | 0,0000 | |||||
| TBRG / TruBridge, Inc. | 0,00 | -100,00 | 0,00 | 0,0000 | |||||
| OPTN / OptiNose, Inc. | 0,00 | -100,00 | 0,00 | 0,0000 | |||||
| BLBD / Blue Bird Corporation | 0,00 | -100,00 | 0,00 | 0,0000 | |||||
| ICFI / ICF International, Inc. | 0,00 | -100,00 | 0,00 | 0,0000 |