Statistiques de base
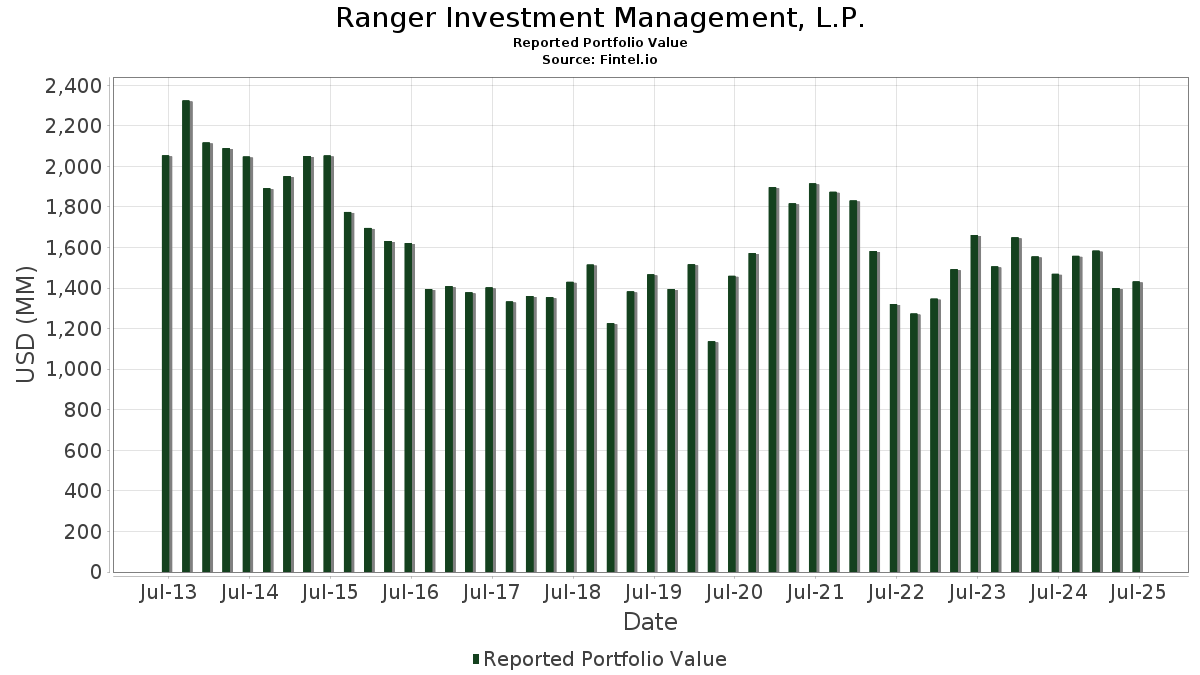
| Valeur du portefeuille | $ 1 431 956 194 |
| Positions actuelles | 72 |
Dernières positions, performances, ASG (à partir des dépôts 13F, 13D)
Ranger Investment Management, L.P. a déclaré un total de 72 positions dans ses derniers dépôts auprès de la SEC. La valeur la plus récente du portefeuille est calculée à 1 431 956 194 USD. Les actifs sous gestion réels (ASG) sont cette valeur plus les liquidités (qui ne sont pas divulguées). Les principales positions de Ranger Investment Management, L.P. sont Pegasystems Inc. (US:PEGA) , Texas Roadhouse, Inc. (US:TXRH) , Excelerate Energy, Inc. (US:EE) , ADMA Biologics, Inc. (US:ADMA) , and LeMaitre Vascular, Inc. (US:LMAT) . Les nouvelles positions de Ranger Investment Management, L.P. incluent Warby Parker Inc. (US:WRBY) , Jones Lang LaSalle Incorporated (US:JLL) , Birkenstock Holding plc (US:BIRK) , Argan, Inc. (US:AGX) , and . Les principales industries de Ranger Investment Management, L.P. sont "Paper And Allied Products" (sic 26) , "Transportation Services" (sic 47) , and "Wholesale Trade-non-durable Goods" (sic 51) .
Meilleures augmentations ce trimestre
Nous utilisons la variation de l'allocation du portefeuille car il s'agit de l'indicateur le plus significatif. Les changements peuvent être dus à des transactions ou à des variations de prix des actions.
| Titre | Actions (en millions) |
Valeur ($ en millions) |
% du portefeuille | ΔPortefeuille % |
|---|---|---|---|---|
| 1,01 | 22,20 | 1,5502 | 1,5502 | |
| 1,32 | 32,27 | 2,2538 | 1,3991 | |
| 0,06 | 20,82 | 1,4539 | 1,1074 | |
| 1,12 | 60,70 | 4,2389 | 1,0710 | |
| 0,42 | 30,96 | 2,1619 | 1,0540 | |
| 0,39 | 40,98 | 2,8619 | 1,0074 | |
| 0,30 | 34,11 | 2,3818 | 0,9535 | |
| 0,05 | 12,69 | 0,8865 | 0,8865 | |
| 2,39 | 43,53 | 3,0398 | 0,7662 | |
| 0,19 | 9,47 | 0,6611 | 0,6611 |
Principales baisses ce trimestre
Nous utilisons la variation de l'allocation du portefeuille car il s'agit de l'indicateur le plus significatif. Les changements peuvent être dus à des transactions ou à des variations de prix des actions.
| Titre | Actions (en millions) |
Valeur ($ en millions) |
% du portefeuille | ΔPortefeuille % |
|---|---|---|---|---|
| 0,21 | 12,92 | 0,9020 | -1,1992 | |
| 0,00 | 0,00 | -1,1803 | ||
| 1,33 | 27,06 | 1,8894 | -1,1405 | |
| 1,46 | 19,85 | 1,3864 | -0,9676 | |
| 0,56 | 12,61 | 0,8807 | -0,9535 | |
| 1,32 | 31,20 | 2,1785 | -0,7713 | |
| 0,39 | 6,74 | 0,4706 | -0,7473 | |
| 0,30 | 34,56 | 2,4138 | -0,5856 | |
| 0,17 | 20,89 | 1,4586 | -0,5667 | |
| 0,21 | 20,19 | 1,4100 | -0,5488 |
Déclarations 13D/G
Il s'agit d'une liste des déclarations 13D et 13G déposées au cours de la dernière année (le cas échéant). Cliquez sur l'icône du lien pour voir l'historique complet des transactions. Les lignes vertes indiquent de nouvelles positions. Les lignes rouges indiquent des positions fermées.
| Date de dépôt | Formulaire | Titre | Actions précédentes |
Actions actuelles |
ΔActions % | % de participation |
% ΔParticipation | |
|---|---|---|---|---|---|---|---|---|
| 2025-05-06 | ARIS / Aris Water Solutions, Inc. | 1 325 785 | 1 340 838 | 1,14 | 4,37 | -12,60 |
Déclarations 13F et dépôts de fonds
Ce formulaire a été déposé le 2025-08-19 pour la période de déclaration 2025-06-30. Cliquez sur l'icône du lien pour voir l'historique complet des transactions.
Mettre à niveau pour débloquer les données premium et exporter vers Excel ![]() .
.
| Titre | Type | Prix moyen de l'action | Actions (en millions) |
ΔActions (%) |
ΔActions (%) |
Valeur ($ en millions) |
Portefeuille (%) |
ΔPortefeuille (%) |
|
|---|---|---|---|---|---|---|---|---|---|
| PEGA / Pegasystems Inc. | 1,12 | 75,87 | 60,70 | 36,94 | 4,2389 | 1,0710 | |||
| TXRH / Texas Roadhouse, Inc. | 0,29 | -5,17 | 53,47 | 6,66 | 3,7340 | 0,1514 | |||
| EE / Excelerate Energy, Inc. | 1,66 | -2,77 | 48,55 | -0,60 | 3,3904 | -0,1002 | |||
| ADMA / ADMA Biologics, Inc. | 2,39 | 49,07 | 43,53 | 36,82 | 3,0398 | 0,7662 | |||
| LMAT / LeMaitre Vascular, Inc. | 0,51 | -1,61 | 42,69 | -2,61 | 2,9815 | -0,1515 | |||
| FSS / Federal Signal Corporation | 0,39 | 9,15 | 40,98 | 57,93 | 2,8619 | 1,0074 | |||
| ANIP / ANI Pharmaceuticals, Inc. | 0,53 | -6,54 | 34,86 | -8,92 | 2,4343 | -0,3007 | |||
| CWST / Casella Waste Systems, Inc. | 0,30 | -20,41 | 34,56 | -17,64 | 2,4138 | -0,5856 | |||
| LGND / Ligand Pharmaceuticals Incorporated | 0,30 | 57,83 | 34,11 | 70,65 | 2,3818 | 0,9535 | |||
| PCTY / Paylocity Holding Corporation | 0,18 | -5,07 | 32,43 | -8,19 | 2,2649 | -0,2596 | |||
| APPF / AppFolio, Inc. | 0,14 | 17,36 | 32,40 | 22,89 | 2,2624 | 0,3785 | |||
| STVN / Stevanato Group S.p.A. | 1,32 | 125,58 | 32,27 | 169,88 | 2,2538 | 1,3991 | |||
| AAON / AAON, Inc. | 0,43 | 14,07 | 32,00 | 7,68 | 2,2350 | 0,1109 | |||
| IIIV / i3 Verticals, Inc. | 1,15 | 0,31 | 31,50 | 11,73 | 2,1996 | 0,1850 | |||
| ARIS / Aris Water Solutions, Inc. | 1,32 | 2,39 | 31,20 | -24,42 | 2,1785 | -0,7713 | |||
| ULS / UL Solutions Inc. | 0,42 | 54,58 | 30,96 | 99,70 | 2,1619 | 1,0540 | |||
| HQY / HealthEquity, Inc. | 0,28 | -31,71 | 29,59 | -19,05 | 2,0666 | -0,5459 | |||
| GWRE / Guidewire Software, Inc. | 0,12 | -5,07 | 29,14 | 19,30 | 2,0348 | 0,2893 | |||
| CHE / Chemed Corporation | 0,06 | 13,31 | 28,97 | -10,34 | 2,0234 | -0,2859 | |||
| BOOT / Boot Barn Holdings, Inc. | 0,19 | -2,69 | 28,75 | 37,68 | 2,0080 | 0,5154 | |||
| OSW / OneSpaWorld Holdings Limited | 1,33 | -47,45 | 27,06 | -36,18 | 1,8894 | -1,1405 | |||
| SFM / Sprouts Farmers Market, Inc. | 0,15 | -22,59 | 24,75 | -16,51 | 1,7285 | -0,3901 | |||
| LAZ / Lazard, Inc. | 0,51 | 43,48 | 24,25 | 58,99 | 1,6934 | 0,6034 | |||
| HOMB / Home Bancshares, Inc. (Conway, AR) | 0,85 | -5,13 | 24,14 | -4,49 | 1,6855 | -0,1205 | |||
| JJSF / J&J Snack Foods Corp. | 0,20 | 52,36 | 22,74 | 31,18 | 1,5883 | 0,3492 | |||
| PDFS / PDF Solutions, Inc. | 1,05 | 19,21 | 22,35 | 33,36 | 1,5611 | 0,3632 | |||
| WRBY / Warby Parker Inc. | 1,01 | 22,20 | 1,5502 | 1,5502 | |||||
| WSC / WillScot Holdings Corporation | 0,81 | -5,15 | 22,12 | -6,51 | 1,5445 | -0,1462 | |||
| NCNO / nCino, Inc. | 0,78 | 24,15 | 21,85 | 26,41 | 1,5260 | 0,2906 | |||
| MEDP / Medpace Holdings, Inc. | 0,07 | -5,13 | 21,26 | -2,28 | 1,4849 | -0,0701 | |||
| RGEN / Repligen Corporation | 0,17 | -24,60 | 20,89 | -26,30 | 1,4586 | -0,5667 | |||
| WING / Wingstop Inc. | 0,06 | 187,64 | 20,82 | 329,41 | 1,4539 | 1,1074 | |||
| TFIN / Triumph Financial, Inc. | 0,37 | -2,10 | 20,28 | -6,66 | 1,4161 | -0,1365 | |||
| MLAB / Mesa Laboratories, Inc. | 0,21 | -7,23 | 20,19 | -26,34 | 1,4100 | -0,5488 | |||
| PR / Permian Resources Corporation | 1,46 | -38,71 | 19,85 | -39,73 | 1,3864 | -0,9676 | |||
| MMSI / Merit Medical Systems, Inc. | 0,21 | 28,04 | 19,66 | 13,23 | 1,3732 | 0,1321 | |||
| MNDY / monday.com Ltd. | 0,06 | 27,11 | 18,26 | 64,40 | 1,2754 | 0,4814 | |||
| SSD / Simpson Manufacturing Co., Inc. | 0,12 | -5,09 | 18,06 | -6,16 | 1,2612 | -0,1142 | |||
| SAIA / Saia, Inc. | 0,06 | -5,08 | 16,09 | -25,57 | 1,1235 | -0,4212 | |||
| WK / Workiva Inc. | 0,22 | -5,06 | 15,31 | -14,40 | 1,0689 | -0,2089 | |||
| KRUS / Kura Sushi USA, Inc. | 0,15 | 7,82 | 13,33 | 81,27 | 0,9307 | 0,4053 | |||
| OZK / Bank OZK | 0,28 | 8,01 | 13,32 | 16,99 | 0,9299 | 0,1164 | |||
| MSA / MSA Safety Incorporated | 0,08 | -4,98 | 12,95 | 8,52 | 0,9044 | 0,0515 | |||
| SKY / Champion Homes, Inc. | 0,21 | -33,51 | 12,92 | -56,07 | 0,9020 | -1,1992 | |||
| IRMD / IRADIMED CORPORATION | 0,21 | 7,36 | 12,85 | 22,32 | 0,8970 | 0,1465 | |||
| OII / Oceaneering International, Inc. | 0,61 | -31,23 | 12,73 | -34,66 | 0,8888 | -0,5033 | |||
| JLL / Jones Lang LaSalle Incorporated | 0,05 | 12,69 | 0,8865 | 0,8865 | |||||
| MGY / Magnolia Oil & Gas Corporation | 0,56 | -44,79 | 12,61 | -50,86 | 0,8807 | -0,9535 | |||
| CADE / Cadence Bank | 0,37 | -5,13 | 11,90 | -0,06 | 0,8307 | -0,0200 | |||
| MCB / Metropolitan Bank Holding Corp. | 0,15 | 7,41 | 10,54 | 34,29 | 0,7357 | 0,1751 | |||
| BLD / TopBuild Corp. | 0,03 | -5,30 | 9,98 | 0,53 | 0,6971 | -0,0125 | |||
| BIRK / Birkenstock Holding plc | 0,19 | 9,47 | 0,6611 | 0,6611 | |||||
| UFPT / UFP Technologies, Inc. | 0,04 | 22,55 | 9,39 | 48,35 | 0,6559 | 0,2034 | |||
| PAHC / Phibro Animal Health Corporation | 0,36 | 101,11 | 9,14 | 140,52 | 0,6385 | 0,3668 | |||
| PNTG / The Pennant Group, Inc. | 0,30 | 56,57 | 9,10 | 85,87 | 0,6356 | 0,2856 | |||
| VITL / Vital Farms, Inc. | 0,24 | 7,37 | 9,10 | 35,75 | 0,6352 | 0,1563 | |||
| KRT / Karat Packaging Inc. | 0,32 | 105,70 | 9,03 | 117,91 | 0,6304 | 0,3344 | |||
| BFST / Business First Bancshares, Inc. | 0,34 | 7,41 | 8,47 | 8,74 | 0,5917 | 0,0348 | |||
| PLOW / Douglas Dynamics, Inc. | 0,28 | 58,21 | 8,21 | 100,71 | 0,5736 | 0,2811 | |||
| NVEC / NVE Corporation | 0,11 | 7,41 | 8,21 | 24,05 | 0,5732 | 0,1003 | |||
| COCO / The Vita Coco Company, Inc. | 0,23 | 7,26 | 8,13 | 26,33 | 0,5677 | 0,1078 | |||
| LMB / Limbach Holdings, Inc. | 0,05 | -16,34 | 7,65 | 57,40 | 0,5345 | 0,1870 | |||
| SLP / Simulations Plus, Inc. | 0,39 | -44,43 | 6,74 | -60,46 | 0,4706 | -0,7473 | |||
| BLFS / BioLife Solutions, Inc. | 0,29 | -14,26 | 6,22 | -19,13 | 0,4345 | -0,1154 | |||
| QNST / QuinStreet, Inc. | 0,36 | 26,37 | 5,80 | 14,06 | 0,4050 | 0,0416 | |||
| EPM / Evolution Petroleum Corporation | 1,15 | 7,43 | 5,39 | -2,53 | 0,3763 | -0,0188 | |||
| PWP / Perella Weinberg Partners | 0,25 | 8,41 | 4,81 | 14,40 | 0,3356 | 0,0354 | |||
| CVLG / Covenant Logistics Group, Inc. | 0,18 | 4,45 | 0,3108 | 0,3108 | |||||
| GRBK / Green Brick Partners, Inc. | 0,06 | 7,33 | 3,66 | 15,75 | 0,2556 | 0,0296 | |||
| WTTR / Select Water Solutions, Inc. | 0,38 | 7,45 | 3,24 | -11,58 | 0,2266 | -0,0357 | |||
| AGX / Argan, Inc. | 0,01 | 2,95 | 0,2059 | 0,2059 | |||||
| NCMI / National CineMedia, Inc. | 0,46 | -25,24 | 2,21 | -37,98 | 0,1542 | -0,1002 | |||
| AZEK / The AZEK Company Inc. | 0,00 | -100,00 | 0,00 | 0,0000 | |||||
| KWR / Quaker Chemical Corporation | 0,00 | -100,00 | 0,00 | -100,00 | -1,1803 | ||||
| MITK / Mitek Systems, Inc. | 0,00 | -100,00 | 0,00 | 0,0000 | |||||
| SHOO / Steven Madden, Ltd. | 0,00 | -100,00 | 0,00 | 0,0000 | |||||
| INFU / InfuSystem Holdings, Inc. | 0,00 | -100,00 | 0,00 | -100,00 | -0,2096 | ||||
| ELF / e.l.f. Beauty, Inc. | 0,00 | -100,00 | 0,00 | 0,0000 | |||||
| DV / DoubleVerify Holdings, Inc. | 0,00 | -100,00 | 0,00 | -100,00 | -0,5057 | ||||
| RPAY / Repay Holdings Corporation | 0,00 | -100,00 | 0,00 | 0,0000 |