Statistiques de base
| Profil de l'initié | Philadelphia Financial Management of San Francisco, LLC |
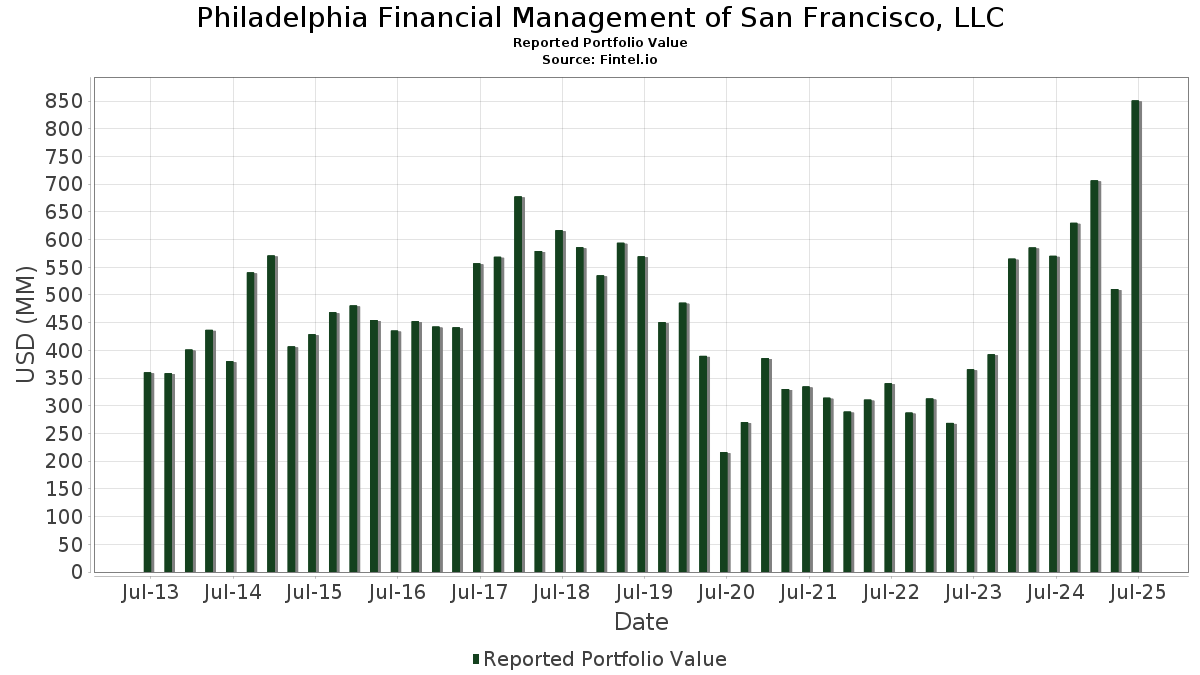
| Valeur du portefeuille | $ 850 794 332 |
| Positions actuelles | 58 |
Dernières positions, performances, ASG (à partir des dépôts 13F, 13D)
Philadelphia Financial Management of San Francisco, LLC a déclaré un total de 58 positions dans ses derniers dépôts auprès de la SEC. La valeur la plus récente du portefeuille est calculée à 850 794 332 USD. Les actifs sous gestion réels (ASG) sont cette valeur plus les liquidités (qui ne sont pas divulguées). Les principales positions de Philadelphia Financial Management of San Francisco, LLC sont iShares Trust - iShares Russell 2000 ETF (US:IWM) , The Allstate Corporation (US:ALL) , Equitable Holdings, Inc. (US:EQH) , Coinbase Global, Inc. (US:COIN) , and The Goldman Sachs Group, Inc. (US:GS) . Les nouvelles positions de Philadelphia Financial Management of San Francisco, LLC incluent The Allstate Corporation (US:ALL) , Equitable Holdings, Inc. (US:EQH) , Coinbase Global, Inc. (US:COIN) , The Goldman Sachs Group, Inc. (US:GS) , and Equitable Holdings, Inc. (US:EQH) . Les principales industries de Philadelphia Financial Management of San Francisco, LLC sont "Insurance Agents, Brokers, And Service" (sic 64) , "Non-depository Credit Institutions" (sic 61) , and "Depository Institutions" (sic 60) .
Meilleures augmentations ce trimestre
Nous utilisons la variation de l'allocation du portefeuille car il s'agit de l'indicateur le plus significatif. Les changements peuvent être dus à des transactions ou à des variations de prix des actions.
| Titre | Actions (en millions) |
Valeur ($ en millions) |
% du portefeuille | ΔPortefeuille % |
|---|---|---|---|---|
| 0,45 | 97,11 | 11,4135 | 11,4135 | |
| 0,21 | 42,40 | 4,9831 | 4,9831 | |
| 0,75 | 42,08 | 4,9454 | 4,9454 | |
| 0,10 | 35,05 | 4,1196 | 4,1196 | |
| 0,04 | 28,31 | 3,3275 | 3,3275 | |
| 0,50 | 28,05 | 3,2969 | 3,2969 | |
| 0,07 | 25,49 | 2,9959 | 2,9959 | |
| 1,70 | 23,96 | 2,8166 | 2,8166 | |
| 0,42 | 18,60 | 2,1864 | 2,1864 | |
| 0,07 | 18,02 | 2,1184 | 2,1184 |
Principales baisses ce trimestre
Nous utilisons la variation de l'allocation du portefeuille car il s'agit de l'indicateur le plus significatif. Les changements peuvent être dus à des transactions ou à des variations de prix des actions.
| Titre | Actions (en millions) |
Valeur ($ en millions) |
% du portefeuille | ΔPortefeuille % |
|---|---|---|---|---|
| 0,00 | 0,00 | -4,8390 | ||
| 0,00 | 0,00 | -3,8076 | ||
| 0,24 | 5,12 | 0,6016 | -2,2971 | |
| 1,55 | 20,20 | 2,3743 | -1,8252 | |
| 0,11 | 9,78 | 1,1497 | -1,6947 | |
| 0,76 | 15,96 | 1,8760 | -1,6865 | |
| 0,12 | 8,12 | 0,9545 | -1,6493 | |
| 0,58 | 3,55 | 0,4173 | -1,5283 | |
| 0,47 | 15,35 | 1,8037 | -1,3423 | |
| 0,61 | 14,58 | 1,7137 | -1,2374 |
Déclarations 13D/G
Il s'agit d'une liste des déclarations 13D et 13G déposées au cours de la dernière année (le cas échéant). Cliquez sur l'icône du lien pour voir l'historique complet des transactions. Les lignes vertes indiquent de nouvelles positions. Les lignes rouges indiquent des positions fermées.
| Date de dépôt | Formulaire | Titre | Actions précédentes |
Actions actuelles |
ΔActions % | % de participation |
% ΔParticipation | |
|---|---|---|---|---|---|---|---|---|
| 2025-08-14 | HMST / HomeStreet, Inc. | 1 868 053 | 1 545 583 | -17,26 | 8,20 | -17,17 | ||
| 2025-02-03 | SUNS / Sunrise Realty Trust, Inc. | 687 470 | 5,40 |
Déclarations 13F et dépôts de fonds
Ce formulaire a été déposé le 2025-08-14 pour la période de déclaration 2025-06-30. Cliquez sur l'icône du lien pour voir l'historique complet des transactions.
Mettre à niveau pour débloquer les données premium et exporter vers Excel ![]() .
.
| Titre | Type | Prix moyen de l'action | Actions (en millions) |
ΔActions (%) |
ΔActions (%) |
Valeur ($ en millions) |
Portefeuille (%) |
ΔPortefeuille (%) |
|
|---|---|---|---|---|---|---|---|---|---|
| IWM / iShares Trust - iShares Russell 2000 ETF | Put | 0,45 | 97,11 | 11,4135 | 11,4135 | ||||
| ALL / The Allstate Corporation | Call | 0,21 | 42,40 | 4,9831 | 4,9831 | ||||
| EQH / Equitable Holdings, Inc. | Put | 0,75 | 42,08 | 4,9454 | 4,9454 | ||||
| COIN / Coinbase Global, Inc. | Put | 0,10 | 35,05 | 4,1196 | 4,1196 | ||||
| GS / The Goldman Sachs Group, Inc. | Put | 0,04 | 28,31 | 3,3275 | 3,3275 | ||||
| EQH / Equitable Holdings, Inc. | Call | 0,50 | 28,05 | 3,2969 | 3,2969 | ||||
| EG / Everest Group, Ltd. | Call | 0,07 | 25,49 | 2,9959 | 2,9959 | ||||
| NAVI / Navient Corporation | 1,70 | 23,96 | 2,8166 | 2,8166 | |||||
| EG / Everest Group, Ltd. | 0,07 | 61,35 | 23,14 | 50,92 | 2,7197 | -0,2838 | |||
| MCB / Metropolitan Bank Holding Corp. | 0,31 | 38,53 | 21,82 | 73,19 | 2,5652 | 0,0966 | |||
| HMST / HomeStreet, Inc. | 1,55 | -15,36 | 20,20 | -5,77 | 2,3743 | -1,8252 | |||
| ASPI / ASP Isotopes Inc. | 2,67 | -23,88 | 19,65 | 19,45 | 2,3099 | -0,9131 | |||
| ALL / The Allstate Corporation | 0,09 | 84,08 | 18,90 | 78,96 | 2,2220 | 0,1527 | |||
| TOST / Toast, Inc. | Put | 0,42 | 18,60 | 2,1864 | 2,1864 | ||||
| RNR / RenaissanceRe Holdings Ltd. | Call | 0,07 | 18,02 | 2,1184 | 2,1184 | ||||
| HOOD / Robinhood Markets, Inc. | Put | 0,19 | 17,79 | 2,0910 | 2,0910 | ||||
| AHL / Aspen Insurance Holdings Limited | 0,51 | 16,11 | 1,8941 | 1,8941 | |||||
| CXW / CoreCivic, Inc. | 0,76 | -15,48 | 15,96 | -12,24 | 1,8760 | -1,6865 | |||
| CUBI / Customers Bancorp, Inc. | 0,27 | 15,83 | 1,8606 | 1,8606 | |||||
| SLM / SLM Corporation | 0,47 | -14,41 | 15,35 | -4,44 | 1,8037 | -1,3423 | |||
| XYZ / Block, Inc. | 0,22 | 15,26 | 1,7941 | 1,7941 | |||||
| GATX / GATX Corporation | 0,10 | 14,77 | 1,7358 | 1,7358 | |||||
| GEO / The GEO Group, Inc. | 0,61 | 18,04 | 14,58 | -3,22 | 1,7137 | -1,2374 | |||
| TH / Target Hospitality Corp. | 2,01 | 15,65 | 14,32 | 25,14 | 1,6828 | -0,5584 | |||
| HOOD / Robinhood Markets, Inc. | Call | 0,15 | 14,04 | 1,6508 | 1,6508 | ||||
| MP / MP Materials Corp. | Call | 0,39 | 12,98 | 1,5251 | 1,5251 | ||||
| COF / Capital One Financial Corporation | 0,06 | 12,24 | 1,4391 | 1,4391 | |||||
| SHOP / Shopify Inc. | Put | 0,10 | 11,54 | 1,3558 | 1,3558 | ||||
| AZ / A2Z Cust2Mate Solutions Corp. | 1,02 | 222,62 | 10,83 | 383,10 | 1,2731 | 0,8338 | |||
| FIHL / Fidelis Insurance Holdings Limited | 0,64 | 10,60 | 1,2458 | 1,2458 | |||||
| ONEW / OneWater Marine Inc. | 0,79 | 214,36 | 10,54 | 160,15 | 1,2393 | 0,4454 | |||
| UEC / Uranium Energy Corp. | 1,46 | 9,93 | 1,1669 | 1,1669 | |||||
| AGO / Assured Guaranty Ltd. | 0,11 | -31,86 | 9,78 | -32,64 | 1,1497 | -1,6947 | |||
| IPX / IperionX Limited - Depositary Receipt (Common Stock) | 0,30 | -32,89 | 9,36 | 17,51 | 1,0998 | -0,4602 | |||
| RNR / RenaissanceRe Holdings Ltd. | 0,04 | -15,67 | 9,05 | -14,66 | 1,0636 | -1,0134 | |||
| MP / MP Materials Corp. | 0,27 | 8,83 | 1,0376 | 1,0376 | |||||
| PHM / PulteGroup, Inc. | 0,08 | 8,67 | 1,0188 | 1,0188 | |||||
| USAU / U.S. Gold Corp. | 0,69 | 189,23 | 8,40 | 288,30 | 0,9868 | 0,5631 | |||
| SII / Sprott Inc. | 0,12 | -60,32 | 8,12 | -38,90 | 0,9545 | -1,6493 | |||
| BCS / Barclays PLC - Depositary Receipt (Common Stock) | 0,41 | 7,61 | 0,8941 | 0,8941 | |||||
| HCI / HCI Group, Inc. | 0,04 | 6,58 | 0,7736 | 0,7736 | |||||
| SUNS / Sunrise Realty Trust, Inc. | 0,61 | 1,83 | 6,46 | -2,49 | 0,7598 | -0,5389 | |||
| IGIC / International General Insurance Holdings Ltd. | 0,26 | 6,35 | 0,7460 | 0,7460 | |||||
| CRCL / Circle Internet Group, Inc. | 0,04 | 6,35 | 0,7458 | 0,7458 | |||||
| THG / The Hanover Insurance Group, Inc. | 0,04 | 6,25 | 0,7341 | 0,7341 | |||||
| BOW / Bowhead Specialty Holdings Inc. | 0,16 | 6,09 | 0,7154 | 0,7154 | |||||
| MHO / M/I Homes, Inc. | 0,05 | 6,07 | 0,7138 | 0,7138 | |||||
| JPM / JPMorgan Chase & Co. | 0,02 | 5,70 | 0,6703 | 0,6703 | |||||
| CRCL / Circle Internet Group, Inc. | Put | 0,03 | 5,44 | 0,6392 | 0,6392 | ||||
| TMHC / Taylor Morrison Home Corporation | 0,09 | 5,32 | 0,6252 | 0,6252 | |||||
| HG / Hamilton Insurance Group, Ltd. | 0,24 | -66,83 | 5,12 | -65,41 | 0,6016 | -2,2971 | |||
| AMRK / A-Mark Precious Metals, Inc. | 0,19 | 4,19 | 0,4926 | 0,4926 | |||||
| CORZ / Core Scientific, Inc. | 0,23 | 3,95 | 0,4643 | 0,4643 | |||||
| FIP / FTAI Infrastructure Inc. | 0,58 | -73,75 | 3,55 | -64,25 | 0,4173 | -1,5283 | |||
| SOFI / SoFi Technologies, Inc. | Put | 0,15 | 2,73 | 0,3211 | 0,3211 | ||||
| HIPO / Hippo Holdings Inc. | 0,08 | -25,71 | 2,14 | -18,85 | 0,2515 | -0,2649 | |||
| NODK / NI Holdings, Inc. | 0,15 | 19,61 | 1,92 | 6,86 | 0,2251 | -0,1260 | |||
| NFE / New Fortress Energy Inc. | 0,40 | 320,07 | 1,33 | 67,89 | 0,1562 | 0,0011 | |||
| TSLA / Tesla, Inc. | Put | 0,00 | -100,00 | 0,00 | -100,00 | -3,8076 | |||
| UNH / UnitedHealth Group Incorporated | 0,00 | -100,00 | 0,00 | 0,0000 | |||||
| LDI / loanDepot, Inc. | 0,00 | -100,00 | 0,00 | 0,0000 | |||||
| AMTB / Amerant Bancorp Inc. | 0,00 | -100,00 | 0,00 | 0,0000 | |||||
| RNST / Renasant Corporation | 0,00 | -100,00 | 0,00 | 0,0000 | |||||
| FLME / Flame Acquisition Corp. | 0,00 | -100,00 | 0,00 | 0,0000 | |||||
| PFSI / PennyMac Financial Services, Inc. | 0,00 | -100,00 | 0,00 | 0,0000 | |||||
| EWBC / East West Bancorp, Inc. | 0,00 | -100,00 | 0,00 | 0,0000 | |||||
| PGR / The Progressive Corporation | 0,00 | -100,00 | 0,00 | 0,0000 | |||||
| COOP / Mr. Cooper Group Inc. | 0,00 | -100,00 | 0,00 | 0,0000 | |||||
| ABL / Abacus Global Management, Inc. | 0,00 | -100,00 | 0,00 | 0,0000 | |||||
| EQH / Equitable Holdings, Inc. | 0,00 | -100,00 | 0,00 | -100,00 | -4,8390 | ||||
| GLNG / Golar LNG Limited | 0,00 | -100,00 | 0,00 | 0,0000 | |||||
| SLM / SLM Corporation | Call | 0,00 | -100,00 | 0,00 | 0,0000 | ||||
| C / Citigroup Inc. | 0,00 | -100,00 | 0,00 | 0,0000 | |||||
| CACC / Credit Acceptance Corporation | 0,00 | -100,00 | 0,00 | 0,0000 | |||||
| KMX / CarMax, Inc. | 0,00 | -100,00 | 0,00 | 0,0000 | |||||
| SF / Stifel Financial Corp. | 0,00 | -100,00 | 0,00 | 0,0000 | |||||
| EUFN / iShares Trust - iShares MSCI Europe Financials ETF | Put | 0,00 | -100,00 | 0,00 | 0,0000 | ||||
| BUSE / First Busey Corporation | 0,00 | -100,00 | 0,00 | 0,0000 | |||||
| AON / Aon plc | 0,00 | -100,00 | 0,00 | 0,0000 | |||||
| LGIH / LGI Homes, Inc. | 0,00 | -100,00 | 0,00 | 0,0000 | |||||
| ACVA / ACV Auctions Inc. | 0,00 | -100,00 | 0,00 | 0,0000 |