Statistiques de base
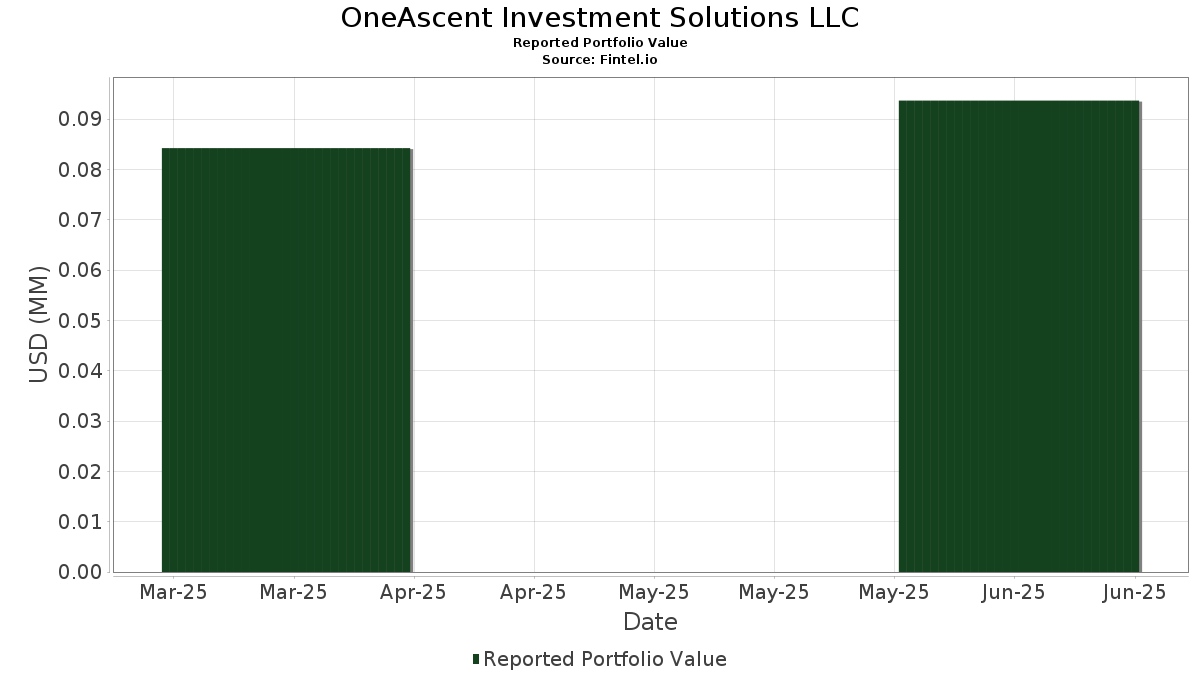
| Valeur du portefeuille | $ 93 684 |
| Positions actuelles | 135 |
Dernières positions, performances, ASG (à partir des dépôts 13F, 13D)
OneAscent Investment Solutions LLC a déclaré un total de 135 positions dans ses derniers dépôts auprès de la SEC. La valeur la plus récente du portefeuille est calculée à 93 684 USD. Les actifs sous gestion réels (ASG) sont cette valeur plus les liquidités (qui ne sont pas divulguées). Les principales positions de OneAscent Investment Solutions LLC sont Vanguard Scottsdale Funds - Vanguard Intermediate-Term Treasury ETF (US:VGIT) , Vanguard Scottsdale Funds - Vanguard Short-Term Treasury ETF (US:VGSH) , Vanguard Scottsdale Funds - Vanguard Mortgage-Backed Securities ETF (US:VMBS) , Northern Lights Fund Trust IV - Inspire Corporate Bond ETF (US:IBD) , and Unified Series Trust - OneAscent International Equity ETF (US:OAIM) . Les nouvelles positions de OneAscent Investment Solutions LLC incluent Amazon.com, Inc. (US:AMZN) , Automatic Data Processing, Inc. (US:ADP) , EQT Corporation (US:EQT) , Airbnb, Inc. (US:ABNB) , and AutoZone, Inc. (US:AZO) .
Meilleures augmentations ce trimestre
Nous utilisons la variation de l'allocation du portefeuille car il s'agit de l'indicateur le plus significatif. Les changements peuvent être dus à des transactions ou à des variations de prix des actions.
| Titre | Actions (en millions) |
Valeur ($ en millions) |
% du portefeuille | ΔPortefeuille % |
|---|---|---|---|---|
| 0,00 | 0,00 | 1,0066 | 1,0066 | |
| 0,00 | 0,00 | 0,4398 | 0,4398 | |
| 0,01 | 0,00 | 0,4366 | 0,4366 | |
| 0,00 | 0,00 | 0,4174 | 0,4174 | |
| 0,00 | 0,00 | 0,3843 | 0,3843 | |
| 0,00 | 0,00 | 0,3811 | 0,3811 | |
| 0,00 | 0,00 | 0,3555 | 0,3555 | |
| 0,00 | 0,00 | 0,3490 | 0,3490 | |
| 0,01 | 0,00 | 0,3448 | 0,3448 | |
| 0,01 | 0,00 | 1,8264 | 0,3424 |
Principales baisses ce trimestre
Nous utilisons la variation de l'allocation du portefeuille car il s'agit de l'indicateur le plus significatif. Les changements peuvent être dus à des transactions ou à des variations de prix des actions.
| Titre | Actions (en millions) |
Valeur ($ en millions) |
% du portefeuille | ΔPortefeuille % |
|---|---|---|---|---|
| 0,26 | 0,02 | 16,4233 | -0,8755 | |
| 0,09 | 0,01 | 5,5666 | -0,8380 | |
| 0,10 | 0,00 | 5,0137 | -0,5587 | |
| 0,00 | 0,00 | 0,3224 | -0,5526 | |
| 0,14 | 0,00 | 3,5716 | -0,4801 | |
| 0,12 | 0,00 | 2,8895 | -0,4095 | |
| 0,00 | 0,00 | 1,0066 | -0,4014 | |
| 0,00 | 0,00 | 0,0000 | -0,3929 | |
| 0,00 | 0,00 | 0,7258 | -0,3176 | |
| 0,01 | 0,00 | 0,6981 | -0,3015 |
Déclarations 13F et dépôts de fonds
Ce formulaire a été déposé le 2025-08-12 pour la période de déclaration 2025-06-30. Cliquez sur l'icône du lien pour voir l'historique complet des transactions.
Mettre à niveau pour débloquer les données premium et exporter vers Excel ![]() .
.
| Titre | Type | Prix moyen de l'action | Actions (en millions) |
ΔActions (%) |
ΔActions (%) |
Valeur ($ en millions) |
Portefeuille (%) |
ΔPortefeuille (%) |
|
|---|---|---|---|---|---|---|---|---|---|
| VGIT / Vanguard Scottsdale Funds - Vanguard Intermediate-Term Treasury ETF | 0,26 | 4,86 | 0,02 | 7,14 | 16,4233 | -0,8755 | |||
| VGSH / Vanguard Scottsdale Funds - Vanguard Short-Term Treasury ETF | 0,09 | -3,48 | 0,01 | 0,00 | 5,5666 | -0,8380 | |||
| VMBS / Vanguard Scottsdale Funds - Vanguard Mortgage-Backed Securities ETF | 0,10 | 0,00 | 0,00 | 0,00 | 5,0137 | -0,5587 | |||
| IBD / Northern Lights Fund Trust IV - Inspire Corporate Bond ETF | 0,14 | -3,03 | 0,00 | 0,00 | 3,5716 | -0,4801 | |||
| OAIM / Unified Series Trust - OneAscent International Equity ETF | 0,07 | 1,66 | 0,00 | 0,00 | 3,0539 | 0,1300 | |||
| OACP / Unified Series Trust - OneAscent Core Plus Bond ETF | 0,12 | -2,63 | 0,00 | 0,00 | 2,8895 | -0,4095 | |||
| NVDA / NVIDIA Corporation | 0,01 | -6,07 | 0,00 | 0,00 | 1,8264 | 0,3424 | |||
| MSFT / Microsoft Corporation | 0,00 | -16,65 | 0,00 | 0,00 | 1,7805 | -0,0121 | |||
| TSM / Taiwan Semiconductor Manufacturing Company Limited - Depositary Receipt (Common Stock) | 0,01 | -7,08 | 0,00 | 1,2905 | 0,1580 | ||||
| TT / Trane Technologies plc | 0,00 | -16,61 | 0,00 | 0,00 | 1,1955 | -0,0320 | |||
| GOOGL / Alphabet Inc. | 0,01 | -3,62 | 0,00 | 1,1678 | -0,0146 | ||||
| HDB / HDFC Bank Limited - Depositary Receipt (Common Stock) | 0,01 | -10,66 | 0,00 | 1,0386 | -0,0820 | ||||
| EQNR / Equinor ASA - Depositary Receipt (Common Stock) | 0,04 | 5,82 | 0,00 | 1,0108 | -0,1062 | ||||
| AJG / Arthur J. Gallagher & Co. | 0,00 | -14,24 | 0,00 | -100,00 | 1,0066 | -0,4014 | |||
| AMZN / Amazon.com, Inc. | 0,00 | 0,00 | 1,0066 | 1,0066 | |||||
| OAEM / Unified Series Trust - OneAscent Emerging Markets ETF | 0,03 | 6,57 | 0,00 | 0,9617 | 0,0714 | ||||
| RIO / Rio Tinto Group - Depositary Receipt (Common Stock) | 0,02 | 5,55 | 0,00 | 0,9596 | -0,0827 | ||||
| CAE / CAE Inc. | 0,03 | 0,00 | 0,00 | 0,9521 | 0,0630 | ||||
| JPM / JPMorgan Chase & Co. | 0,00 | -4,54 | 0,00 | 0,9511 | 0,0144 | ||||
| V / Visa Inc. | 0,00 | 11,39 | 0,00 | 0,8635 | 0,0124 | ||||
| INFY / Infosys Limited - Depositary Receipt (Common Stock) | 0,04 | 10,80 | 0,00 | 0,8539 | 0,0099 | ||||
| GPN / Global Payments Inc. | 0,01 | 50,38 | 0,00 | 0,8518 | 0,0814 | ||||
| WMB / The Williams Companies, Inc. | 0,01 | -15,73 | 0,00 | 0,8187 | -0,2093 | ||||
| CRH / CRH plc | 0,01 | 11,47 | 0,00 | 0,8176 | 0,0353 | ||||
| OALC / Unified Series Trust - Oneascent Large Cap Core ETF | 0,02 | 27,18 | 0,00 | 0,7525 | 0,1732 | ||||
| NDAQ / Nasdaq, Inc. | 0,01 | -0,78 | 0,00 | 0,7440 | 0,0365 | ||||
| ROP / Roper Technologies, Inc. | 0,00 | -19,58 | 0,00 | 0,7258 | -0,3176 | ||||
| ASML / ASML Holding N.V. - Depositary Receipt (Common Stock) | 0,00 | 0,96 | 0,00 | 0,7205 | 0,0640 | ||||
| ETR / Entergy Corporation | 0,01 | -20,11 | 0,00 | 0,6981 | -0,3015 | ||||
| GBDC / Golub Capital BDC, Inc. | 0,04 | -1,67 | 0,00 | 0,6671 | -0,1116 | ||||
| TCOM / Trip.com Group Limited - Depositary Receipt (Common Stock) | 0,01 | 24,77 | 0,00 | 0,6629 | 0,0230 | ||||
| STE / STERIS plc | 0,00 | -15,29 | 0,00 | 0,6447 | -0,1542 | ||||
| MA / Mastercard Incorporated | 0,00 | 0,67 | 0,00 | 0,6330 | -0,0496 | ||||
| EGP / EastGroup Properties, Inc. | 0,00 | -11,08 | 0,00 | 0,6255 | -0,1995 | ||||
| UL / Unilever PLC - Depositary Receipt (Common Stock) | 0,01 | 1,00 | 0,00 | 0,6202 | -0,0446 | ||||
| NVT / nVent Electric plc | 0,01 | -19,72 | 0,00 | 0,6116 | 0,0062 | ||||
| T / AT&T Inc. | 0,02 | 21,24 | 0,00 | 0,5796 | 0,0596 | ||||
| PG / The Procter & Gamble Company | 0,00 | 38,91 | 0,00 | 0,5764 | 0,0826 | ||||
| LRCX / Lam Research Corporation | 0,01 | 64,66 | 0,00 | 0,5764 | 0,2856 | ||||
| GEV / GE Vernova Inc. | 0,00 | -2,34 | 0,00 | 0,5647 | 0,1931 | ||||
| BKNG / Booking Holdings Inc. | 0,00 | 0,00 | 0,00 | 0,5625 | 0,0651 | ||||
| VRSK / Verisk Analytics, Inc. | 0,00 | 6,42 | 0,00 | 0,5625 | 0,0010 | ||||
| PNR / Pentair plc | 0,01 | 0,06 | 0,00 | 0,5593 | 0,0299 | ||||
| WMT / Walmart Inc. | 0,01 | -20,13 | 0,00 | 0,5593 | -0,1399 | ||||
| SHW / The Sherwin-Williams Company | 0,00 | -8,86 | 0,00 | 0,5583 | -0,1338 | ||||
| HLI / Houlihan Lokey, Inc. | 0,00 | -8,97 | 0,00 | 0,5540 | -0,0526 | ||||
| ROL / Rollins, Inc. | 0,01 | -11,72 | 0,00 | 0,5519 | -0,1141 | ||||
| RPRX / Royalty Pharma plc | 0,01 | 26,68 | 0,00 | 0,5508 | 0,1329 | ||||
| CRM / Salesforce, Inc. | 0,00 | 1,09 | 0,00 | 0,5401 | -0,0440 | ||||
| MSI / Motorola Solutions, Inc. | 0,00 | -6,26 | 0,00 | 0,5380 | -0,1268 | ||||
| TMUS / T-Mobile US, Inc. | 0,00 | 10,49 | 0,00 | 0,5198 | -0,0654 | ||||
| KLAC / KLA Corporation | 0,00 | -23,19 | 0,00 | 0,5070 | -0,0497 | ||||
| LAD / Lithia Motors, Inc. | 0,00 | 52,97 | 0,00 | 0,5017 | 0,1847 | ||||
| ODFL / Old Dominion Freight Line, Inc. | 0,00 | -8,53 | 0,00 | 0,4996 | -0,1201 | ||||
| PGR / The Progressive Corporation | 0,00 | 12,29 | 0,00 | 0,4921 | -0,0243 | ||||
| WDAY / Workday, Inc. | 0,00 | -5,59 | 0,00 | 0,4803 | -0,0693 | ||||
| MRK / Merck & Co., Inc. | 0,01 | 51,48 | 0,00 | 0,4782 | 0,0793 | ||||
| GPI / Group 1 Automotive, Inc. | 0,00 | 16,36 | 0,00 | 0,4771 | 0,0783 | ||||
| ESI / Element Solutions Inc | 0,02 | -5,55 | 0,00 | 0,4611 | -0,0814 | ||||
| BMY / Bristol-Myers Squibb Company | 0,01 | 85,56 | 0,00 | 0,4611 | 0,0967 | ||||
| FERG / Ferguson Enterprises Inc. | 0,00 | -34,62 | 0,00 | 0,4537 | -0,1150 | ||||
| VST / Vistra Corp. | 0,00 | -1,95 | 0,00 | 0,4483 | 0,1408 | ||||
| ADP / Automatic Data Processing, Inc. | 0,00 | 0,00 | 0,4398 | 0,4398 | |||||
| WFC / Wells Fargo & Company | 0,01 | -4,32 | 0,00 | 0,4387 | -0,0183 | ||||
| EQT / EQT Corporation | 0,01 | 0,00 | 0,4366 | 0,4366 | |||||
| CDW / CDW Corporation | 0,00 | 77,51 | 0,00 | 0,4323 | 0,1901 | ||||
| FTNT / Fortinet, Inc. | 0,00 | 2,33 | 0,00 | 0,4312 | 0,0039 | ||||
| CMCSA / Comcast Corporation | 0,01 | 56,70 | 0,00 | 0,4270 | 0,1136 | ||||
| AIT / Applied Industrial Technologies, Inc. | 0,00 | -15,99 | 0,00 | 0,4206 | -0,1196 | ||||
| ABNB / Airbnb, Inc. | 0,00 | 0,00 | 0,4174 | 0,4174 | |||||
| MTD / Mettler-Toledo International Inc. | 0,00 | -16,16 | 0,00 | 0,4163 | -0,1393 | ||||
| DHI / D.R. Horton, Inc. | 0,00 | -24,56 | 0,00 | 0,4142 | -0,1877 | ||||
| IP / International Paper Company | 0,01 | -11,81 | 0,00 | 0,4035 | -0,1758 | ||||
| SO / The Southern Company | 0,00 | -26,00 | 0,00 | 0,4024 | -0,2030 | ||||
| AZO / AutoZone, Inc. | 0,00 | 0,00 | 0,3843 | 0,3843 | |||||
| BRK.B / Berkshire Hathaway Inc. | 0,00 | 0,00 | 0,3811 | 0,3811 | |||||
| XOM / Exxon Mobil Corporation | 0,00 | 87,24 | 0,00 | 0,3683 | 0,1273 | ||||
| CI / The Cigna Group | 0,00 | 0,10 | 0,00 | 0,3651 | -0,0386 | ||||
| AVGO / Broadcom Inc. | 0,00 | -13,00 | 0,00 | 0,3587 | 0,0809 | ||||
| INTU / Intuit Inc. | 0,00 | 0,00 | 0,3555 | 0,3555 | |||||
| G / Genpact Limited | 0,01 | -0,11 | 0,00 | 0,3522 | -0,0965 | ||||
| AMP / Ameriprise Financial, Inc. | 0,00 | -0,32 | 0,00 | 0,3501 | -0,0048 | ||||
| AXP / American Express Company | 0,00 | 0,00 | 0,3490 | 0,3490 | |||||
| QCOM / QUALCOMM Incorporated | 0,00 | -0,19 | 0,00 | 0,3490 | -0,0261 | ||||
| APP / AppLovin Corporation | 0,00 | -28,00 | 0,00 | 0,3480 | -0,0592 | ||||
| CL / Colgate-Palmolive Company | 0,00 | 16,70 | 0,00 | 0,3480 | 0,0061 | ||||
| MSCI / MSCI Inc. | 0,00 | -10,67 | 0,00 | 0,3458 | -0,0756 | ||||
| BAC / Bank of America Corporation | 0,01 | 0,00 | 0,3448 | 0,3448 | |||||
| ADBE / Adobe Inc. | 0,00 | 0,00 | 0,3416 | 0,3416 | |||||
| PLTR / Palantir Technologies Inc. | 0,00 | -41,08 | 0,00 | 0,3394 | -0,0582 | ||||
| RCL / Royal Caribbean Cruises Ltd. | 0,00 | -0,10 | 0,00 | 0,3352 | 0,0906 | ||||
| GOOG / Alphabet Inc. | 0,00 | 13,21 | 0,00 | 0,3341 | 0,0444 | ||||
| HBAN / Huntington Bancshares Incorporated | 0,02 | -40,75 | 0,00 | 0,3320 | -0,2260 | ||||
| CAT / Caterpillar Inc. | 0,00 | -26,44 | 0,00 | 0,3288 | -0,0939 | ||||
| BPOP / Popular, Inc. | 0,00 | 3,11 | 0,00 | 0,3277 | 0,0321 | ||||
| NI / NiSource Inc. | 0,01 | -15,10 | 0,00 | 0,3256 | -0,0982 | ||||
| TRGP / Targa Resources Corp. | 0,00 | -52,77 | 0,00 | 0,3224 | -0,5526 | ||||
| COP / ConocoPhillips | 0,00 | 73,21 | 0,00 | 0,3170 | 0,0784 | ||||
| BIL / SPDR Series Trust - SPDR Bloomberg 1-3 Month T-Bill ETF | 0,00 | -29,96 | 0,00 | 0,3138 | -0,1848 | ||||
| DTM / DT Midstream, Inc. | 0,00 | -1,73 | 0,00 | 0,3074 | 0,0023 | ||||
| HPQ / HP Inc. | 0,01 | 0,00 | 0,3021 | 0,3021 | |||||
| CEG / Constellation Energy Corporation | 0,00 | -54,90 | 0,00 | 0,2935 | -0,1588 | ||||
| ORLY / O'Reilly Automotive, Inc. | 0,00 | 0,00 | 0,2861 | 0,2861 | |||||
| IEX / IDEX Corporation | 0,00 | -13,57 | 0,00 | 0,2861 | -0,0938 | ||||
| AMT / American Tower Corporation | 0,00 | -0,66 | 0,00 | 0,2850 | -0,0296 | ||||
| GILD / Gilead Sciences, Inc. | 0,00 | 32,60 | 0,00 | 0,2850 | 0,0440 | ||||
| ABT / Abbott Laboratories | 0,00 | 0,00 | 0,2829 | 0,2829 | |||||
| MMC / Marsh & McLennan Companies, Inc. | 0,00 | -1,46 | 0,00 | 0,2829 | -0,0733 | ||||
| VZ / Verizon Communications Inc. | 0,01 | 0,00 | 0,2797 | 0,2797 | |||||
| OASC / Unified Series Trust - OneAscent Small Cap Core ETF | 0,01 | 0,00 | 0,2786 | 0,2786 | |||||
| EQIX / Equinix, Inc. | 0,00 | 0,00 | 0,2786 | 0,2786 | |||||
| LLY / Eli Lilly and Company | 0,00 | 33,74 | 0,00 | 0,2733 | 0,0323 | ||||
| COST / Costco Wholesale Corporation | 0,00 | 0,00 | 0,2722 | 0,2722 | |||||
| TYL / Tyler Technologies, Inc. | 0,00 | -29,29 | 0,00 | 0,2658 | -0,1438 | ||||
| SPGI / S&P Global Inc. | 0,00 | 0,64 | 0,00 | 0,2658 | -0,0179 | ||||
| CVX / Chevron Corporation | 0,00 | 0,00 | 0,2615 | 0,2615 | |||||
| GM / General Motors Company | 0,00 | 8,93 | 0,00 | 0,2594 | 0,0065 | ||||
| MPC / Marathon Petroleum Corporation | 0,00 | 0,00 | 0,2572 | 0,2572 | |||||
| TEAM / Atlassian Corporation | 0,00 | 0,00 | 0,2551 | 0,2551 | |||||
| ELCV / Strategy Shares - Eventide High Dividend ETF | 0,01 | 0,00 | 0,2498 | 0,2498 | |||||
| CSCO / Cisco Systems, Inc. | 0,00 | 0,00 | 0,2498 | 0,2498 | |||||
| VLO / Valero Energy Corporation | 0,00 | 0,00 | 0,2455 | 0,2455 | |||||
| ABBV / AbbVie Inc. | 0,00 | -23,17 | 0,00 | 0,2402 | -0,1516 | ||||
| CALM / Cal-Maine Foods, Inc. | 0,00 | 0,00 | 0,2380 | 0,2380 | |||||
| KR / The Kroger Co. | 0,00 | -11,82 | 0,00 | 0,2338 | -0,0440 | ||||
| HD / The Home Depot, Inc. | 0,00 | 8,79 | 0,00 | 0,2327 | -0,0047 | ||||
| PLD / Prologis, Inc. | 0,00 | 0,00 | 0,2295 | 0,2295 | |||||
| EOG / EOG Resources, Inc. | 0,00 | 0,00 | 0,2242 | 0,2242 | |||||
| CTAS / Cintas Corporation | 0,00 | -18,57 | 0,00 | 0,2242 | -0,0584 | ||||
| PEP / PepsiCo, Inc. | 0,00 | 0,00 | 0,2199 | 0,2199 | |||||
| MCK / McKesson Corporation | 0,00 | -23,71 | 0,00 | 0,2188 | -0,0744 | ||||
| F / Ford Motor Company | 0,02 | 24,11 | 0,00 | 0,1932 | 0,0329 | ||||
| PSEC / Prospect Capital Corporation | 0,03 | 0,00 | 0,1131 | 0,1131 | |||||
| SKIN / The Beauty Health Company | 0,01 | 18,31 | 0,00 | 0,0246 | 0,0079 | ||||
| PACB / Pacific Biosciences of California, Inc. | 0,01 | 5,59 | 0,00 | 0,0160 | -0,0006 | ||||
| TSLA / Tesla, Inc. | 0,00 | -100,00 | 0,00 | 0,0000 | -0,3929 | ||||
| ENTG / Entegris, Inc. | 0,00 | -100,00 | 0,00 | 0,0000 | |||||
| POOL / Pool Corporation | 0,00 | -100,00 | 0,00 | 0,0000 | |||||
| EQR / Equity Residential | 0,00 | -100,00 | 0,00 | 0,0000 | |||||
| PEG / Public Service Enterprise Group Incorporated | 0,00 | -100,00 | 0,00 | 0,0000 | |||||
| LUMN / Lumen Technologies, Inc. | 0,00 | -100,00 | 0,00 | 0,0000 | |||||
| GRMN / Garmin Ltd. | 0,00 | -100,00 | 0,00 | 0,0000 | |||||
| DELL / Dell Technologies Inc. | 0,00 | -100,00 | 0,00 | 0,0000 |