Statistiques de base
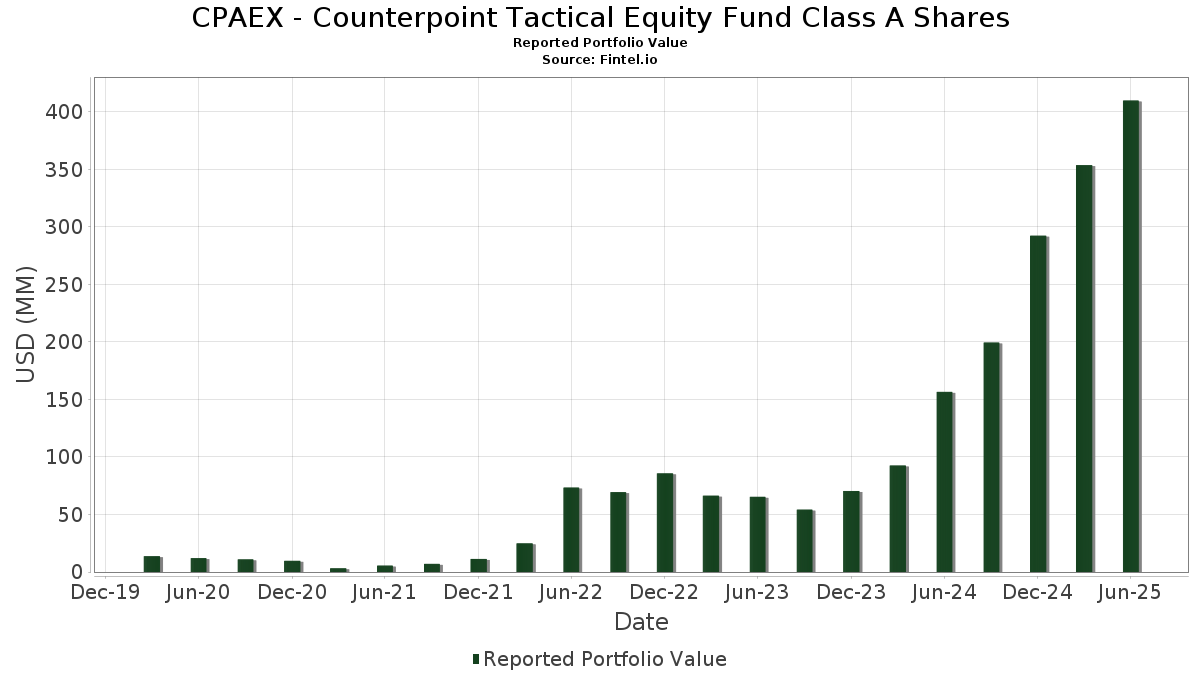
| Valeur du portefeuille | $ 409 682 444 |
| Positions actuelles | 299 |
Dernières positions, performances, ASG (à partir des dépôts 13F, 13D)
CPAEX - Counterpoint Tactical Equity Fund Class A Shares a déclaré un total de 299 positions dans ses derniers dépôts auprès de la SEC. La valeur la plus récente du portefeuille est calculée à 409 682 444 USD. Les actifs sous gestion réels (ASG) sont cette valeur plus les liquidités (qui ne sont pas divulguées). Les principales positions de CPAEX - Counterpoint Tactical Equity Fund Class A Shares sont Fidelity Treasury Portfolio (US:US3161755042) , iShares Trust - iShares Core S&P 500 ETF (US:IVV) , Northern Lights Fund Trust III - Counterpoint Quantitative Equity ETF (US:CPAI) , 10x Genomics, Inc. (US:TXG) , and Owens & Minor, Inc. (US:OMI) . Les nouvelles positions de CPAEX - Counterpoint Tactical Equity Fund Class A Shares incluent Fidelity Treasury Portfolio (US:US3161755042) , Elbit Systems Ltd. (US:ESLT) , Oddity Tech Ltd. (US:ODD) , HNI Corporation (US:HNI) , and Hallador Energy Company (US:HNRG) .
Meilleures augmentations ce trimestre
Nous utilisons la variation de l'allocation du portefeuille car il s'agit de l'indicateur le plus significatif. Les changements peuvent être dus à des transactions ou à des variations de prix des actions.
| Titre | Actions (en millions) |
Valeur ($ en millions) |
% du portefeuille | ΔPortefeuille % |
|---|---|---|---|---|
| 49,07 | 11,2256 | 11,2256 | ||
| 69,15 | 15,8190 | 7,5048 | ||
| 0,63 | 7,12 | 1,6282 | 1,6282 | |
| 0,87 | 6,28 | 1,4358 | 1,4358 | |
| 4,73 | 1,0825 | 1,0825 | ||
| 0,95 | 3,60 | 0,8226 | 0,8226 | |
| 0,10 | 2,57 | 0,5876 | 0,5876 | |
| 0,10 | 0,90 | 0,2060 | 0,2060 | |
| 0,02 | 0,81 | 0,1854 | 0,1854 | |
| 0,00 | 0,80 | 0,1826 | 0,1826 |
Principales baisses ce trimestre
Nous utilisons la variation de l'allocation du portefeuille car il s'agit de l'indicateur le plus significatif. Les changements peuvent être dus à des transactions ou à des variations de prix des actions.
| Titre | Actions (en millions) |
Valeur ($ en millions) |
% du portefeuille | ΔPortefeuille % |
|---|---|---|---|---|
| 0,08 | 52,37 | 11,9800 | -16,0392 | |
| 49,50 | 11,3237 | -2,0493 | ||
| 0,78 | -6,42 | -1,4687 | -1,4687 | |
| 0,60 | -4,92 | -1,1252 | -1,1252 | |
| 0,36 | -3,02 | -0,6907 | -0,6907 | |
| 1,24 | 46,07 | 10,5393 | -0,6077 | |
| 9,94 | 2,2738 | -0,4114 | ||
| 0,39 | -1,47 | -0,3352 | -0,3352 | |
| 0,00 | 0,41 | 0,0931 | -0,2464 | |
| 0,00 | 0,00 | -0,2310 |
Déclarations 13F et dépôts de fonds
Ce formulaire a été déposé le 2025-08-28 pour la période de déclaration 2025-06-30. Cliquez sur l'icône du lien pour voir l'historique complet des transactions.
Mettre à niveau pour débloquer les données premium et exporter vers Excel ![]() .
.
| Titre | Type | Prix moyen de l'action | Actions (en millions) |
ΔActions (%) |
ΔActions (%) |
Valeur ($ en millions) |
Portefeuille (%) |
ΔPortefeuille (%) |
|
|---|---|---|---|---|---|---|---|---|---|
| US3161755042 / Fidelity Treasury Portfolio | 69,15 | 127,01 | 15,8190 | 7,5048 | |||||
| IVV / iShares Trust - iShares Core S&P 500 ETF | 0,08 | -40,54 | 52,37 | -37,29 | 11,9800 | -16,0392 | |||
| B 09/25/25 / DBT (US912797PY71) | 49,50 | 1,02 | 11,3237 | -2,0493 | |||||
| B 12/11/25 / DBT (US912797QY62) | 49,07 | 11,2256 | 11,2256 | ||||||
| CPAI / Northern Lights Fund Trust III - Counterpoint Quantitative Equity ETF | 1,24 | 1,61 | 46,07 | 12,80 | 10,5393 | -0,6077 | |||
| B 08/21/25 / DBT (US912797PP64) | 9,94 | 1,04 | 2,2738 | -0,4114 | |||||
| JPCPILS1 INDEX / DO (N/A) | 0,63 | 7,12 | 1,6282 | 1,6282 | |||||
| JPCPILS3 INDEX / DO (N/A) | 0,87 | 6,28 | 1,4358 | 1,4358 | |||||
| S&P500 EMINI FUT Sep25 / DE (N/A) | 4,73 | 1,0825 | 1,0825 | ||||||
| JPCPILS2 INDEX / DO (N/A) | 0,95 | 3,60 | 0,8226 | 0,8226 | |||||
| SPDR SP 500 ETF LONG / DO (N/A) | 0,10 | 2,57 | 0,5876 | 0,5876 | |||||
| TXG / 10x Genomics, Inc. | 0,08 | -0,35 | 0,91 | 32,26 | 0,2073 | 0,0202 | |||
| OMI / Owens & Minor, Inc. | 0,10 | 0,90 | 0,2060 | 0,2060 | |||||
| TTMI / TTM Technologies, Inc. | 0,02 | -39,27 | 0,88 | 20,88 | 0,2014 | 0,0026 | |||
| PGY / Pagaya Technologies Ltd. | 0,04 | -37,82 | 0,86 | 26,59 | 0,1961 | 0,0111 | |||
| ADNT / Adient plc | 0,04 | -24,13 | 0,84 | 14,91 | 0,1922 | -0,0075 | |||
| DRS / Leonardo DRS, Inc. | 0,02 | 0,81 | 0,1854 | 0,1854 | |||||
| DV / DoubleVerify Holdings, Inc. | 0,05 | -5,47 | 0,80 | 5,82 | 0,1831 | -0,0233 | |||
| ESLT / Elbit Systems Ltd. | 0,00 | 0,80 | 0,1826 | 0,1826 | |||||
| BGC / BGC Group, Inc. | 0,08 | 0,79 | 0,1798 | 0,1798 | |||||
| CW / Curtiss-Wright Corporation | 0,00 | 39,15 | 0,78 | 114,52 | 0,1792 | 0,0794 | |||
| EXTR / Extreme Networks, Inc. | 0,04 | 134,18 | 0,78 | 180,29 | 0,1791 | 0,0351 | |||
| GNW / Genworth Financial, Inc. | 0,10 | 175,60 | 0,78 | 212,85 | 0,1784 | 0,0503 | |||
| EAT / Brinker International, Inc. | 0,00 | -20,44 | 0,78 | -3,73 | 0,1775 | -0,0425 | |||
| XRX / Xerox Holdings Corporation | 0,15 | -0,50 | 0,77 | 8,56 | 0,1773 | -0,0176 | |||
| NRG / NRG Energy, Inc. | 0,00 | -37,62 | 0,77 | 5,02 | 0,1771 | -0,0243 | |||
| CMP / Compass Minerals International, Inc. | 0,04 | -41,98 | 0,77 | 3,49 | 0,1764 | -0,0733 | |||
| FTI / TechnipFMC plc | 0,02 | 58,70 | 0,77 | 72,65 | 0,1764 | 0,0544 | |||
| MNDY / monday.com Ltd. | 0,00 | 60,41 | 0,77 | 107,57 | 0,1758 | 0,0747 | |||
| AVPT / AvePoint, Inc. | 0,04 | 45,39 | 0,77 | 94,67 | 0,1757 | 0,0679 | |||
| STRL / Sterling Infrastructure, Inc. | 0,00 | 0,77 | 0,1756 | 0,1756 | |||||
| ODD / Oddity Tech Ltd. | 0,01 | 0,77 | 0,1755 | 0,1755 | |||||
| CRK / Comstock Resources, Inc. | 0,03 | 33,94 | 0,77 | 82,38 | 0,1753 | 0,0605 | |||
| VST / Vistra Corp. | 0,00 | -33,57 | 0,76 | 9,65 | 0,1742 | -0,0154 | |||
| APG / APi Group Corporation | 0,01 | 161,12 | 0,76 | 304,26 | 0,1739 | 0,0771 | |||
| TILE / Interface, Inc. | 0,04 | 162,25 | 0,76 | 189,27 | 0,1728 | 0,0385 | |||
| MD / Pediatrix Medical Group, Inc. | 0,05 | 81,29 | 0,75 | 79,52 | 0,1726 | 0,0579 | |||
| CPRI / Capri Holdings Limited | 0,04 | 18,32 | 0,75 | 6,20 | 0,1726 | -0,0214 | |||
| MTZ / MasTec, Inc. | 0,00 | 596,68 | 0,75 | 2 582,14 | 0,1719 | -0,0392 | |||
| SKYW / SkyWest, Inc. | 0,01 | 3,68 | 0,75 | 6,68 | 0,1719 | -0,0646 | |||
| HNI / HNI Corporation | 0,02 | 0,75 | 0,1719 | 0,1719 | |||||
| WKC / World Kinect Corporation | 0,03 | 413,13 | 0,75 | 606,60 | 0,1716 | 0,0315 | |||
| GSL / Global Ship Lease, Inc. | 0,03 | -13,78 | 0,75 | -0,79 | 0,1715 | -0,0346 | |||
| MCY / Mercury General Corporation | 0,01 | 176,39 | 0,75 | 196,43 | 0,1710 | 0,0409 | |||
| AROC / Archrock, Inc. | 0,03 | 0,25 | 0,75 | -5,10 | 0,1706 | -0,0440 | |||
| TOST / Toast, Inc. | 0,02 | -22,60 | 0,74 | 3,33 | 0,1704 | -0,0263 | |||
| AER / AerCap Holdings N.V. | 0,01 | 101,91 | 0,74 | 146,67 | 0,1695 | 0,0688 | |||
| CNO / CNO Financial Group, Inc. | 0,02 | 91,45 | 0,74 | 77,46 | 0,1694 | 0,0554 | |||
| GPOR / Gulfport Energy Corporation | 0,00 | 74,23 | 0,74 | 90,44 | 0,1686 | 0,0629 | |||
| XIFR / XPLR Infrastructure, LP - Limited Partnership | 0,09 | 2,19 | 0,74 | -11,86 | 0,1685 | -0,0594 | |||
| HNRG / Hallador Energy Company | 0,05 | 0,74 | 0,1684 | 0,1684 | |||||
| PAAS / Pan American Silver Corp. | 0,03 | 0,74 | 0,1684 | 0,1684 | |||||
| ACHC / Acadia Healthcare Company, Inc. | 0,03 | 20,88 | 0,74 | -9,59 | 0,1683 | -0,0537 | |||
| EQH / Equitable Holdings, Inc. | 0,01 | -11,84 | 0,74 | 4,85 | 0,1683 | -0,0671 | |||
| NTNX / Nutanix, Inc. | 0,01 | -11,15 | 0,73 | -2,78 | 0,1681 | -0,0380 | |||
| VCTR / Victory Capital Holdings, Inc. | 0,01 | 69,89 | 0,73 | 86,99 | 0,1679 | 0,0607 | |||
| KVYO / Klaviyo, Inc. | 0,02 | 75,02 | 0,73 | 94,15 | 0,1671 | 0,0645 | |||
| WSM / Williams-Sonoma, Inc. | 0,00 | 193,82 | 0,73 | 159,79 | 0,1671 | 0,0726 | |||
| AMN / AMN Healthcare Services, Inc. | 0,04 | 8,82 | 0,73 | -8,06 | 0,1671 | -0,0497 | |||
| CVLT / Commvault Systems, Inc. | 0,00 | 0,73 | 0,1668 | 0,1668 | |||||
| JXN / Jackson Financial Inc. | 0,01 | -13,04 | 0,73 | -7,85 | 0,1667 | -0,0491 | |||
| JAMF / Jamf Holding Corp. | 0,08 | 0,73 | 0,1665 | 0,1665 | |||||
| RRC / Range Resources Corporation | 0,02 | 0,73 | 0,1664 | 0,1664 | |||||
| COTY / Coty Inc. | 0,16 | 139,12 | 0,72 | 103,37 | 0,1658 | 0,0685 | |||
| AR / Antero Resources Corporation | 0,02 | -9,32 | 0,72 | -9,62 | 0,1655 | -0,0531 | |||
| EVER / EverQuote, Inc. | 0,03 | 5,72 | 0,71 | -2,46 | 0,1635 | -0,0364 | |||
| RPD / Rapid7, Inc. | 0,03 | 1 525,83 | 0,71 | 729,07 | 0,1632 | 0,0359 | |||
| DAN / Dana Incorporated | 0,04 | -22,51 | 0,71 | -0,42 | 0,1629 | -0,0320 | |||
| VSTS / Vestis Corporation | 0,12 | 2 025,01 | 0,71 | 476,42 | 0,1624 | -0,0174 | |||
| MET / MetLife, Inc. | 0,01 | 113,83 | 0,71 | 114,55 | 0,1621 | 0,0718 | |||
| RL / Ralph Lauren Corporation | 0,00 | 107,28 | 0,70 | 538,18 | 0,1608 | 0,0161 | |||
| PAY / Paymentus Holdings, Inc. | 0,02 | 35,15 | 0,68 | 69,83 | 0,1558 | 0,0462 | |||
| UNFI / United Natural Foods, Inc. | 0,03 | -3,11 | 0,67 | -17,55 | 0,1527 | -0,0682 | |||
| WOOF / Petco Health and Wellness Company, Inc. | 0,23 | 0,66 | 0,1521 | 0,1521 | |||||
| S&P Emini 2nd Wee Jul25C / DE (N/A) | 0,63 | 0,1451 | 0,1451 | ||||||
| S&P Emini 2nd Wee Jul25C / DE (N/A) | 0,63 | 0,1451 | 0,1451 | ||||||
| EVH / Evolent Health, Inc. | 0,05 | -44,12 | 0,52 | -33,59 | 0,1195 | -0,0951 | |||
| FLNC / Fluence Energy, Inc. | 0,07 | -52,83 | 0,48 | -34,79 | 0,1091 | -0,0904 | |||
| HRTG / Heritage Insurance Holdings, Inc. | 0,02 | 1 133,79 | 0,45 | 3 128,57 | 0,1035 | -0,0343 | |||
| COMM / CommScope Holding Company, Inc. | 0,05 | -26,07 | 0,45 | 15,46 | 0,1025 | -0,0036 | |||
| SGHC / Super Group (SGHC) Limited | 0,04 | -33,20 | 0,44 | 13,77 | 0,1004 | -0,0049 | |||
| AMSC / American Superconductor Corporation | 0,01 | 0,44 | 0,0997 | 0,0997 | |||||
| STX / Seagate Technology Holdings plc | 0,00 | -30,77 | 0,43 | 15,78 | 0,0992 | -0,0265 | |||
| REVG / REV Group, Inc. | 0,01 | 0,43 | 0,0984 | 0,0984 | |||||
| JCP1MILS INDEX / DO (N/A) | 0,30 | 0,43 | 0,0984 | 0,0984 | |||||
| JCP1MILS INDEX / DO (N/A) | 0,30 | 0,43 | 0,0984 | 0,0984 | |||||
| JCP1MILS INDEX / DO (N/A) | 0,30 | 0,43 | 0,0984 | 0,0984 | |||||
| URBN / Urban Outfitters, Inc. | 0,01 | 0,43 | 0,0977 | 0,0977 | |||||
| GTX / Garrett Motion Inc. | 0,04 | 135,83 | 0,43 | 340,21 | 0,0977 | -0,0311 | |||
| MODG / Topgolf Callaway Brands Corp. | 0,05 | -56,15 | 0,43 | -46,42 | 0,0975 | -0,1196 | |||
| PEGA / Pegasystems Inc. | 0,01 | 114,46 | 0,42 | 91,86 | 0,0972 | -0,0495 | |||
| HWM / Howmet Aerospace Inc. | 0,00 | -23,97 | 0,42 | 29,36 | 0,0968 | -0,0129 | |||
| NFE / New Fortress Energy Inc. | 0,13 | 5 170,35 | 0,42 | 302,86 | 0,0968 | -0,0430 | |||
| FIX / Comfort Systems USA, Inc. | 0,00 | 18,32 | 0,42 | 49,65 | 0,0967 | 0,0019 | |||
| OUST / Ouster, Inc. | 0,02 | 0,42 | 0,0965 | 0,0965 | |||||
| CAKE / The Cheesecake Factory Incorporated | 0,01 | 46,94 | 0,42 | 247,93 | 0,0965 | -0,0614 | |||
| AGX / Argan, Inc. | 0,00 | -37,86 | 0,42 | 247,93 | 0,0964 | -0,0629 | |||
| LNC / Lincoln National Corporation | 0,01 | 6,09 | 0,42 | 2,44 | 0,0961 | -0,0161 | |||
| OSPN / OneSpan Inc. | 0,03 | 1 880,38 | 0,42 | 1 721,74 | 0,0960 | -0,0503 | |||
| WLDN / Willdan Group, Inc. | 0,01 | -32,36 | 0,42 | 3,97 | 0,0959 | -0,0143 | |||
| SSRM / SSR Mining Inc. | 0,03 | -73,59 | 0,42 | -51,62 | 0,0959 | -0,1950 | |||
| HSII / Heidrick & Struggles International, Inc. | 0,01 | 101,56 | 0,42 | 249,17 | 0,0959 | -0,0622 | |||
| RSI / Rush Street Interactive, Inc. | 0,03 | -24,34 | 0,42 | 5,29 | 0,0957 | -0,0129 | |||
| CSV / Carriage Services, Inc. | 0,01 | 46,76 | 0,42 | 69,92 | 0,0956 | -0,2266 | |||
| SEI / Solaris Energy Infrastructure, Inc. | 0,01 | -38,07 | 0,42 | -39,21 | 0,0955 | -0,1346 | |||
| VIRT / Virtu Financial, Inc. | 0,01 | 10,94 | 0,42 | 63,53 | 0,0955 | -0,0361 | |||
| CFG / Citizens Financial Group, Inc. | 0,01 | 8,06 | 0,42 | 18,13 | 0,0955 | -0,0010 | |||
| LPLA / LPL Financial Holdings Inc. | 0,00 | 119,13 | 0,42 | 307,84 | 0,0953 | -0,0456 | |||
| ZIM / ZIM Integrated Shipping Services Ltd. | 0,03 | -45,56 | 0,42 | -40,03 | 0,0952 | -0,0939 | |||
| CASH / Pathward Financial, Inc. | 0,01 | 184,66 | 0,42 | 327,84 | 0,0951 | -0,0474 | |||
| LTH / Life Time Group Holdings, Inc. | 0,01 | -28,40 | 0,42 | -11,13 | 0,0950 | -0,1452 | |||
| CXW / CoreCivic, Inc. | 0,02 | -5,39 | 0,42 | -1,66 | 0,0950 | -0,0204 | |||
| IART / Integra LifeSciences Holdings Corporation | 0,03 | 0,41 | 0,0949 | 0,0949 | |||||
| ODP / The ODP Corporation | 0,02 | 35,78 | 0,41 | 8,38 | 0,0948 | -0,0337 | |||
| LZ / LegalZoom.com, Inc. | 0,05 | 7,61 | 0,41 | 50,73 | 0,0947 | -0,0463 | |||
| MTSI / MACOM Technology Solutions Holdings, Inc. | 0,00 | -22,88 | 0,41 | 10,13 | 0,0947 | -0,0079 | |||
| PBI / Pitney Bowes Inc. | 0,04 | -13,51 | 0,41 | 4,29 | 0,0947 | -0,0137 | |||
| GDOT / Green Dot Corporation | 0,04 | 73,07 | 0,41 | 59,46 | 0,0946 | -0,0389 | |||
| MLI / Mueller Industries, Inc. | 0,01 | -1,72 | 0,41 | 2,74 | 0,0946 | -0,0154 | |||
| LITE / Lumentum Holdings Inc. | 0,00 | -61,35 | 0,41 | -41,14 | 0,0944 | -0,0967 | |||
| GEO / The GEO Group, Inc. | 0,02 | 6,56 | 0,41 | -8,65 | 0,0943 | -0,0573 | |||
| TPB / Turning Point Brands, Inc. | 0,01 | -23,36 | 0,41 | -3,52 | 0,0942 | -0,0488 | |||
| AXS / AXIS Capital Holdings Limited | 0,00 | 75,50 | 0,41 | 239,67 | 0,0941 | -0,0656 | |||
| AMP / Ameriprise Financial, Inc. | 0,00 | 100,52 | 0,41 | 222,83 | 0,0940 | -0,0736 | |||
| UNM / Unum Group | 0,01 | 0,41 | 0,0939 | 0,0939 | |||||
| JCI / Johnson Controls International plc | 0,00 | 0,41 | 0,0938 | 0,0938 | |||||
| HCI / HCI Group, Inc. | 0,00 | -11,89 | 0,41 | -10,11 | 0,0937 | -0,0307 | |||
| FAF / First American Financial Corporation | 0,01 | 2 072,31 | 0,41 | 1 945,00 | 0,0937 | -0,0742 | |||
| GL / Globe Life Inc. | 0,00 | 184,86 | 0,41 | 224,60 | 0,0936 | -0,0729 | |||
| LINC / Lincoln Educational Services Corporation | 0,02 | 0,41 | 0,0936 | 0,0936 | |||||
| R / Ryder System, Inc. | 0,00 | 39,01 | 0,41 | 41,03 | 0,0936 | -0,0038 | |||
| EE / Excelerate Energy, Inc. | 0,01 | -47,71 | 0,41 | -46,60 | 0,0935 | -0,1152 | |||
| ESE / ESCO Technologies Inc. | 0,00 | 0,41 | 0,0935 | 0,0935 | |||||
| TPR / Tapestry, Inc. | 0,00 | -36,22 | 0,41 | -14,29 | 0,0935 | -0,0664 | |||
| TRGP / Targa Resources Corp. | 0,00 | 13,60 | 0,41 | -1,45 | 0,0935 | -0,0196 | |||
| APH / Amphenol Corporation | 0,00 | 0,41 | 0,0934 | 0,0934 | |||||
| HWKN / Hawkins, Inc. | 0,00 | 0,41 | 0,0934 | 0,0934 | |||||
| YEXT / Yext, Inc. | 0,05 | 129,19 | 0,41 | 209,09 | 0,0934 | -0,1010 | |||
| VTOL / Bristow Group Inc. | 0,01 | 6,31 | 0,41 | 2,01 | 0,0933 | -0,0406 | |||
| ICL / ICL Group Ltd | 0,06 | 2 974,52 | 0,41 | 3 030,77 | 0,0932 | -0,1375 | |||
| SPT / Sprout Social, Inc. | 0,02 | 0,41 | 0,0931 | 0,0931 | |||||
| ECL / Ecolab Inc. | 0,00 | 9,10 | 0,41 | 57,36 | 0,0931 | -0,2464 | |||
| LIN / Linde plc | 0,00 | 0,41 | 0,0931 | 0,0931 | |||||
| RBLX / Roblox Corporation | 0,00 | -70,66 | 0,41 | -46,72 | 0,0930 | -0,1628 | |||
| PRIM / Primoris Services Corporation | 0,01 | -18,80 | 0,41 | 10,33 | 0,0930 | -0,0077 | |||
| JBL / Jabil Inc. | 0,00 | 10,04 | 0,41 | 120,65 | 0,0930 | -0,0290 | |||
| CRDO / Credo Technology Group Holding Ltd | 0,00 | -74,23 | 0,41 | -40,64 | 0,0930 | -0,0937 | |||
| ITT / ITT Inc. | 0,00 | 345,19 | 0,41 | 1 461,54 | 0,0930 | -0,0747 | |||
| BHF / Brighthouse Financial, Inc. | 0,01 | 175,70 | 0,41 | 214,73 | 0,0930 | -0,0776 | |||
| UDMY / Udemy, Inc. | 0,06 | 758,02 | 0,41 | 310,10 | 0,0929 | -0,0518 | |||
| ATRO / Astronics Corporation | 0,01 | 0,41 | 0,0928 | 0,0928 | |||||
| MGPI / MGP Ingredients, Inc. | 0,01 | -6,40 | 0,41 | -4,48 | 0,0927 | -0,0231 | |||
| AGO / Assured Guaranty Ltd. | 0,00 | -3,96 | 0,41 | -4,93 | 0,0927 | -0,0238 | |||
| WWD / Woodward, Inc. | 0,00 | 0,40 | 0,0926 | 0,0926 | |||||
| ARLO / Arlo Technologies, Inc. | 0,02 | 21,30 | 0,40 | 69,75 | 0,0925 | -0,0299 | |||
| GFF / Griffon Corporation | 0,01 | -47,75 | 0,40 | -47,12 | 0,0924 | -0,1161 | |||
| FTDR / Frontdoor, Inc. | 0,01 | -10,40 | 0,40 | -3,35 | 0,0924 | -0,0479 | |||
| ACT / Enact Holdings, Inc. | 0,01 | -51,67 | 0,40 | -48,33 | 0,0923 | -0,1208 | |||
| ACEL / Accel Entertainment, Inc. | 0,03 | 1,00 | 0,40 | 19,94 | 0,0922 | 0,0004 | |||
| EYE / National Vision Holdings, Inc. | 0,02 | 0,40 | 0,0921 | 0,0921 | |||||
| BYD / Boyd Gaming Corporation | 0,01 | 12,05 | 0,40 | 76,32 | 0,0920 | -0,2059 | |||
| XRAY / DENTSPLY SIRONA Inc. | 0,03 | 17,35 | 0,40 | 24,53 | 0,0919 | 0,0040 | |||
| INTA / Intapp, Inc. | 0,01 | 15,17 | 0,40 | 1,78 | 0,0919 | -0,0158 | |||
| WEAV / Weave Communications, Inc. | 0,05 | 0,40 | 0,0919 | 0,0919 | |||||
| SLAB / Silicon Laboratories Inc. | 0,00 | 0,40 | 0,0918 | 0,0918 | |||||
| AIZ / Assurant, Inc. | 0,00 | 115,88 | 0,40 | 241,03 | 0,0915 | -0,0635 | |||
| DAC / Danaos Corporation | 0,00 | 0,40 | 0,0915 | 0,0915 | |||||
| VMEO / Vimeo, Inc. | 0,10 | -9,42 | 0,40 | -42,75 | 0,0913 | -0,1429 | |||
| CF / CF Industries Holdings, Inc. | 0,00 | 0,40 | 0,0912 | 0,0912 | |||||
| SKWD / Skyward Specialty Insurance Group, Inc. | 0,01 | 0,40 | 0,0912 | 0,0912 | |||||
| REAL / The RealReal, Inc. | 0,08 | -35,64 | 0,40 | -42,82 | 0,0911 | -0,0989 | |||
| DUOL / Duolingo, Inc. | 0,00 | -56,85 | 0,40 | -45,47 | 0,0910 | -0,1536 | |||
| ARIS / Aris Water Solutions, Inc. | 0,02 | -32,73 | 0,40 | -50,31 | 0,0909 | -0,1275 | |||
| NEOG / Neogen Corporation | 0,08 | 0,40 | 0,0907 | 0,0907 | |||||
| PLMR / Palomar Holdings, Inc. | 0,00 | -20,19 | 0,40 | -10,23 | 0,0905 | -0,0297 | |||
| NMM / Navios Maritime Partners L.P. - Limited Partnership | 0,01 | 99,10 | 0,39 | 19,82 | 0,0901 | -0,0790 | |||
| BBW / Build-A-Bear Workshop, Inc. | 0,01 | 0,39 | 0,0900 | 0,0900 | |||||
| IHS / IHS Holding Limited | 0,07 | 0,39 | 0,0898 | 0,0898 | |||||
| AFRM / Affirm Holdings, Inc. | 0,01 | -27,46 | 0,39 | -17,65 | 0,0898 | -0,0701 | |||
| PUMP / ProPetro Holding Corp. | 0,07 | 0,39 | 0,0897 | 0,0897 | |||||
| TPC / Tutor Perini Corporation | 0,01 | -50,52 | 0,39 | -0,26 | 0,0890 | -0,0173 | |||
| RMBS / Rambus Inc. | 0,01 | -5,67 | 0,39 | 42,96 | 0,0885 | -0,0506 | |||
| ATEN / A10 Networks, Inc. | 0,02 | -55,00 | 0,38 | -46,74 | 0,0880 | -0,1090 | |||
| TEN / Tsakos Energy Navigation Limited | 0,02 | 159,98 | 0,38 | 70,67 | 0,0880 | -0,0615 | |||
| DBD / Diebold Nixdorf, Incorporated | 0,01 | -80,12 | 0,38 | 354,76 | 0,0876 | -0,0246 | |||
| VET / Vermilion Energy Inc. | 0,05 | 13,82 | 0,38 | 2,41 | 0,0875 | -0,0146 | |||
| GDRX / GoodRx Holdings, Inc. | 0,08 | 1,28 | 0,38 | 14,37 | 0,0874 | -0,0038 | |||
| CSIQ / Canadian Solar Inc. | 0,03 | 782,96 | 0,38 | 297,92 | 0,0874 | -0,0540 | |||
| VTLE / Vital Energy, Inc. | 0,02 | 40,80 | 0,38 | 6,76 | 0,0868 | -0,0102 | |||
| TDOC / Teladoc Health, Inc. | 0,04 | -51,44 | 0,37 | -46,94 | 0,0855 | -0,1064 | |||
| MLKN / MillerKnoll, Inc. | 0,02 | 116,35 | 0,37 | 70,05 | 0,0846 | -0,0275 | |||
| KLAC / KLA Corporation | 0,00 | -37,63 | 0,37 | -11,33 | 0,0842 | -0,0551 | |||
| GRPN / Groupon, Inc. | 0,01 | -53,14 | 0,37 | -16,44 | 0,0838 | -0,0359 | |||
| HELE / Helen of Troy Limited | 0,01 | 93,66 | 0,36 | 2,84 | 0,0829 | -0,0134 | |||
| SAH / Sonic Automotive, Inc. | 0,00 | -65,74 | 0,36 | -51,94 | 0,0823 | -0,1219 | |||
| VNT / Vontier Corporation | 0,01 | 7,89 | 0,36 | 9,15 | 0,0821 | -0,0282 | |||
| FLYW / Flywire Corporation | 0,03 | -61,17 | 0,36 | -52,21 | 0,0815 | -0,1219 | |||
| COHU / Cohu, Inc. | 0,02 | 508,68 | 0,36 | 182,54 | 0,0814 | -0,0846 | |||
| AXP / American Express Company | 0,00 | 51,77 | 0,36 | 179,53 | 0,0813 | -0,0867 | |||
| CARG / CarGurus, Inc. | 0,01 | -21,27 | 0,35 | -9,46 | 0,0811 | -0,0259 | |||
| CDE / Coeur Mining, Inc. | 0,04 | 0,35 | 0,0810 | 0,0810 | |||||
| TROX / Tronox Holdings plc | 0,07 | 232,82 | 0,35 | 7,29 | 0,0810 | -0,1369 | |||
| FELE / Franklin Electric Co., Inc. | 0,00 | 3,33 | 0,35 | -1,12 | 0,0808 | -0,0168 | |||
| NUE / Nucor Corporation | 0,00 | 4,51 | 0,35 | 12,50 | 0,0804 | -0,0049 | |||
| FICO / Fair Isaac Corporation | 0,00 | 35,21 | 0,35 | 253,54 | 0,0803 | -0,0568 | |||
| OI / O-I Glass, Inc. | 0,02 | 0,35 | 0,0802 | 0,0802 | |||||
| CGAU / Centerra Gold Inc. | 0,05 | 0,35 | 0,0802 | 0,0802 | |||||
| EGO / Eldorado Gold Corporation | 0,02 | 15,31 | 0,35 | 58,64 | 0,0799 | -0,0659 | |||
| FLEX / Flex Ltd. | 0,01 | -56,80 | 0,35 | -35,49 | 0,0799 | -0,1985 | |||
| ADTN / ADTRAN Holdings, Inc. | 0,04 | -55,15 | 0,35 | -53,91 | 0,0797 | -0,1264 | |||
| EXPI / eXp World Holdings, Inc. | 0,04 | 387,80 | 0,35 | 174,02 | 0,0797 | -0,1070 | |||
| ARLP / Alliance Resource Partners, L.P. - Limited Partnership | 0,01 | 15,02 | 0,35 | 20,21 | 0,0791 | -0,0688 | |||
| ABCB / Ameris Bancorp | 0,01 | 0,35 | 0,0790 | 0,0790 | |||||
| CVNA / Carvana Co. | 0,00 | -47,81 | 0,34 | -15,89 | 0,0789 | -0,0330 | |||
| NDAQ / Nasdaq, Inc. | 0,00 | 43,81 | 0,34 | 165,89 | 0,0787 | -0,1118 | |||
| AZTA / Azenta, Inc. | 0,01 | 0,34 | 0,0784 | 0,0784 | |||||
| EXPE / Expedia Group, Inc. | 0,00 | -15,32 | 0,34 | -14,93 | 0,0783 | -0,0316 | |||
| AMBP / Ardagh Metal Packaging S.A. | 0,08 | -15,92 | 0,34 | 19,23 | 0,0782 | -0,0177 | |||
| DAR / Darling Ingredients Inc. | 0,01 | 975,66 | 0,34 | 407,46 | 0,0779 | -0,1376 | |||
| SXC / SunCoke Energy, Inc. | 0,04 | 0,65 | 0,34 | -6,09 | 0,0776 | -0,0209 | |||
| WIX / Wix.com Ltd. | 0,00 | 59,46 | 0,34 | 18,12 | 0,0776 | -0,0190 | |||
| CNX / CNX Resources Corporation | 0,01 | -48,75 | 0,34 | -53,06 | 0,0775 | -0,1641 | |||
| STLD / Steel Dynamics, Inc. | 0,00 | -58,57 | 0,34 | -57,64 | 0,0775 | -0,1405 | |||
| ATI / ATI Inc. | 0,00 | 0,34 | 0,0773 | 0,0773 | |||||
| TWLO / Twilio Inc. | 0,00 | -62,37 | 0,34 | -56,74 | 0,0772 | -0,1843 | |||
| SCS / Steelcase Inc. | 0,03 | -55,24 | 0,34 | -57,49 | 0,0768 | -0,1383 | |||
| QCOM / QUALCOMM Incorporated | 0,00 | -19,19 | 0,34 | -16,25 | 0,0767 | -0,0576 | |||
| LNW / Light & Wonder, Inc. | 0,00 | 5,29 | 0,33 | 17,25 | 0,0763 | -0,0015 | |||
| LUMN / Lumen Technologies, Inc. | 0,08 | 0,33 | 0,0762 | 0,0762 | |||||
| DNUT / Krispy Kreme, Inc. | 0,11 | 0,33 | 0,0762 | 0,0762 | |||||
| LECO / Lincoln Electric Holdings, Inc. | 0,00 | -17,72 | 0,33 | -9,84 | 0,0756 | -0,0244 | |||
| EXE / Expand Energy Corporation | 0,00 | 0,33 | 0,0752 | 0,0752 | |||||
| WST / West Pharmaceutical Services, Inc. | 0,00 | 0,33 | 0,0751 | 0,0751 | |||||
| AN / AutoNation, Inc. | 0,00 | 181,23 | 0,33 | 1 386,36 | 0,0749 | -0,0888 | |||
| IQV / IQVIA Holdings Inc. | 0,00 | 11,52 | 0,33 | -0,31 | 0,0747 | -0,0147 | |||
| EPAC / Enerpac Tool Group Corp. | 0,01 | -56,65 | 0,33 | -60,89 | 0,0745 | -0,1523 | |||
| EQT / EQT Corporation | 0,01 | -13,59 | 0,33 | 9,06 | 0,0745 | -0,0255 | |||
| ALGN / Align Technology, Inc. | 0,00 | -15,59 | 0,33 | 0,62 | 0,0744 | -0,0138 | |||
| SNV / Synovus Financial Corp. | 0,01 | 0,32 | 0,0736 | 0,0736 | |||||
| CSCO / Cisco Systems, Inc. | 0,00 | 0,32 | 0,0736 | 0,0736 | |||||
| HTZ / Hertz Global Holdings, Inc. | 0,05 | -78,66 | 0,32 | -63,06 | 0,0736 | -0,1638 | |||
| AWI / Armstrong World Industries, Inc. | 0,00 | -64,28 | 0,32 | -58,87 | 0,0734 | -0,1392 | |||
| ANET / Arista Networks Inc | 0,00 | 29,60 | 0,32 | 19,85 | 0,0734 | -0,0163 | |||
| LEG / Leggett & Platt, Incorporated | 0,04 | -61,53 | 0,32 | -56,70 | 0,0734 | -0,1284 | |||
| CRM / Salesforce, Inc. | 0,00 | 0,32 | 0,0731 | 0,0731 | |||||
| TRMK / Trustmark Corporation | 0,01 | 0,32 | 0,0730 | 0,0730 | |||||
| CRUS / Cirrus Logic, Inc. | 0,00 | -13,41 | 0,32 | -27,23 | 0,0728 | -0,1524 | |||
| BLMN / Bloomin' Brands, Inc. | 0,04 | -28,25 | 0,32 | -13,86 | 0,0726 | -0,0279 | |||
| WCC / WESCO International, Inc. | 0,00 | 109,54 | 0,32 | 1 032,14 | 0,0726 | -0,1409 | |||
| CRSR / Corsair Gaming, Inc. | 0,03 | 0,32 | 0,0725 | 0,0725 | |||||
| GIL / Gildan Activewear Inc. | 0,01 | 178,68 | 0,32 | 989,66 | 0,0725 | -0,1146 | |||
| CC / The Chemours Company | 0,03 | 831,86 | 0,32 | 238,71 | 0,0723 | -0,2272 | |||
| OLN / Olin Corporation | 0,02 | 0,32 | 0,0722 | 0,0722 | |||||
| ONTO / Onto Innovation Inc. | 0,00 | 185,99 | 0,32 | 39,38 | 0,0721 | -0,0445 | |||
| PII / Polaris Inc. | 0,01 | 7 809,18 | 0,32 | 2 323,08 | 0,0721 | -0,1623 | |||
| GNTX / Gentex Corporation | 0,01 | 290,63 | 0,31 | 163,87 | 0,0720 | -0,1027 | |||
| CE / Celanese Corporation | 0,01 | 0,31 | 0,0720 | 0,0720 | |||||
| SONO / Sonos, Inc. | 0,03 | 40,09 | 0,31 | 23,14 | 0,0720 | -0,0593 | |||
| CIM / Chimera Investment Corporation | 0,02 | 0,31 | 0,0719 | 0,0719 | |||||
| TFX / Teleflex Incorporated | 0,00 | 0,31 | 0,0719 | 0,0719 | |||||
| FHN / First Horizon Corporation | 0,01 | 0,31 | 0,0717 | 0,0717 | |||||
| THC / Tenet Healthcare Corporation | 0,00 | -70,52 | 0,31 | -61,39 | 0,0714 | -0,1494 | |||
| BDC / Belden Inc. | 0,00 | -63,67 | 0,31 | -58,09 | 0,0713 | -0,1314 | |||
| GM / General Motors Company | 0,01 | -16,72 | 0,31 | -12,92 | 0,0710 | -0,0262 | |||
| MPC / Marathon Petroleum Corporation | 0,00 | -10,36 | 0,31 | 6,90 | 0,0710 | -0,0266 | |||
| MHO / M/I Homes, Inc. | 0,00 | -57,83 | 0,31 | -58,58 | 0,0707 | -0,1330 | |||
| KN / Knowles Corporation | 0,02 | -25,06 | 0,31 | -33,69 | 0,0702 | -0,0853 | |||
| PYPL / PayPal Holdings, Inc. | 0,00 | 32,83 | 0,31 | 61,05 | 0,0701 | -0,2080 | |||
| SFM / Sprouts Farmers Market, Inc. | 0,00 | -65,79 | 0,31 | -63,16 | 0,0700 | -0,1563 | |||
| LUV / Southwest Airlines Co. | 0,01 | 0,30 | 0,0696 | 0,0696 | |||||
| ZIP / ZipRecruiter, Inc. | 0,06 | 0,30 | 0,0688 | 0,0688 | |||||
| OFIX / Orthofix Medical Inc. | 0,03 | 0,30 | 0,0688 | 0,0688 | |||||
| PLAB / Photronics, Inc. | 0,02 | 406,41 | 0,30 | 206,12 | 0,0687 | -0,0755 | |||
| DLB / Dolby Laboratories, Inc. | 0,00 | 2 958,33 | 0,30 | 2 391,67 | 0,0686 | -0,1579 | |||
| PSTG / Pure Storage, Inc. | 0,01 | 0,30 | 0,0685 | 0,0685 | |||||
| ABNB / Airbnb, Inc. | 0,00 | -18,09 | 0,30 | -9,17 | 0,0680 | -0,0214 | |||
| IEP / Icahn Enterprises L.P. | 0,04 | -0,47 | 0,29 | -11,45 | 0,0673 | -0,0236 | |||
| TT / Trane Technologies plc | 0,00 | -43,05 | 0,29 | -26,20 | 0,0672 | -0,0413 | |||
| LOW / Lowe's Companies, Inc. | 0,00 | -10,79 | 0,29 | -15,07 | 0,0672 | -0,0273 | |||
| AVNS / Avanos Medical, Inc. | 0,02 | 0,29 | 0,0659 | 0,0659 | |||||
| HBI / Hanesbrands Inc. | 0,06 | 32,61 | 0,28 | 23,25 | 0,0643 | -0,0868 | |||
| GLOB / Globant S.A. | 0,00 | 0,27 | 0,0622 | 0,0622 | |||||
| HUN / Huntsman Corporation | 0,03 | 555,76 | 0,27 | 173,47 | 0,0615 | -0,0827 | |||
| ONON / On Holding AG | 0,00 | -42,86 | 0,26 | -32,20 | 0,0593 | -0,0451 | |||
| CAL / Caleres, Inc. | 0,02 | 287,71 | 0,24 | 99,16 | 0,0542 | -0,1031 | |||
| GAP / The Gap, Inc. | 0,01 | -11,97 | 0,23 | -18,73 | 0,0528 | -0,0425 | |||
| B 07/29/25 / DBT (US912797QC43) | 0,10 | 0,0228 | 0,0228 | ||||||
| ABIOMED INC -CVR / EC (N/A) | 0,00 | 0,00 | 0,0001 | 0,0001 | |||||
| ORLA / Orla Mining Ltd. | 0,00 | -100,00 | 0,00 | -100,00 | 0,0000 | -0,0968 | |||
| SEMR / Semrush Holdings, Inc. | 0,00 | -100,00 | 0,00 | -100,00 | 0,0000 | -0,2027 | |||
| ENPH / Enphase Energy, Inc. | 0,00 | -100,00 | 0,00 | -100,00 | -0,0943 | ||||
| US61747C7074 / Morgan Stanley Institutional Liquidity Funds Government Portfolio, Institutional Class | 0,00 | 0,00 | 0,0000 | 0,0000 | |||||
| US2619081076 / DREYFUS TREASURY PRIME CASH MANAGEMENT/ CLASS A | 0,00 | 0,00 | 0,0000 | 0,0000 | |||||
| TFDXX / Blackrock Liquidity Funds - BlackRock Liquidity Funds FedFund Portfolio Institutional Class | 0,00 | 0,00 | 0,0000 | 0,0000 | |||||
| BRV / Brady Corporation | 0,00 | -100,00 | 0,00 | -100,00 | -0,1133 | ||||
| RS / Reliance, Inc. | 0,00 | -100,00 | 0,00 | -100,00 | -0,0968 | ||||
| MTL / Mechel PJSC - ADR | 0,02 | 0,00 | 0,00 | 0,0000 | 0,0000 | ||||
| PRTH / Priority Technology Holdings, Inc. | 0,00 | -100,00 | 0,00 | -100,00 | -0,0976 | ||||
| GDYN / Grid Dynamics Holdings, Inc. | 0,00 | -100,00 | 0,00 | -100,00 | -0,1084 | ||||
| SHLS / Shoals Technologies Group, Inc. | 0,00 | -100,00 | 0,00 | -100,00 | -0,2158 | ||||
| AI / C3.ai, Inc. | 0,00 | -100,00 | 0,00 | -100,00 | -0,0991 | ||||
| WFC / West Fraser Timber Co. Ltd. | 0,00 | -100,00 | 0,00 | -100,00 | -0,1033 | ||||
| UTI / Universal Technical Institute, Inc. | 0,00 | -100,00 | 0,00 | -100,00 | -0,1067 | ||||
| UTI / Universal Technical Institute, Inc. | 0,00 | -100,00 | 0,00 | -100,00 | -0,1067 | ||||
| RS / Reliance, Inc. | 0,00 | -100,00 | 0,00 | -100,00 | -0,0968 | ||||
| GO / Grocery Outlet Holding Corp. | 0,00 | -100,00 | 0,00 | -100,00 | -0,2310 | ||||
| BMI / Badger Meter, Inc. | 0,00 | -100,00 | 0,00 | -100,00 | -0,1130 | ||||
| USNA / USANA Health Sciences, Inc. | 0,00 | -100,00 | 0,00 | -100,00 | -0,1150 | ||||
| NOMD / Nomad Foods Limited | 0,00 | -100,00 | 0,00 | -100,00 | -0,0902 | ||||
| HOOD / Robinhood Markets, Inc. | 0,00 | -100,00 | 0,00 | -100,00 | -0,0987 | ||||
| AMD / Advanced Micro Devices, Inc. | 0,00 | -100,00 | 0,00 | -100,00 | -0,0945 | ||||
| TMCI / Treace Medical Concepts, Inc. | 0,00 | -100,00 | 0,00 | -100,00 | -0,1010 | ||||
| BCPC / Balchem Corporation | 0,00 | -100,00 | 0,00 | -100,00 | -0,2123 | ||||
| AMRC / Ameresco, Inc. | 0,00 | -100,00 | 0,00 | -100,00 | -0,1040 | ||||
| 1TU / TransUnion | 0,00 | -100,00 | 0,00 | -100,00 | -0,0913 | ||||
| CMCSA / Comcast Corporation | 0,00 | -100,00 | 0,00 | -100,00 | -0,0947 | ||||
| WRBY / Warby Parker Inc. | 0,00 | -100,00 | 0,00 | -100,00 | -0,1056 | ||||
| BFLY / Butterfly Network, Inc. | 0,00 | -100,00 | 0,00 | -100,00 | -0,0947 | ||||
| CLOV / Clover Health Investments, Corp. | 0,00 | -100,00 | 0,00 | -100,00 | -0,1088 | ||||
| MSCPUS1 INDEX / DO (N/A) | 0,09 | -0,00 | -0,0004 | -0,0004 | |||||
| MSCPIN1 INDEX / DO (N/A) | 0,09 | -0,07 | -0,0156 | -0,0156 | |||||
| JPCPULS2 INDEX / DO (N/A) | 0,18 | -0,58 | -0,1315 | -0,1315 | |||||
| JPCPULS2 INDEX / DO (N/A) | 0,18 | -0,58 | -0,1315 | -0,1315 | |||||
| JPCPULS2 INDEX / DO (N/A) | 0,18 | -0,58 | -0,1315 | -0,1315 | |||||
| JPCPULS1 INDEX / DO (N/A) | 0,39 | -1,47 | -0,3352 | -0,3352 | |||||
| JCP1MULS INDEX / DO (N/A) | 0,36 | -3,02 | -0,6907 | -0,6907 | |||||
| CP TE - JPCPUSHA IND / DO (N/A) | 0,60 | -4,92 | -1,1252 | -1,1252 | |||||
| CP TE - JPCPUSHB IND / DO (N/A) | 0,78 | -6,42 | -1,4687 | -1,4687 |