Statistiques de base
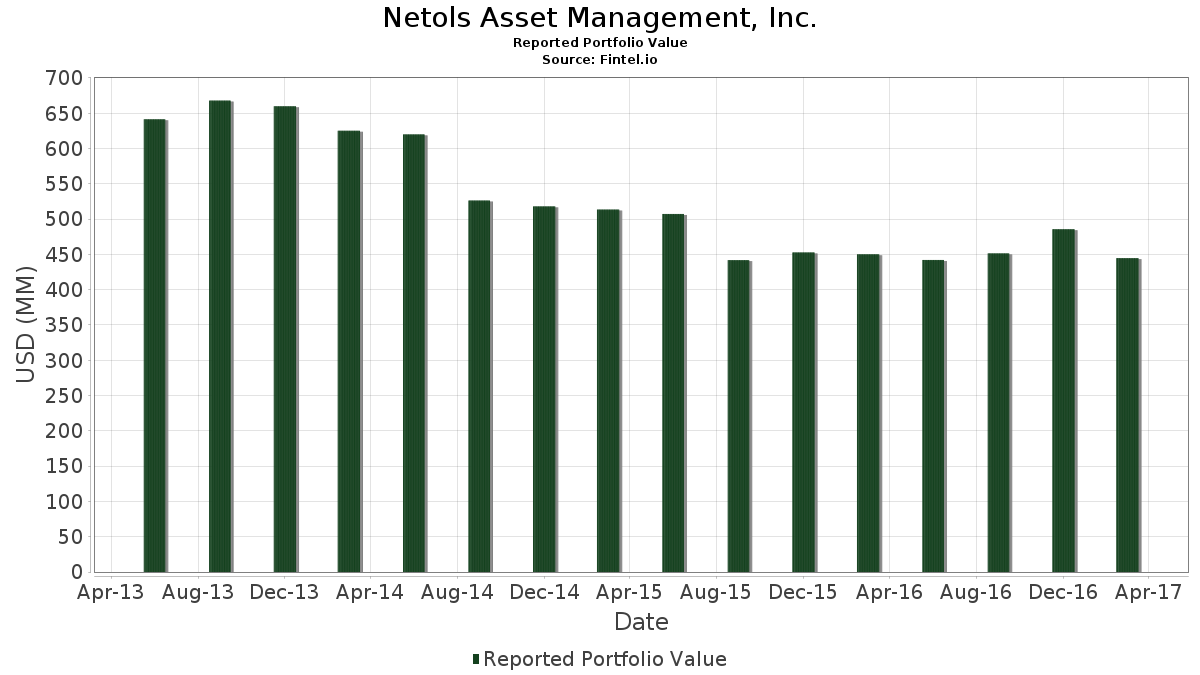
| Valeur du portefeuille | $ 444 730 000 |
| Positions actuelles | 69 |
Dernières positions, performances, ASG (à partir des dépôts 13F, 13D)
Netols Asset Management, Inc. a déclaré un total de 69 positions dans ses derniers dépôts auprès de la SEC. La valeur la plus récente du portefeuille est calculée à 444 730 000 USD. Les actifs sous gestion réels (ASG) sont cette valeur plus les liquidités (qui ne sont pas divulguées). Les principales positions de Netols Asset Management, Inc. sont Sterling Bancorp. (US:STL) , Selective Insurance Group, Inc. (US:SIGI) , Bob Evans Farms, Inc. (US:BOBE) , MGIC Investment Corporation (US:MTG) , and The Hanover Insurance Group, Inc. (US:THG) . Les nouvelles positions de Netols Asset Management, Inc. incluent Standex International Corporation (US:SXI) , ArcBest Corporation (US:ARCB) , Harmonic Inc. (US:HLIT) , Triumph Group, Inc. (US:TGI) , and .
Meilleures augmentations ce trimestre
Nous utilisons la variation de l'allocation du portefeuille car il s'agit de l'indicateur le plus significatif. Les changements peuvent être dus à des transactions ou à des variations de prix des actions.
| Titre | Actions (en millions) |
Valeur ($ en millions) |
% du portefeuille | ΔPortefeuille % |
|---|---|---|---|---|
| 0,16 | 10,11 | 2,2740 | 2,2740 | |
| 0,45 | 9,41 | 2,1168 | 2,1168 | |
| 0,24 | 9,32 | 2,0950 | 2,0950 | |
| 0,08 | 9,19 | 2,0666 | 2,0666 | |
| 1,34 | 9,03 | 2,0302 | 2,0302 | |
| 0,26 | 8,13 | 1,8283 | 1,8283 | |
| 0,31 | 7,98 | 1,7941 | 1,7941 | |
| 0,21 | 7,30 | 1,6423 | 1,6423 | |
| 0,59 | 6,99 | 1,5722 | 1,5722 | |
| 0,16 | 6,71 | 1,5081 | 1,5081 |
Principales baisses ce trimestre
Nous utilisons la variation de l'allocation du portefeuille car il s'agit de l'indicateur le plus significatif. Les changements peuvent être dus à des transactions ou à des variations de prix des actions.
| Titre | Actions (en millions) |
Valeur ($ en millions) |
% du portefeuille | ΔPortefeuille % |
|---|---|---|---|---|
| 0,00 | 0,00 | -1,6457 | ||
| 0,12 | 3,67 | 0,8245 | -0,5195 | |
| 0,15 | 4,37 | 0,9835 | -0,4071 | |
| 0,37 | 5,21 | 1,1710 | -0,3894 | |
| 0,21 | 7,22 | 1,6232 | -0,3504 | |
| 0,60 | 2,75 | 0,6181 | -0,3248 | |
| 0,20 | 6,18 | 1,3905 | -0,2751 | |
| 0,17 | 4,96 | 1,1148 | -0,2646 | |
| 0,12 | 6,76 | 1,5202 | -0,1833 | |
| 0,26 | 5,33 | 1,1989 | -0,1550 |
Déclarations 13F et dépôts de fonds
Ce formulaire a été déposé le 2017-05-10 pour la période de déclaration 2017-03-31. Cliquez sur l'icône du lien pour voir l'historique complet des transactions.
Mettre à niveau pour débloquer les données premium et exporter vers Excel ![]() .
.
| Titre | Type | Prix moyen de l'action | Actions (en millions) |
ΔActions (%) |
ΔActions (%) |
Valeur ($ en millions) |
Portefeuille (%) |
ΔPortefeuille (%) |
|
|---|---|---|---|---|---|---|---|---|---|
| STL / Sterling Bancorp. | 0,44 | -8,18 | 10,38 | -7,00 | 2,3351 | 0,0360 | |||
| SIGI / Selective Insurance Group, Inc. | 0,22 | -12,71 | 10,14 | -4,40 | 2,2798 | 0,0962 | |||
| BOBE / Bob Evans Farms, Inc. | 0,16 | -8,15 | 10,11 | 11,97 | 2,2740 | 2,2740 | |||
| MTG / MGIC Investment Corporation | 0,97 | -8,11 | 9,86 | -8,65 | 2,2169 | -0,0053 | |||
| THG / The Hanover Insurance Group, Inc. | 0,10 | -12,81 | 9,45 | -13,72 | 2,1242 | -0,1301 | |||
| LL / LL Flooring Holdings, Inc. | 0,45 | -8,16 | 9,41 | 22,47 | 2,1168 | 2,1168 | |||
| BRC / Brady Corporation | 0,24 | -8,14 | 9,32 | -5,45 | 2,0950 | 2,0950 | |||
| CACI / CACI International Inc | 0,08 | -8,14 | 9,19 | -13,32 | 2,0666 | 2,0666 | |||
| SUI / Sun Communities, Inc. | 0,11 | -8,07 | 9,04 | -3,61 | 2,0327 | 0,1017 | |||
| / McDermott International, Inc. | 1,34 | -8,09 | 9,03 | -16,05 | 2,0302 | 2,0302 | |||
| ENTG / Entegris, Inc. | 0,37 | -8,13 | 8,63 | 20,09 | 1,9407 | 0,4610 | |||
| FICO / Fair Isaac Corporation | 0,07 | -8,09 | 8,49 | -0,60 | 1,9083 | 0,1505 | |||
| CASY / Casey's General Stores, Inc. | 0,07 | -8,20 | 8,38 | -13,33 | 1,8850 | -0,1064 | |||
| WBS / Webster Financial Corporation | 0,17 | -8,14 | 8,34 | -15,31 | 1,8751 | -0,1523 | |||
| MPAA / Motorcar Parts of America, Inc. | 0,26 | -8,09 | 8,13 | 4,92 | 1,8283 | 1,8283 | |||
| CSFL / Centerstate Banks, Inc. | 0,31 | -8,17 | 7,98 | -5,51 | 1,7941 | 1,7941 | |||
| PLXS / Plexus Corp. | 0,14 | -8,14 | 7,95 | -1,75 | 1,7885 | 0,1216 | |||
| STBZ / State Bank Financial Corp. | 0,28 | -8,16 | 7,42 | -10,69 | 1,6678 | -0,0422 | |||
| / Briggs & Stratton Corp. | 0,33 | -8,21 | 7,40 | -7,43 | 1,6642 | 0,0181 | |||
| AUB / Atlantic Union Bankshares Corporation | 0,21 | -8,11 | 7,30 | -9,55 | 1,6423 | 1,6423 | |||
| MANT / Mantech International Corp - Class A | 0,21 | -8,12 | 7,22 | -24,69 | 1,6232 | -0,3504 | |||
| GBCI / Glacier Bancorp, Inc. | 0,21 | -8,18 | 7,08 | -14,02 | 1,5931 | -0,1034 | |||
| BXS / BancorpSouth Bank | 0,23 | -8,22 | 7,05 | -10,58 | 1,5848 | -0,0380 | |||
| IART / Integra LifeSciences Holdings Corporation | 0,17 | 83,82 | 7,01 | -9,73 | 1,5767 | -0,0227 | |||
| FORM / FormFactor, Inc. | 0,59 | -8,17 | 6,99 | -2,83 | 1,5722 | 1,5722 | |||
| CBU / Community Financial System, Inc. | 0,12 | -8,17 | 6,76 | -18,29 | 1,5202 | -0,1833 | |||
| EXK / Endeavour Silver Corp. | 0,16 | -8,14 | 6,71 | -11,29 | 1,5081 | 1,5081 | |||
| ONB / Old National Bancorp | 0,38 | -8,10 | 6,67 | -12,15 | 1,5009 | -0,0634 | |||
| CNMD / CONMED Corporation | 0,15 | -8,11 | 6,65 | -7,61 | 1,4951 | 0,0133 | |||
| WSBC / WesBanco, Inc. | 0,17 | -8,10 | 6,64 | -18,66 | 1,4930 | 1,4930 | |||
| BGC / BGC Group, Inc. | 0,37 | -8,11 | 6,63 | -13,41 | 1,4912 | -0,0857 | |||
| SRCI / SRC Energy Inc | 0,78 | -8,10 | 6,55 | -12,95 | 1,4726 | -0,0763 | |||
| MATW / Matthews International Corporation | 0,10 | -8,09 | 6,51 | -19,09 | 1,4629 | 1,4629 | |||
| FR / First Industrial Realty Trust, Inc. | 0,24 | -8,08 | 6,50 | -12,73 | 1,4604 | -0,0718 | |||
| URI / United Rentals, Inc. | 0,05 | -19,96 | 6,41 | -5,20 | 1,4420 | 0,0492 | |||
| US92346NAB55 / VeriFone Systems, Inc | 0,34 | -8,13 | 6,36 | -2,93 | 1,4294 | 0,0810 | |||
| TEN / Tsakos Energy Navigation Limited | 0,10 | -8,10 | 6,35 | -8,18 | 1,4287 | 0,0040 | |||
| HAWK / Blackhawk Network Holdings, Inc. | 0,16 | -8,09 | 6,34 | -0,95 | 1,4254 | 1,4254 | |||
| CIR / Circor International Inc | 0,11 | -2,09 | 6,28 | -10,29 | 1,4128 | 1,4128 | |||
| ETD / Ethan Allen Interiors Inc. | 0,20 | -8,10 | 6,18 | -23,56 | 1,3905 | -0,2751 | |||
| SXT / Sensient Technologies Corporation | 0,08 | -8,10 | 5,96 | -7,31 | 1,3397 | 0,0162 | |||
| SXI / Standex International Corporation | 0,06 | 5,94 | 1,3354 | 1,3354 | |||||
| AVID / Avid Technology, Inc. | 1,27 | 27,62 | 5,90 | 35,14 | 1,3264 | 1,3264 | |||
| CRI / Carter's, Inc. | 0,07 | -8,10 | 5,89 | -4,46 | 1,3235 | 0,0550 | |||
| WAB / Westinghouse Air Brake Technologies Corporation | 0,07 | -8,13 | 5,69 | -13,68 | 1,2788 | -0,0776 | |||
| GWR / Genesee & Wyoming, Inc. | 0,08 | -8,09 | 5,61 | -10,14 | 1,2612 | -0,0239 | |||
| IVC / Invacare Corp. | 0,47 | -8,08 | 5,59 | -16,18 | 1,2569 | -0,1161 | |||
| EPAY / Bottomline Technologies (Delaware) Inc | 0,23 | -8,12 | 5,53 | -13,15 | 1,2432 | 1,2432 | |||
| OIS / Oil States International, Inc. | 0,16 | -8,10 | 5,33 | -21,89 | 1,1996 | 1,1996 | |||
| TRS / TriMas Corporation | 0,26 | -8,17 | 5,33 | -18,92 | 1,1989 | -0,1550 | |||
| AMRI / Albany Molecular Research, Inc. | 0,37 | -8,11 | 5,21 | -31,28 | 1,1710 | -0,3894 | |||
| CALM / Cal-Maine Foods, Inc. | 0,14 | -1,32 | 5,15 | -17,79 | 1,1585 | 1,1585 | |||
| CRS / Carpenter Technology Corporation | 0,14 | 14,20 | 5,05 | 17,77 | 1,1357 | 0,2527 | |||
| CAKE / The Cheesecake Factory Incorporated | 0,08 | -8,12 | 5,04 | -2,78 | 1,1335 | 0,0660 | |||
| UFI / Unifi, Inc. | 0,17 | -14,95 | 4,96 | -26,00 | 1,1148 | -0,2646 | |||
| ARCB / ArcBest Corporation | 0,19 | 4,95 | 1,1139 | 1,1139 | |||||
| THR / Thermon Group Holdings, Inc. | 0,23 | -8,13 | 4,74 | 0,27 | 1,0667 | 0,0927 | |||
| HLIT / Harmonic Inc. | 0,79 | 4,71 | 1,0582 | 1,0582 | |||||
| NDLS / Noodles & Company | 0,79 | -7,51 | 4,54 | 29,72 | 1,0217 | 1,0217 | |||
| USPH / U.S. Physical Therapy, Inc. | 0,07 | -8,09 | 4,49 | -14,51 | 1,0098 | -0,0717 | |||
| AYI / Acuity Inc. | 0,02 | -8,07 | 4,44 | -18,77 | 0,9986 | -0,1270 | |||
| PRGS / Progress Software Corporation | 0,15 | -28,82 | 4,37 | -35,24 | 0,9835 | -0,4071 | |||
| KND / Kindred Healthcare, Inc. | 0,50 | 22,04 | 4,20 | 29,82 | 0,9446 | 0,9446 | |||
| MLHR / Herman Miller Inc. | 0,12 | -39,10 | 3,67 | -43,83 | 0,8245 | -0,5195 | |||
| CVGI / Commercial Vehicle Group, Inc. | 0,48 | -7,99 | 3,23 | 12,65 | 0,7270 | 0,1361 | |||
| TGI / Triumph Group, Inc. | 0,12 | 2,96 | 0,6665 | 0,6665 | |||||
| PGTI / PGT Innovations, Inc. | 0,26 | -20,88 | 2,77 | -25,70 | 0,6240 | -0,1450 | |||
| BBG / Bill Barrett Corp. | 0,60 | -7,78 | 2,75 | -39,98 | 0,6181 | -0,3248 | |||
| WG / Willbros Group, Inc. | 0,68 | -7,72 | 1,85 | -21,95 | 0,4167 | -0,0721 | |||
| 918194101 / VCA Inc. | 0,00 | -100,00 | 0,00 | -100,00 | -1,6457 | ||||
| ACAT / Acasia Technology, Inc. | 0,00 | -100,00 | 0,00 | -100,00 | 0,0000 | 0,0000 |