Statistiques de base
| Valeur du portefeuille | $ 1 253 942 445 |
| Positions actuelles | 150 |
Dernières positions, performances, ASG (à partir des dépôts 13F, 13D)
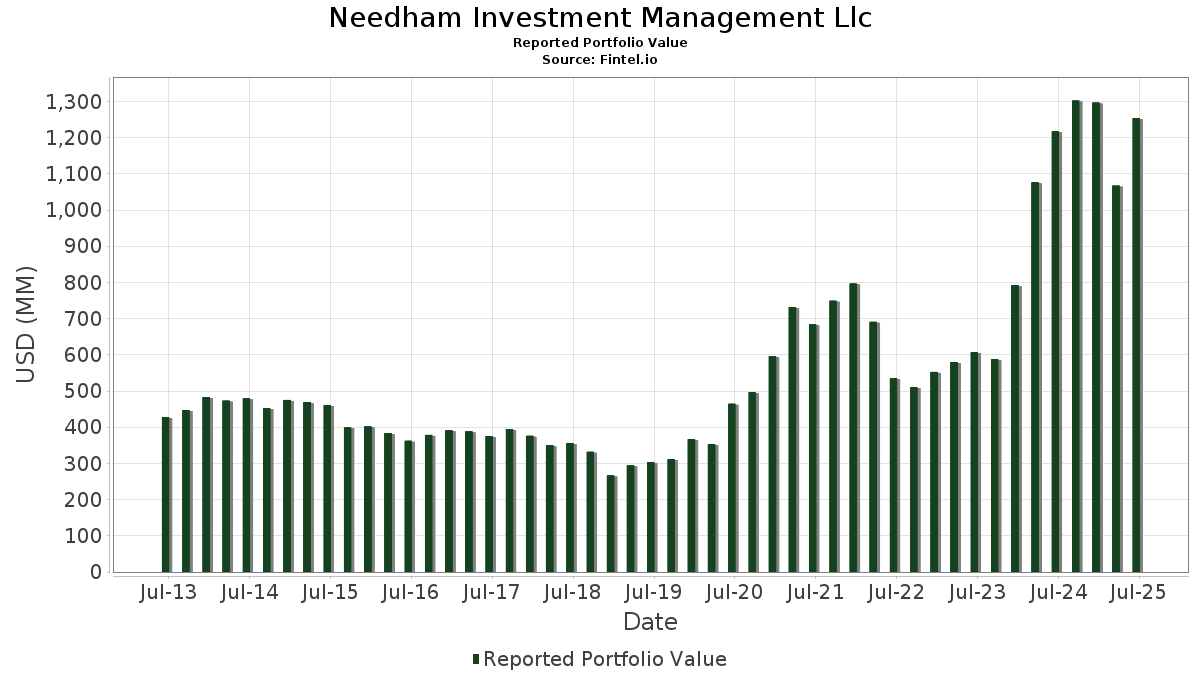
Needham Investment Management Llc a déclaré un total de 150 positions dans ses derniers dépôts auprès de la SEC. La valeur la plus récente du portefeuille est calculée à 1 253 942 445 USD. Les actifs sous gestion réels (ASG) sont cette valeur plus les liquidités (qui ne sont pas divulguées). Les principales positions de Needham Investment Management Llc sont Super Micro Computer, Inc. (US:SMCI) , ThredUp Inc. (US:TDUP) , PDF Solutions, Inc. (US:PDFS) , Vertiv Holdings Co (US:VRT) , and nLIGHT, Inc. (US:LASR) . Les nouvelles positions de Needham Investment Management Llc incluent Circle Internet Group, Inc. (US:CRCL) , Sportradar Group AG (US:SRAD) , Select Water Solutions, Inc. (US:WTTR) , Evolv Technologies Holdings, Inc. (US:EVLV) , and . Les principales industries de Needham Investment Management Llc sont "Printing, Publishing, And Allied Industries" (sic 27) , "Insurance Carriers" (sic 63) , and "Food And Kindred Products" (sic 20) .
Meilleures augmentations ce trimestre
Nous utilisons la variation de l'allocation du portefeuille car il s'agit de l'indicateur le plus significatif. Les changements peuvent être dus à des transactions ou à des variations de prix des actions.
| Titre | Actions (en millions) |
Valeur ($ en millions) |
% du portefeuille | ΔPortefeuille % |
|---|---|---|---|---|
| 5,88 | 44,00 | 1,9803 | 0,5463 | |
| 0,01 | 1,81 | 0,1446 | 0,1446 | |
| 0,04 | 0,98 | 0,0784 | 0,0784 | |
| 0,10 | 0,86 | 0,0689 | 0,0689 | |
| 0,10 | 0,62 | 0,0498 | 0,0498 | |
| 0,04 | 0,79 | 0,0356 | 0,0356 | |
| 0,04 | 0,72 | 0,0323 | 0,0013 |
Principales baisses ce trimestre
Nous utilisons la variation de l'allocation du portefeuille car il s'agit de l'indicateur le plus significatif. Les changements peuvent être dus à des transactions ou à des variations de prix des actions.
| Titre | Actions (en millions) |
Valeur ($ en millions) |
% du portefeuille | ΔPortefeuille % |
|---|---|---|---|---|
| 0,71 | 32,00 | 1,4402 | -1,9527 | |
| 1,91 | 40,91 | 1,8411 | -1,4986 | |
| 1,43 | 69,94 | 3,1474 | -1,4487 | |
| 5,53 | 25,05 | 1,1273 | -1,2640 | |
| 1,52 | 24,22 | 1,0899 | -1,0953 | |
| 2,35 | 24,49 | 1,1022 | -1,0880 | |
| 0,24 | 19,36 | 0,8711 | -1,0389 | |
| 0,82 | 35,94 | 1,6176 | -0,9876 | |
| 0,56 | 33,12 | 1,4907 | -0,9255 | |
| 0,62 | 17,51 | 0,7879 | -0,8888 |
Déclarations 13D/G
Il s'agit d'une liste des déclarations 13D et 13G déposées au cours de la dernière année (le cas échéant). Cliquez sur l'icône du lien pour voir l'historique complet des transactions. Les lignes vertes indiquent de nouvelles positions. Les lignes rouges indiquent des positions fermées.
| Date de dépôt | Formulaire | Titre | Actions précédentes |
Actions actuelles |
ΔActions % | % de participation |
% ΔParticipation | |
|---|---|---|---|---|---|---|---|---|
| 2025-08-13 | KVHI / KVH Industries, Inc. | 1 366 500 | 814 100 | -40,42 | 4,20 | -39,13 | ||
| 2025-08-13 | LASR / nLIGHT, Inc. | 2 652 115 | 1 837 740 | -30,71 | 3,70 | -32,48 | ||
| 2025-08-13 | TDUP / ThredUp Inc. | 6 200 000 | 5 875 000 | -5,24 | 6,10 | -17,01 | ||
| 2025-05-14 | LGTY / Logility Supply Chain Solutions, Inc. | 1 675 000 | 460 000 | -72,54 | 1,40 | -73,68 | ||
| 2025-05-14 | POCI / Precision Optics Corporation, Inc. | 400 000 | 700 000 | 75,00 | 9,10 | 44,44 | ||
| 2025-05-14 | UIS / Unisys Corporation | 4 630 000 | 5 559 800 | 20,08 | 8,00 | 19,58 | ||
| 2025-05-14 | AE / Adams Resources & Energy, Inc. | 190 000 | 0 | -100,00 | 0,00 | -100,00 | ||
| 2025-02-13 | MTRX / Matrix Service Company | 1 375 000 | 1 420 000 | 3,27 | 5,15 | 3,21 | ||
| 2024-12-20 | CMTL / Comtech Telecommunications Corp. | 1 502 500 | 1 780 000 | 18,47 | 6,11 | 15,94 | ||
| 2024-11-13 | FARO / FARO Technologies, Inc. | 1 029 250 | 5,28 | |||||
| 2024-11-13 | EDUC / Educational Development Corporation | 560 000 | 805 000 | 43,75 | 9,38 | 43,64 | ||
| 2024-11-13 | RSSS / Research Solutions, Inc. | 1 700 000 | 2 875 000 | 69,12 | 8,83 | 69,48 | ||
| 2024-11-13 | ASUR / Asure Software, Inc. | 1 315 000 | 2 482 500 | 88,78 | 9,38 | 82,14 | ||
| 2024-11-13 | VPG / Vishay Precision Group, Inc. | 677 500 | 5,54 |
Déclarations 13F et dépôts de fonds
Ce formulaire a été déposé le 2025-08-14 pour la période de déclaration 2025-06-30. Cliquez sur l'icône du lien pour voir l'historique complet des transactions.
Mettre à niveau pour débloquer les données premium et exporter vers Excel ![]() .
.
| Titre | Type | Prix moyen de l'action | Actions (en millions) |
ΔActions (%) |
ΔActions (%) |
Valeur ($ en millions) |
Portefeuille (%) |
ΔPortefeuille (%) |
|
|---|---|---|---|---|---|---|---|---|---|
| SMCI / Super Micro Computer, Inc. | 1,43 | -0,38 | 69,94 | 42,59 | 3,1474 | -1,4487 | |||
| TDUP / ThredUp Inc. | 5,88 | -7,48 | 44,00 | 187,54 | 1,9803 | 0,5463 | |||
| PDFS / PDF Solutions, Inc. | 1,91 | 2,60 | 40,91 | 14,79 | 1,8411 | -1,4986 | |||
| VRT / Vertiv Holdings Co | 0,28 | 0,00 | 36,56 | 77,86 | 1,6456 | -0,2809 | |||
| LASR / nLIGHT, Inc. | 1,84 | -28,23 | 36,17 | 81,78 | 1,6276 | -0,2366 | |||
| FARO / FARO Technologies, Inc. | 0,82 | -19,64 | 35,94 | 29,29 | 1,6176 | -0,9876 | |||
| NVMI / Nova Ltd. | 0,13 | -7,82 | 35,71 | 37,63 | 1,6070 | -0,8242 | |||
| ODC / Oil-Dri Corporation of America | 0,56 | 0,00 | 33,12 | 28,46 | 1,4907 | -0,9255 | |||
| VICR / Vicor Corporation | 0,71 | -8,85 | 32,00 | -11,62 | 1,4402 | -1,9527 | |||
| AIP / Arteris, Inc. | 2,96 | 5,07 | 28,16 | 44,91 | 1,2674 | -0,5538 | |||
| UIS / Unisys Corporation | 5,53 | -0,54 | 25,05 | -1,84 | 1,1273 | -1,2640 | |||
| GENI / Genius Sports Limited | 2,35 | 0,86 | 24,49 | 4,79 | 1,1022 | -1,0880 | |||
| ASUR / Asure Software, Inc. | 2,50 | 0,00 | 24,35 | 2,20 | 1,9420 | -0,2908 | |||
| VSH / Vishay Intertechnology, Inc. | 1,52 | 3,98 | 24,22 | 3,86 | 1,0899 | -1,0953 | |||
| FORM / FormFactor, Inc. | 0,66 | -1,50 | 22,54 | 19,81 | 1,0143 | -0,7486 | |||
| ARLO / Arlo Technologies, Inc. | 1,31 | 0,77 | 22,18 | 73,16 | 0,9980 | -0,2021 | |||
| PSN / Parsons Corporation | 0,29 | -1,11 | 20,74 | 19,86 | 0,9334 | -0,6880 | |||
| VITL / Vital Farms, Inc. | 0,51 | 0,50 | 19,55 | 27,04 | 0,8798 | -0,5621 | |||
| ENTG / Entegris, Inc. | 0,24 | 3,00 | 19,36 | -5,03 | 0,8711 | -1,0389 | |||
| MTRX / Matrix Service Company | 1,42 | 0,00 | 19,18 | 8,69 | 0,8634 | -0,7906 | |||
| VPG / Vishay Precision Group, Inc. | 0,66 | -4,04 | 18,48 | 11,93 | 0,8315 | -0,7153 | |||
| ASPN / Aspen Aerogels, Inc. | 3,01 | 10,12 | 17,84 | 2,02 | 0,8031 | -0,8359 | |||
| THR / Thermon Group Holdings, Inc. | 0,62 | -2,96 | 17,51 | -2,16 | 0,7879 | -0,8888 | |||
| CRAI / CRA International, Inc. | 0,08 | 1,80 | 15,88 | 10,13 | 0,7146 | -0,6365 | |||
| AKAM / Akamai Technologies, Inc. | 0,19 | -5,82 | 14,84 | -6,69 | 0,6676 | -0,8222 | |||
| COHR / Coherent Corp. | 0,17 | 0,00 | 14,81 | 37,37 | 0,6665 | -0,3437 | |||
| LH / Labcorp Holdings Inc. | 0,06 | -0,44 | 14,78 | 12,29 | 0,6653 | -0,5683 | |||
| VECO / Veeco Instruments Inc. | 0,72 | 0,00 | 14,65 | 1,19 | 0,6593 | -0,6973 | |||
| PLAB / Photronics, Inc. | 0,76 | 1,60 | 14,35 | -7,85 | 0,6457 | -0,8133 | |||
| CLH / Clean Harbors, Inc. | 0,06 | 0,00 | 14,08 | 17,29 | 0,6337 | -0,4912 | |||
| LINC / Lincoln Educational Services Corporation | 0,61 | 0,74 | 14,05 | 46,32 | 0,6323 | -0,2674 | |||
| BFAM / Bright Horizons Family Solutions Inc. | 0,11 | 0,00 | 13,29 | -2,72 | 0,5979 | -0,6818 | |||
| TTMI / TTM Technologies, Inc. | 0,32 | -32,04 | 13,23 | 35,25 | 0,5952 | -0,3211 | |||
| HII / Huntington Ingalls Industries, Inc. | 0,05 | 0,00 | 13,16 | 18,34 | 0,5922 | -0,4498 | |||
| KLAC / KLA Corporation | 0,01 | -9,38 | 12,99 | 19,42 | 0,5845 | -0,4347 | |||
| MKSI / MKS Inc. | 0,13 | 0,00 | 12,79 | 23,97 | 0,5757 | -0,3913 | |||
| WAB / Westinghouse Air Brake Technologies Corporation | 0,06 | -3,88 | 11,67 | 10,96 | 0,5253 | -0,4604 | |||
| NVT / nVent Electric plc | 0,16 | 0,00 | 11,54 | 39,73 | 0,5192 | -0,2544 | |||
| TMO / Thermo Fisher Scientific Inc. | 0,03 | 0,00 | 10,74 | -18,52 | 0,4836 | -0,7521 | |||
| UTI / Universal Technical Institute, Inc. | 0,31 | 1,63 | 10,54 | 34,12 | 0,4743 | -0,2620 | |||
| KVYO / Klaviyo, Inc. | 0,30 | -1,29 | 10,24 | 9,53 | 0,4609 | -0,4153 | |||
| ADTN / ADTRAN Holdings, Inc. | 1,12 | 0,00 | 10,05 | 2,87 | 0,4521 | -0,4630 | |||
| MKL / Markel Group Inc. | 0,00 | 0,00 | 9,89 | 6,83 | 0,4449 | -0,4223 | |||
| CTRI / Centuri Holdings, Inc. | 0,42 | -6,70 | 9,37 | 27,74 | 0,4218 | -0,2657 | |||
| BRKR / Bruker Corporation | 0,22 | -4,13 | 9,08 | -5,37 | 0,4088 | -0,4908 | |||
| ATRO / Astronics Corporation | 0,27 | 0,00 | 8,96 | 38,52 | 0,4030 | -0,2028 | |||
| KMX / CarMax, Inc. | 0,13 | -3,64 | 8,91 | -16,88 | 0,4008 | -0,6032 | |||
| RSSS / Research Solutions, Inc. | 2,93 | 0,00 | 8,41 | 10,38 | 0,3784 | -0,3354 | |||
| CMCSA / Comcast Corporation | 0,23 | -2,92 | 8,30 | -6,11 | 0,3734 | -0,4547 | |||
| ECVT / Ecovyst Inc. | 0,92 | 0,00 | 7,57 | 32,73 | 0,3408 | -0,1937 | |||
| SMID / Smith-Midland Corporation | 0,22 | 2,84 | 7,28 | 11,09 | 0,3277 | -0,2866 | |||
| EQIX / Equinix, Inc. | 0,01 | 16,88 | 7,16 | 14,03 | 0,3222 | -0,2661 | |||
| ECG / Everus Construction Group, Inc. | 0,10 | -13,93 | 6,67 | 47,44 | 0,3002 | -0,1238 | |||
| MDU / MDU Resources Group, Inc. | 0,39 | -14,16 | 6,57 | -15,38 | 0,2956 | -0,4317 | |||
| GILD / Gilead Sciences, Inc. | 0,06 | -3,91 | 6,13 | -4,92 | 0,2757 | -0,3281 | |||
| MTN / Vail Resorts, Inc. | 0,04 | 79,07 | 6,05 | 75,84 | 0,2723 | -0,0501 | |||
| TRNS / Transcat, Inc. | 0,07 | 2,31 | 5,72 | 18,12 | 0,2573 | -0,1962 | |||
| EHC / Encompass Health Corporation | 0,04 | -10,00 | 5,52 | 8,97 | 0,2483 | -0,2262 | |||
| MYRG / MYR Group Inc. | 0,03 | 0,00 | 5,44 | 60,47 | 0,2450 | -0,0729 | |||
| HLIT / Harmonic Inc. | 0,56 | 0,00 | 5,35 | -1,26 | 0,2408 | -0,2669 | |||
| HON / Honeywell International Inc. | 0,02 | 0,00 | 5,24 | 9,97 | 0,2358 | -0,2106 | |||
| VSAT / Viasat, Inc. | 0,36 | 0,00 | 5,18 | 40,11 | 0,2333 | -0,1134 | |||
| GRC / The Gorman-Rupp Company | 0,14 | 1,08 | 5,14 | 5,74 | 0,2314 | -0,2242 | |||
| CAMT / Camtek Ltd. | 0,06 | 26,32 | 5,07 | 82,22 | 0,2283 | -0,0326 | |||
| HQL / Abrdn Life Sciences Investors | 0,39 | 3,41 | 5,02 | 4,39 | 0,2257 | -0,2245 | |||
| CGNX / Cognex Corporation | 0,16 | 0,00 | 4,93 | 6,34 | 0,2220 | -0,2127 | |||
| BSY / Bentley Systems, Incorporated | 0,09 | -10,26 | 4,72 | 23,13 | 0,2125 | -0,1469 | |||
| BA / The Boeing Company | 0,02 | 0,00 | 4,71 | 22,86 | 0,2122 | -0,1474 | |||
| SITM / SiTime Corporation | 0,02 | -16,98 | 4,69 | 15,70 | 0,2110 | -0,1686 | |||
| ASML / ASML Holding N.V. - Depositary Receipt (Common Stock) | 0,01 | 4,55 | 4,61 | 26,43 | 0,2074 | -0,1341 | |||
| HQH / Abrdn Healthcare Investors | 0,28 | 7,07 | 4,39 | 2,12 | 0,1974 | -0,2051 | |||
| MDT / Medtronic plc | 0,05 | -1,96 | 4,36 | -4,88 | 0,1963 | -0,2335 | |||
| MRVL / Marvell Technology, Inc. | 0,06 | -2,63 | 4,30 | 22,40 | 0,1933 | -0,1355 | |||
| TER / Teradyne, Inc. | 0,05 | -21,49 | 4,27 | -14,53 | 0,1922 | -0,2761 | |||
| NVGS / Navigator Holdings Ltd. | 0,30 | -1,31 | 4,26 | 4,93 | 0,1917 | -0,1887 | |||
| CMT / Core Molding Technologies, Inc. | 0,26 | 0,00 | 4,23 | 9,13 | 0,1904 | -0,1728 | |||
| CMTL / Comtech Telecommunications Corp. | 1,69 | 0,00 | 4,14 | 53,13 | 0,1862 | -0,0670 | |||
| KVHI / KVH Industries, Inc. | 0,74 | -20,22 | 3,94 | -19,63 | 0,1773 | -0,2820 | |||
| TTD / The Trade Desk, Inc. | 0,05 | -25,34 | 3,92 | -1,78 | 0,1766 | -0,1977 | |||
| NTIC / Northern Technologies International Corporation | 0,52 | -1,90 | 3,82 | -30,18 | 0,1719 | -0,3407 | |||
| AAPL / Apple Inc. | 0,02 | -3,15 | 3,79 | -10,54 | 0,1704 | -0,2262 | |||
| ROG / Rogers Corporation | 0,06 | 0,00 | 3,77 | 1,40 | 0,1695 | -0,1785 | |||
| GTLS / Chart Industries, Inc. | 0,02 | -6,25 | 3,70 | 6,93 | 0,1667 | -0,1579 | |||
| RPD / Rapid7, Inc. | 0,16 | 100,00 | 3,70 | 74,53 | 0,1666 | -0,0322 | |||
| SSSS / SuRo Capital Corp. | 0,44 | 15,85 | 3,60 | 91,39 | 0,1621 | -0,0143 | |||
| POCI / Precision Optics Corporation, Inc. | 0,70 | 0,00 | 3,41 | 17,35 | 0,1534 | -0,1188 | |||
| LMAT / LeMaitre Vascular, Inc. | 0,04 | 3,90 | 3,32 | 2,85 | 0,1495 | -0,1532 | |||
| DD / DuPont de Nemours, Inc. | 0,05 | 46,15 | 3,26 | 34,24 | 0,1466 | -0,0808 | |||
| CRH / CRH plc | 0,03 | 0,00 | 3,03 | 4,34 | 0,1363 | -0,1357 | |||
| J / Jacobs Solutions Inc. | 0,02 | 2,33 | 2,89 | 11,24 | 0,1301 | -0,1134 | |||
| BDX / Becton, Dickinson and Company | 0,02 | -1,47 | 2,89 | -25,91 | 0,1298 | -0,2350 | |||
| APT / Alpha Pro Tech, Ltd. | 0,61 | 0,00 | 2,87 | -6,21 | 0,1293 | -0,1577 | |||
| BN / Brookfield Corporation | 0,05 | 0,00 | 2,86 | 18,21 | 0,1289 | -0,0982 | |||
| AL / Air Lease Corporation | 0,04 | -12,62 | 2,63 | 5,83 | 0,1185 | -0,1147 | |||
| CEVA / CEVA, Inc. | 0,12 | 25,00 | 2,53 | 7,26 | 0,1138 | -0,1070 | |||
| TTI / TETRA Technologies, Inc. | 0,75 | 61,29 | 2,52 | 61,33 | 0,1134 | -0,0330 | |||
| LRCX / Lam Research Corporation | 0,03 | 0,00 | 2,43 | 33,90 | 0,1095 | -0,0608 | |||
| ADI / Analog Devices, Inc. | 0,01 | 0,00 | 2,38 | 18,06 | 0,1071 | -0,0819 | |||
| PRO / PROS Holdings, Inc. | 0,15 | 87,50 | 2,35 | 54,34 | 0,1057 | -0,0369 | |||
| CRI / Carter's, Inc. | 0,08 | -35,98 | 2,30 | -52,85 | 0,1037 | -0,3543 | |||
| CYRX / Cryoport, Inc. | 0,31 | 10,81 | 2,29 | 35,92 | 0,1032 | -0,0549 | |||
| COHU / Cohu, Inc. | 0,12 | 0,00 | 2,27 | 30,84 | 0,1022 | -0,0605 | |||
| GLW / Corning Incorporated | 0,04 | -1,18 | 2,21 | 13,52 | 0,0994 | -0,0829 | |||
| MXL / MaxLinear, Inc. | 0,15 | 3,33 | 2,20 | 35,17 | 0,0991 | -0,0535 | |||
| CALX / Calix, Inc. | 0,04 | -81,13 | 2,13 | -71,69 | 0,0958 | -0,6083 | |||
| BIGC / Commerce.com, Inc. | 0,42 | -5,56 | 2,12 | -18,02 | 0,0956 | -0,1473 | |||
| SGH / SMART Global Holdings, Inc. | 0,10 | 5,00 | 2,08 | 19,75 | 0,0936 | -0,0692 | |||
| CRCL / Circle Internet Group, Inc. | 0,01 | 1,81 | 0,1446 | 0,1446 | |||||
| HPE / Hewlett Packard Enterprise Company | 0,08 | 0,00 | 1,72 | 32,48 | 0,0773 | -0,0441 | |||
| ALGM / Allegro MicroSystems, Inc. | 0,05 | 0,00 | 1,71 | 36,07 | 0,0769 | -0,0408 | |||
| GNRC / Generac Holdings Inc. | 0,01 | 0,00 | 1,58 | 13,07 | 0,0709 | -0,0597 | |||
| NSIT / Insight Enterprises, Inc. | 0,01 | 100,00 | 1,52 | 84,22 | 0,0684 | -0,0089 | |||
| AMAT / Applied Materials, Inc. | 0,01 | -8,33 | 1,51 | 15,62 | 0,0680 | -0,0544 | |||
| BMI / Badger Meter, Inc. | 0,01 | -58,62 | 1,47 | -46,74 | 0,0661 | -0,1924 | |||
| MATW / Matthews International Corporation | 0,06 | 26,32 | 1,43 | 35,80 | 0,0646 | -0,0344 | |||
| DGX / Quest Diagnostics Incorporated | 0,01 | -3,23 | 1,35 | 2,75 | 0,0606 | -0,0622 | |||
| ICHR / Ichor Holdings, Ltd. | 0,07 | 60,71 | 1,33 | 39,62 | 0,0597 | -0,0293 | |||
| ESOA / Energy Services of America Corporation | 0,12 | 25,00 | 1,24 | 31,43 | 0,0559 | -0,0326 | |||
| MBLY / Mobileye Global Inc. | 0,07 | -10,52 | 1,24 | 11,73 | 0,0558 | -0,0481 | |||
| CVX / Chevron Corporation | 0,01 | -5,71 | 1,18 | -19,28 | 0,0532 | -0,0840 | |||
| LUV / Southwest Airlines Co. | 0,04 | 0,00 | 1,14 | -3,38 | 0,0515 | -0,0595 | |||
| FEIM / Frequency Electronics, Inc. | 0,05 | -44,44 | 1,14 | -19,39 | 0,0511 | -0,0809 | |||
| RTX / RTX Corporation | 0,01 | 7,14 | 1,10 | 18,12 | 0,0493 | -0,0376 | |||
| MASS / 908 Devices Inc. | 0,15 | -25,00 | 1,07 | 19,31 | 0,0481 | -0,0358 | |||
| EDUC / Educational Development Corporation | 0,80 | -0,62 | 1,06 | -3,45 | 0,0479 | -0,0555 | |||
| SRAD / Sportradar Group AG | 0,04 | 0,98 | 0,0784 | 0,0784 | |||||
| VZ / Verizon Communications Inc. | 0,02 | 0,00 | 0,87 | -4,63 | 0,0389 | -0,0461 | |||
| WTTR / Select Water Solutions, Inc. | 0,10 | 0,86 | 0,0689 | 0,0689 | |||||
| AXTI / AXT, Inc. | 0,39 | -33,70 | 0,82 | -1,67 | 0,0370 | -0,0414 | |||
| QRHC / Quest Resource Holding Corporation | 0,41 | 0,00 | 0,82 | -22,27 | 0,0369 | -0,0620 | |||
| UCTT / Ultra Clean Holdings, Inc. | 0,04 | 0,79 | 0,0356 | 0,0356 | |||||
| CRWD / CrowdStrike Holdings, Inc. | 0,00 | 0,00 | 0,76 | 44,51 | 0,0344 | -0,0152 | |||
| EXTR / Extreme Networks, Inc. | 0,04 | 60,00 | 0,72 | 117,58 | 0,0323 | 0,0013 | |||
| GOOGL / Alphabet Inc. | 0,00 | 0,00 | 0,70 | 13,92 | 0,0317 | -0,0262 | |||
| BAM / Brookfield Asset Management Ltd. | 0,01 | 0,00 | 0,69 | 14,14 | 0,0313 | -0,0258 | |||
| TENB / Tenable Holdings, Inc. | 0,02 | 100,00 | 0,68 | 93,41 | 0,0304 | -0,0024 | |||
| EVLV / Evolv Technologies Holdings, Inc. | 0,10 | 0,62 | 0,0498 | 0,0498 | |||||
| LIND / Lindblad Expeditions Holdings, Inc. | 0,05 | 0,00 | 0,61 | 25,83 | 0,0274 | -0,0179 | |||
| PSTG / Pure Storage, Inc. | 0,01 | -50,00 | 0,58 | -35,03 | 0,0259 | -0,0571 | |||
| MRCY / Mercury Systems, Inc. | 0,01 | -63,64 | 0,54 | -54,56 | 0,0242 | -0,0868 | |||
| LAB / Standard BioTools Inc. | 0,43 | -18,71 | 0,52 | -9,71 | 0,0235 | -0,0306 | |||
| MATV / Mativ Holdings, Inc. | 0,07 | -53,23 | 0,49 | -48,81 | 0,0223 | -0,0682 | |||
| EHAB / Enhabit, Inc. | 0,05 | 0,00 | 0,48 | 9,79 | 0,0217 | -0,0195 | |||
| POWI / Power Integrations, Inc. | 0,01 | 50,00 | 0,42 | 66,27 | 0,0189 | -0,0048 | |||
| KLC / KinderCare Learning Companies, Inc. | 0,04 | -47,54 | 0,40 | -54,25 | 0,0182 | -0,0646 | |||
| UGI / UGI Corporation | 0,01 | 0,00 | 0,36 | 10,30 | 0,0164 | -0,0146 | |||
| KRP / Kimbell Royalty Partners, LP - Limited Partnership | 0,03 | 0,00 | 0,35 | -0,28 | 0,0160 | -0,0174 | |||
| CDNA / CareDx, Inc | 0,01 | 0,00 | 0,29 | 10,15 | 0,0132 | -0,0118 | |||
| YEXT / Yext, Inc. | 0,03 | -81,82 | 0,26 | -74,90 | 0,0115 | -0,0838 | |||
| FTRE / Fortrea Holdings Inc. | 0,04 | 0,00 | 0,19 | -34,74 | 0,0084 | -0,0183 | |||
| APLD / Applied Digital Corporation | 0,00 | -100,00 | 0,00 | 0,0000 | |||||
| MUR / Murphy Oil Corporation | 0,00 | -100,00 | 0,00 | 0,0000 | |||||
| LINE / Lineage, Inc. | 0,00 | -100,00 | 0,00 | 0,0000 | |||||
| LGTY / Logility Supply Chain Solutions, Inc. | 0,00 | -100,00 | 0,00 | 0,0000 | |||||
| BNT / Brookfield Wealth Solutions Ltd. | 0,00 | -100,00 | 0,00 | 0,0000 |