Statistiques de base
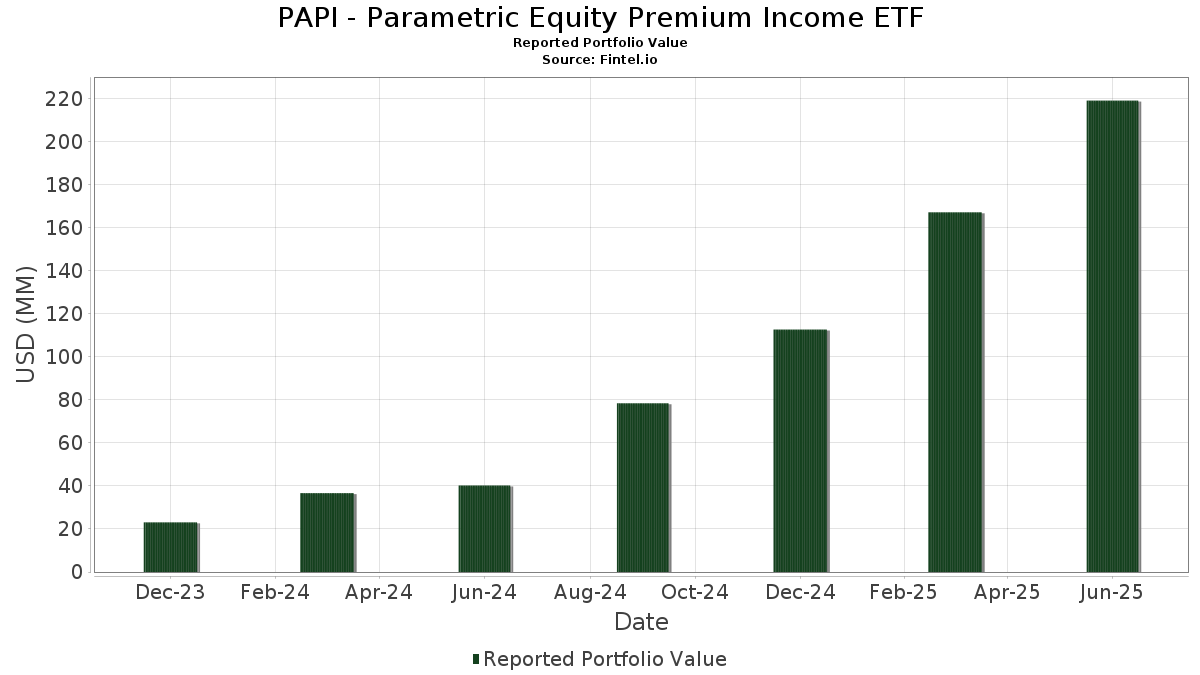
| Valeur du portefeuille | $ 219 258 426 |
| Positions actuelles | 194 |
Dernières positions, performances, ASG (à partir des dépôts 13F, 13D)
PAPI - Parametric Equity Premium Income ETF a déclaré un total de 194 positions dans ses derniers dépôts auprès de la SEC. La valeur la plus récente du portefeuille est calculée à 219 258 426 USD. Les actifs sous gestion réels (ASG) sont cette valeur plus les liquidités (qui ne sont pas divulguées). Les principales positions de PAPI - Parametric Equity Premium Income ETF sont Morgan Stanley Institutional Liquidity Funds Government Portfolio, Institutional Class (US:US61747C7074) , Cardinal Health, Inc. (US:CAH) , The Mosaic Company (US:MOS) , Whirlpool Corporation (US:WHR) , and Johnson Controls International plc (US:JCI) .
Meilleures augmentations ce trimestre
Nous utilisons la variation de l'allocation du portefeuille car il s'agit de l'indicateur le plus significatif. Les changements peuvent être dus à des transactions ou à des variations de prix des actions.
| Titre | Actions (en millions) |
Valeur ($ en millions) |
% du portefeuille | ΔPortefeuille % |
|---|---|---|---|---|
| 0,01 | 1,45 | 0,6632 | 0,3176 | |
| 0,07 | 1,38 | 0,6332 | 0,3124 | |
| 0,05 | 1,19 | 0,5458 | 0,2165 | |
| 0,02 | 1,25 | 0,5714 | 0,2051 | |
| 0,05 | 1,28 | 0,5835 | 0,2038 | |
| 0,03 | 1,30 | 0,5936 | 0,2008 | |
| 0,03 | 1,28 | 0,5846 | 0,1980 | |
| 0,04 | 1,47 | 0,6726 | 0,1780 | |
| 0,01 | 1,30 | 0,5966 | 0,1666 | |
| 0,00 | 1,30 | 0,5941 | 0,1649 |
Principales baisses ce trimestre
Nous utilisons la variation de l'allocation du portefeuille car il s'agit de l'indicateur le plus significatif. Les changements peuvent être dus à des transactions ou à des variations de prix des actions.
| Titre | Actions (en millions) |
Valeur ($ en millions) |
% du portefeuille | ΔPortefeuille % |
|---|---|---|---|---|
| 1,62 | 1,62 | 0,7408 | -1,3557 | |
| -1,05 | -0,4779 | -0,4779 | ||
| -0,89 | -0,4063 | -0,4063 | ||
| 0,00 | 1,10 | 0,5012 | -0,2298 | |
| 0,01 | 1,06 | 0,4870 | -0,1376 | |
| 0,03 | 0,85 | 0,3910 | -0,1346 | |
| 0,01 | 1,15 | 0,5248 | -0,1334 | |
| 0,02 | 0,97 | 0,4430 | -0,1314 | |
| 0,04 | 1,19 | 0,5436 | -0,1308 | |
| -0,28 | -0,1281 | -0,1281 |
Déclarations 13F et dépôts de fonds
Ce formulaire a été déposé le 2025-08-22 pour la période de déclaration 2025-06-30. Cliquez sur l'icône du lien pour voir l'historique complet des transactions.
Mettre à niveau pour débloquer les données premium et exporter vers Excel ![]() .
.
| Titre | Type | Prix moyen de l'action | Actions (en millions) |
ΔActions (%) |
ΔActions (%) |
Valeur ($ en millions) |
Portefeuille (%) |
ΔPortefeuille (%) |
|
|---|---|---|---|---|---|---|---|---|---|
| US61747C7074 / Morgan Stanley Institutional Liquidity Funds Government Portfolio, Institutional Class | 1,62 | -53,67 | 1,62 | -53,66 | 0,7408 | -1,3557 | |||
| CAH / Cardinal Health, Inc. | 0,01 | 15,65 | 1,52 | 41,00 | 0,6955 | 0,0489 | |||
| MOS / The Mosaic Company | 0,04 | 32,01 | 1,47 | 78,40 | 0,6726 | 0,1780 | |||
| WHR / Whirlpool Corporation | 0,01 | 123,63 | 1,45 | 151,74 | 0,6632 | 0,3176 | |||
| JCI / Johnson Controls International plc | 0,01 | 29,01 | 1,43 | 70,12 | 0,6538 | 0,1498 | |||
| PM / Philip Morris International Inc. | 0,01 | 14,59 | 1,43 | 31,52 | 0,6526 | 0,0019 | |||
| CVI / CVR Energy, Inc. | 0,05 | 23,62 | 1,39 | 71,20 | 0,6334 | 0,1480 | |||
| HPE / Hewlett Packard Enterprise Company | 0,07 | 95,28 | 1,38 | 158,69 | 0,6332 | 0,3124 | |||
| IBM / International Business Machines Corporation | 0,00 | 21,92 | 1,35 | 44,50 | 0,6194 | 0,0575 | |||
| NFG / National Fuel Gas Company | 0,02 | 11,96 | 1,35 | 19,75 | 0,6157 | -0,0583 | |||
| US4039491000 / HF Sinclair Corp. | 0,03 | 30,70 | 1,34 | 63,38 | 0,6143 | 0,1211 | |||
| CTVA / Corteva, Inc. | 0,02 | 21,23 | 1,33 | 43,63 | 0,6086 | 0,0528 | |||
| TXN / Texas Instruments Incorporated | 0,01 | 45,60 | 1,33 | 68,27 | 0,6066 | 0,1338 | |||
| HAS / Hasbro, Inc. | 0,02 | 18,31 | 1,32 | 42,09 | 0,6039 | 0,0464 | |||
| EMR / Emerson Electric Co. | 0,01 | 49,59 | 1,30 | 81,87 | 0,5966 | 0,1666 | |||
| MSFT / Microsoft Corporation | 0,00 | 36,97 | 1,30 | 81,68 | 0,5941 | 0,1649 | |||
| FMC / FMC Corporation | 0,03 | 100,25 | 1,30 | 98,17 | 0,5936 | 0,2008 | |||
| RTX / RTX Corporation | 0,01 | 27,85 | 1,30 | 41,02 | 0,5929 | 0,0413 | |||
| GLW / Corning Incorporated | 0,02 | 55,29 | 1,28 | 78,58 | 0,5872 | 0,1556 | |||
| CSCO / Cisco Systems, Inc. | 0,02 | 18,06 | 1,28 | 32,71 | 0,5865 | 0,0072 | |||
| PII / Polaris Inc. | 0,03 | 99,69 | 1,28 | 98,45 | 0,5846 | 0,1980 | |||
| NE / Noble Corporation plc | 0,05 | 79,86 | 1,28 | 101,42 | 0,5835 | 0,2038 | |||
| ADI / Analog Devices, Inc. | 0,01 | 37,55 | 1,27 | 62,40 | 0,5809 | 0,1118 | |||
| RF / Regions Financial Corporation | 0,05 | 48,23 | 1,27 | 60,43 | 0,5807 | 0,1061 | |||
| SNX / TD SYNNEX Corporation | 0,01 | 35,56 | 1,27 | 77,06 | 0,5793 | 0,1501 | |||
| GILD / Gilead Sciences, Inc. | 0,01 | 10,05 | 1,26 | 8,90 | 0,5762 | -0,1176 | |||
| LHX / L3Harris Technologies, Inc. | 0,01 | 30,02 | 1,26 | 55,76 | 0,5753 | 0,0912 | |||
| DRI / Darden Restaurants, Inc. | 0,01 | 12,25 | 1,25 | 17,75 | 0,5737 | -0,0650 | |||
| FOXA / Fox Corporation | 0,02 | 14,35 | 1,25 | 13,24 | 0,5714 | -0,0903 | |||
| SWKS / Skyworks Solutions, Inc. | 0,02 | 77,40 | 1,25 | 104,75 | 0,5714 | 0,2051 | |||
| MSM / MSC Industrial Direct Co., Inc. | 0,01 | 37,43 | 1,25 | 50,42 | 0,5703 | 0,0732 | |||
| WMB / The Williams Companies, Inc. | 0,02 | 19,93 | 1,25 | 26,11 | 0,5699 | -0,0229 | |||
| RPRX / Royalty Pharma plc | 0,03 | 5,71 | 1,24 | 22,36 | 0,5683 | -0,0407 | |||
| CME / CME Group Inc. | 0,00 | 15,45 | 1,24 | 19,94 | 0,5669 | -0,0528 | |||
| GRMN / Garmin Ltd. | 0,01 | 42,76 | 1,24 | 37,29 | 0,5659 | 0,0252 | |||
| FOX / Fox Corporation | 0,02 | 11,20 | 1,23 | 8,94 | 0,5630 | -0,1147 | |||
| KMI / Kinder Morgan, Inc. | 0,04 | 24,74 | 1,23 | 28,63 | 0,5630 | -0,0112 | |||
| FAST / Fastenal Company | 0,03 | 175,55 | 1,22 | 49,21 | 0,5590 | 0,0679 | |||
| JHG / Janus Henderson Group plc | 0,03 | 59,35 | 1,22 | 71,25 | 0,5588 | 0,1309 | |||
| LH / Labcorp Holdings Inc. | 0,00 | 14,95 | 1,22 | 29,76 | 0,5584 | -0,0063 | |||
| ADM / Archer-Daniels-Midland Company | 0,02 | 37,42 | 1,22 | 50,99 | 0,5582 | 0,0738 | |||
| CTRA / Coterra Energy Inc. | 0,05 | 42,96 | 1,22 | 25,54 | 0,5576 | -0,0247 | |||
| MTG / MGIC Investment Corporation | 0,04 | 29,33 | 1,22 | 45,28 | 0,5564 | 0,0543 | |||
| BMI / Badger Meter, Inc. | 0,00 | 23,19 | 1,22 | 58,62 | 0,5558 | 0,0963 | |||
| NEM / Newmont Corporation | 0,02 | 0,08 | 1,21 | 20,70 | 0,5550 | -0,0476 | |||
| COR / Cencora, Inc. | 0,00 | 7,85 | 1,21 | 16,33 | 0,5538 | -0,0706 | |||
| RGLD / Royal Gold, Inc. | 0,01 | 8,62 | 1,21 | 18,16 | 0,5537 | -0,0608 | |||
| IDCC / InterDigital, Inc. | 0,01 | 13,41 | 1,21 | 22,99 | 0,5533 | -0,0365 | |||
| RS / Reliance, Inc. | 0,00 | 26,80 | 1,21 | 37,90 | 0,5528 | 0,0270 | |||
| QCOM / QUALCOMM Incorporated | 0,01 | 51,84 | 1,21 | 57,50 | 0,5527 | 0,0924 | |||
| VLO / Valero Energy Corporation | 0,01 | 45,55 | 1,20 | 48,09 | 0,5509 | 0,0633 | |||
| AM / Antero Midstream Corporation | 0,06 | 5,60 | 1,20 | 11,17 | 0,5508 | -0,0988 | |||
| CALM / Cal-Maine Foods, Inc. | 0,01 | 59,81 | 1,20 | 75,36 | 0,5501 | 0,1383 | |||
| PAG / Penske Automotive Group, Inc. | 0,01 | 18,92 | 1,20 | 41,96 | 0,5496 | 0,0418 | |||
| DTM / DT Midstream, Inc. | 0,01 | 43,17 | 1,20 | 63,18 | 0,5493 | 0,1077 | |||
| MTN / Vail Resorts, Inc. | 0,01 | 46,68 | 1,20 | 43,99 | 0,5482 | 0,0492 | |||
| PFE / Pfizer Inc. | 0,05 | 50,95 | 1,20 | 44,39 | 0,5478 | 0,0504 | |||
| NYT / The New York Times Company | 0,02 | 30,06 | 1,19 | 46,86 | 0,5460 | 0,0583 | |||
| SHOO / Steven Madden, Ltd. | 0,05 | 141,45 | 1,19 | 117,30 | 0,5458 | 0,2165 | |||
| CHD / Church & Dwight Co., Inc. | 0,01 | 42,96 | 1,19 | 24,82 | 0,5454 | -0,0276 | |||
| EA / Electronic Arts Inc. | 0,01 | 19,95 | 1,19 | 32,52 | 0,5445 | 0,0059 | |||
| T / AT&T Inc. | 0,04 | 3,28 | 1,19 | 5,69 | 0,5436 | -0,1308 | |||
| TXRH / Texas Roadhouse, Inc. | 0,01 | 53,12 | 1,19 | 72,28 | 0,5430 | 0,1296 | |||
| SYK / Stryker Corporation | 0,00 | 23,80 | 1,19 | 31,60 | 0,5429 | 0,0019 | |||
| EOG / EOG Resources, Inc. | 0,01 | 56,25 | 1,18 | 45,81 | 0,5417 | 0,0543 | |||
| EVRG / Evergy, Inc. | 0,02 | 19,19 | 1,18 | 19,13 | 0,5412 | -0,0543 | |||
| PSX / Phillips 66 | 0,01 | 75,00 | 1,18 | 69,24 | 0,5411 | 0,1215 | |||
| POWI / Power Integrations, Inc. | 0,02 | 47,23 | 1,18 | 63,12 | 0,5402 | 0,1056 | |||
| GD / General Dynamics Corporation | 0,00 | 28,18 | 1,18 | 37,25 | 0,5394 | 0,0237 | |||
| CMI / Cummins Inc. | 0,00 | 50,97 | 1,18 | 57,85 | 0,5381 | 0,0908 | |||
| PEG / Public Service Enterprise Group Incorporated | 0,01 | 43,50 | 1,17 | 46,75 | 0,5372 | 0,0573 | |||
| LIN / Linde plc | 0,00 | 29,80 | 1,17 | 30,80 | 0,5364 | -0,0013 | |||
| CMCSA / Comcast Corporation | 0,03 | 42,90 | 1,17 | 38,18 | 0,5347 | 0,0275 | |||
| ABT / Abbott Laboratories | 0,01 | 11,38 | 1,17 | 14,17 | 0,5344 | -0,0791 | |||
| IP / International Paper Company | 0,02 | 68,19 | 1,16 | 47,72 | 0,5325 | 0,0596 | |||
| SO / The Southern Company | 0,01 | 32,75 | 1,16 | 32,65 | 0,5315 | 0,0058 | |||
| MDT / Medtronic plc | 0,01 | 37,28 | 1,16 | 33,14 | 0,5312 | 0,0082 | |||
| DGX / Quest Diagnostics Incorporated | 0,01 | 13,48 | 1,16 | 20,46 | 0,5306 | -0,0469 | |||
| ORI / Old Republic International Corporation | 0,03 | 30,62 | 1,16 | 28,07 | 0,5302 | -0,0128 | |||
| AVT / Avnet, Inc. | 0,02 | 32,11 | 1,16 | 45,84 | 0,5298 | 0,0534 | |||
| UPS / United Parcel Service, Inc. | 0,01 | 69,07 | 1,16 | 55,23 | 0,5297 | 0,0821 | |||
| CHRD / Chord Energy Corporation | 0,01 | 72,13 | 1,16 | 47,89 | 0,5296 | 0,0601 | |||
| BKR / Baker Hughes Company | 0,03 | 51,32 | 1,16 | 32,11 | 0,5288 | 0,0036 | |||
| WMT / Walmart Inc. | 0,01 | 27,35 | 1,16 | 41,89 | 0,5286 | 0,0400 | |||
| LEA / Lear Corporation | 0,01 | 15,74 | 1,15 | 24,65 | 0,5275 | -0,0275 | |||
| PRU / Prudential Financial, Inc. | 0,01 | 49,48 | 1,15 | 43,77 | 0,5275 | 0,0466 | |||
| CINF / Cincinnati Financial Corporation | 0,01 | 26,26 | 1,15 | 27,29 | 0,5272 | -0,0159 | |||
| EXPD / Expeditors International of Washington, Inc. | 0,01 | 29,20 | 1,15 | 22,81 | 0,5269 | -0,0359 | |||
| ADP / Automatic Data Processing, Inc. | 0,00 | 22,96 | 1,15 | 24,08 | 0,5258 | -0,0297 | |||
| IDA / IDACORP, Inc. | 0,01 | 18,00 | 1,15 | 17,24 | 0,5257 | -0,0623 | |||
| DHR / Danaher Corporation | 0,01 | 66,18 | 1,15 | 60,11 | 0,5251 | 0,0952 | |||
| ASH / Ashland Inc. | 0,02 | 81,68 | 1,15 | 54,09 | 0,5250 | 0,0782 | |||
| KO / The Coca-Cola Company | 0,02 | 13,62 | 1,15 | 12,23 | 0,5248 | -0,0883 | |||
| UNM / Unum Group | 0,01 | 5,45 | 1,15 | 4,56 | 0,5248 | -0,1334 | |||
| MRK / Merck & Co., Inc. | 0,01 | 75,12 | 1,15 | 54,58 | 0,5246 | 0,0792 | |||
| TROW / T. Rowe Price Group, Inc. | 0,01 | 58,84 | 1,15 | 66,81 | 0,5242 | 0,1123 | |||
| HII / Huntington Ingalls Industries, Inc. | 0,00 | 14,41 | 1,15 | 35,46 | 0,5242 | 0,0166 | |||
| OGE / OGE Energy Corp. | 0,03 | 19,70 | 1,14 | 15,57 | 0,5230 | -0,0702 | |||
| PPG / PPG Industries, Inc. | 0,01 | 45,23 | 1,14 | 51,19 | 0,5229 | 0,0691 | |||
| PKG / Packaging Corporation of America | 0,01 | 60,53 | 1,14 | 52,67 | 0,5227 | 0,0741 | |||
| APD / Air Products and Chemicals, Inc. | 0,00 | 51,72 | 1,14 | 45,11 | 0,5225 | 0,0504 | |||
| CH1300646267 / Bunge Global SA | 0,01 | 25,20 | 1,14 | 31,57 | 0,5224 | 0,0016 | |||
| EG0 / Essent Group Ltd. | 0,02 | 29,99 | 1,14 | 36,77 | 0,5224 | 0,0216 | |||
| AFG / American Financial Group, Inc. | 0,01 | 42,77 | 1,14 | 37,26 | 0,5223 | 0,0232 | |||
| DOX / Amdocs Limited | 0,01 | 25,40 | 1,14 | 25,00 | 0,5216 | -0,0253 | |||
| HRL / Hormel Foods Corporation | 0,04 | 29,27 | 1,14 | 26,39 | 0,5214 | -0,0195 | |||
| JKHY / Jack Henry & Associates, Inc. | 0,01 | 28,83 | 1,14 | 27,23 | 0,5214 | -0,0164 | |||
| ROP / Roper Technologies, Inc. | 0,00 | 22,70 | 1,14 | 17,91 | 0,5213 | -0,0581 | |||
| CVX / Chevron Corporation | 0,01 | 42,30 | 1,14 | 21,84 | 0,5208 | -0,0398 | |||
| HIG / The Hartford Insurance Group, Inc. | 0,01 | 27,18 | 1,14 | 30,39 | 0,5204 | -0,0028 | |||
| TRV / The Travelers Companies, Inc. | 0,00 | 21,49 | 1,14 | 22,92 | 0,5201 | -0,0347 | |||
| GPC / Genuine Parts Company | 0,01 | 24,85 | 1,14 | 27,18 | 0,5201 | -0,0163 | |||
| DCI / Donaldson Company, Inc. | 0,02 | 37,41 | 1,14 | 42,13 | 0,5201 | 0,0402 | |||
| GGG / Graco Inc. | 0,01 | 23,18 | 1,14 | 26,82 | 0,5194 | -0,0176 | |||
| VZ / Verizon Communications Inc. | 0,03 | 15,75 | 1,14 | 10,41 | 0,5191 | -0,0973 | |||
| CI / The Cigna Group | 0,00 | 32,43 | 1,14 | 33,06 | 0,5191 | 0,0076 | |||
| BDX / Becton, Dickinson and Company | 0,01 | 80,19 | 1,13 | 35,48 | 0,5188 | 0,0168 | |||
| CFR / Cullen/Frost Bankers, Inc. | 0,01 | 45,47 | 1,13 | 49,28 | 0,5185 | 0,0633 | |||
| AEP / American Electric Power Company, Inc. | 0,01 | 25,73 | 1,13 | 19,39 | 0,5183 | -0,0509 | |||
| COST / Costco Wholesale Corporation | 0,00 | 24,62 | 1,13 | 30,41 | 0,5179 | -0,0027 | |||
| INGR / Ingredion Incorporated | 0,01 | 31,93 | 1,13 | 32,32 | 0,5172 | 0,0047 | |||
| DD / DuPont de Nemours, Inc. | 0,02 | 47,07 | 1,13 | 35,17 | 0,5169 | 0,0152 | |||
| D / Dominion Energy, Inc. | 0,02 | 19,57 | 1,13 | 20,51 | 0,5162 | -0,0453 | |||
| AEE / Ameren Corporation | 0,01 | 18,05 | 1,13 | 12,91 | 0,5160 | -0,0831 | |||
| MO / Altria Group, Inc. | 0,02 | 14,60 | 1,13 | 11,92 | 0,5158 | -0,0883 | |||
| DUK / Duke Energy Corporation | 0,01 | 29,61 | 1,12 | 25,39 | 0,5131 | -0,0234 | |||
| ATR / AptarGroup, Inc. | 0,01 | 43,02 | 1,12 | 50,87 | 0,5130 | 0,0669 | |||
| LEN / Lennar Corporation | 0,01 | 53,85 | 1,12 | 48,28 | 0,5129 | 0,0593 | |||
| LNT / Alliant Energy Corporation | 0,02 | 31,23 | 1,12 | 23,24 | 0,5121 | -0,0324 | |||
| LYB / LyondellBasell Industries N.V. | 0,02 | 68,57 | 1,12 | 38,66 | 0,5117 | 0,0274 | |||
| SRE / Sempra | 0,01 | 42,97 | 1,12 | 51,77 | 0,5111 | 0,0697 | |||
| MAN / ManpowerGroup Inc. | 0,03 | 88,07 | 1,12 | 31,29 | 0,5105 | 0,0006 | |||
| PB / Prosperity Bancshares, Inc. | 0,02 | 42,82 | 1,12 | 40,61 | 0,5103 | 0,0343 | |||
| COP / ConocoPhillips | 0,01 | 59,67 | 1,12 | 36,47 | 0,5101 | 0,0199 | |||
| BBY / Best Buy Co., Inc. | 0,02 | 65,26 | 1,12 | 50,88 | 0,5100 | 0,0663 | |||
| PEP / PepsiCo, Inc. | 0,01 | 46,54 | 1,11 | 29,08 | 0,5097 | -0,0082 | |||
| PG / The Procter & Gamble Company | 0,01 | 31,78 | 1,11 | 23,31 | 0,5081 | -0,0326 | |||
| AMCR / Amcor plc | 0,12 | 32,78 | 1,11 | 25,88 | 0,5073 | -0,0214 | |||
| PFG / Principal Financial Group, Inc. | 0,01 | 34,83 | 1,11 | 26,92 | 0,5069 | -0,0167 | |||
| WEC / WEC Energy Group, Inc. | 0,01 | 19,14 | 1,11 | 13,90 | 0,5060 | -0,0764 | |||
| XOM / Exxon Mobil Corporation | 0,01 | 28,74 | 1,11 | 16,68 | 0,5055 | -0,0625 | |||
| ABBV / AbbVie Inc. | 0,01 | 28,76 | 1,11 | 14,04 | 0,5055 | -0,0755 | |||
| TJX / The TJX Companies, Inc. | 0,01 | 18,56 | 1,10 | 20,15 | 0,5046 | -0,0458 | |||
| XEL / Xcel Energy Inc. | 0,02 | 17,62 | 1,10 | 13,13 | 0,5046 | -0,0801 | |||
| ATO / Atmos Energy Corporation | 0,01 | 17,40 | 1,10 | 17,13 | 0,5036 | -0,0606 | |||
| PAYX / Paychex, Inc. | 0,01 | 21,99 | 1,10 | 14,99 | 0,5019 | -0,0703 | |||
| ELV / Elevance Health, Inc. | 0,00 | 0,54 | 1,10 | -10,09 | 0,5012 | -0,2298 | |||
| KDP / Keurig Dr Pepper Inc. | 0,03 | 18,15 | 1,10 | 14,18 | 0,5011 | -0,0745 | |||
| AFL / Aflac Incorporated | 0,01 | 30,68 | 1,10 | 24,01 | 0,5008 | -0,0290 | |||
| SON / Sonoco Products Company | 0,03 | 42,92 | 1,09 | 31,72 | 0,4997 | 0,0025 | |||
| OKE / ONEOK, Inc. | 0,01 | 67,46 | 1,09 | 37,75 | 0,4991 | 0,0241 | |||
| PPL / PPL Corporation | 0,03 | 19,41 | 1,09 | 12,13 | 0,4991 | -0,0848 | |||
| GNTX / Gentex Corporation | 0,05 | 56,60 | 1,09 | 47,76 | 0,4983 | 0,0562 | |||
| JNJ / Johnson & Johnson | 0,01 | 20,37 | 1,09 | 10,90 | 0,4982 | -0,0910 | |||
| IPG / The Interpublic Group of Companies, Inc. | 0,04 | 42,98 | 1,09 | 28,91 | 0,4977 | -0,0087 | |||
| PINC / Premier, Inc. | 0,05 | 28,88 | 1,09 | 46,69 | 0,4973 | 0,0525 | |||
| CCOI / Cogent Communications Holdings, Inc. | 0,02 | 97,10 | 1,08 | 55,08 | 0,4960 | 0,0764 | |||
| CTSH / Cognizant Technology Solutions Corporation | 0,01 | 18,41 | 1,08 | 20,71 | 0,4960 | -0,0424 | |||
| DLB / Dolby Laboratories, Inc. | 0,01 | 23,20 | 1,08 | 13,99 | 0,4959 | -0,0748 | |||
| SNA / Snap-on Incorporated | 0,00 | 33,30 | 1,08 | 23,07 | 0,4956 | -0,0324 | |||
| DVN / Devon Energy Corporation | 0,03 | 39,34 | 1,08 | 18,50 | 0,4924 | -0,0523 | |||
| ACN / Accenture plc | 0,00 | 47,75 | 1,07 | 41,59 | 0,4889 | 0,0360 | |||
| KMB / Kimberly-Clark Corporation | 0,01 | 20,66 | 1,07 | 9,44 | 0,4880 | -0,0970 | |||
| OGS / ONE Gas, Inc. | 0,01 | 25,27 | 1,07 | 19,11 | 0,4879 | -0,0493 | |||
| FNF / Fidelity National Financial, Inc. | 0,02 | 32,82 | 1,07 | 14,38 | 0,4877 | -0,0712 | |||
| INSW / International Seaways, Inc. | 0,03 | 27,34 | 1,07 | 39,95 | 0,4874 | 0,0307 | |||
| ED / Consolidated Edison, Inc. | 0,01 | 12,65 | 1,06 | 2,21 | 0,4870 | -0,1376 | |||
| EMN / Eastman Chemical Company | 0,01 | 51,42 | 1,06 | 28,33 | 0,4848 | -0,0106 | |||
| HPQ / HP Inc. | 0,04 | 70,33 | 1,06 | 50,57 | 0,4835 | 0,0622 | |||
| AOS / A. O. Smith Corporation | 0,02 | 29,19 | 1,06 | 29,57 | 0,4833 | -0,0056 | |||
| POR / Portland General Electric Company | 0,03 | 25,64 | 1,05 | 14,57 | 0,4820 | -0,0701 | |||
| OMC / Omnicom Group Inc. | 0,01 | 51,86 | 1,05 | 31,83 | 0,4813 | 0,0024 | |||
| WEN / The Wendy's Company | 0,09 | 52,50 | 1,05 | 18,98 | 0,4791 | -0,0486 | |||
| FE / FirstEnergy Corp. | 0,03 | 29,44 | 1,04 | 28,96 | 0,4769 | -0,0081 | |||
| DOW / Dow Inc. | 0,04 | 86,26 | 1,03 | 41,27 | 0,4697 | 0,0337 | |||
| FLO / Flowers Foods, Inc. | 0,06 | 49,63 | 1,02 | 25,86 | 0,4674 | -0,0198 | |||
| WSO / Watsco, Inc. | 0,00 | 31,40 | 1,02 | 14,13 | 0,4657 | -0,0692 | |||
| COLM / Columbia Sportswear Company | 0,02 | 59,98 | 1,02 | 29,06 | 0,4652 | -0,0073 | |||
| LKQ / LKQ Corporation | 0,03 | 21,88 | 1,02 | 6,05 | 0,4647 | -0,1099 | |||
| KHC / The Kraft Heinz Company | 0,04 | 33,73 | 1,01 | 13,45 | 0,4632 | -0,0720 | |||
| CRI / Carter's, Inc. | 0,03 | 109,83 | 1,01 | 54,75 | 0,4615 | 0,0700 | |||
| RHI / Robert Half Inc. | 0,02 | 106,11 | 1,01 | 55,08 | 0,4610 | 0,0713 | |||
| HUN / Huntsman Corporation | 0,09 | 94,81 | 0,99 | 28,61 | 0,4523 | -0,0090 | |||
| CAG / Conagra Brands, Inc. | 0,05 | 42,97 | 0,98 | 9,70 | 0,4503 | -0,0877 | |||
| TAP / Molson Coors Beverage Company | 0,02 | 27,99 | 0,97 | 1,04 | 0,4430 | -0,1314 | |||
| WU / The Western Union Company | 0,11 | 37,29 | 0,96 | 9,34 | 0,4391 | -0,0878 | |||
| HP / Helmerich & Payne, Inc. | 0,06 | 150,61 | 0,95 | 45,40 | 0,4338 | 0,0428 | |||
| CHE / Chemed Corporation | 0,00 | 27,95 | 0,94 | 1,30 | 0,4291 | -0,1265 | |||
| UNH / UnitedHealth Group Incorporated | 0,00 | 81,01 | 0,90 | 7,88 | 0,4134 | -0,0893 | |||
| OXM / Oxford Industries, Inc. | 0,02 | 114,12 | 0,86 | 47,08 | 0,3916 | 0,0421 | |||
| BFB / Brown-Forman Corp. - Class B | 0,03 | 23,02 | 0,85 | -2,51 | 0,3910 | -0,1346 | |||
| SPDR S&P 500 ETF Trust / DE (N/A) | -0,28 | -0,1281 | -0,1281 | ||||||
| SPDR S&P 500 ETF Trust / DE (N/A) | -0,89 | -0,4063 | -0,4063 | ||||||
| SPDR S&P 500 ETF Trust / DE (N/A) | -1,05 | -0,4779 | -0,4779 |