Statistiques de base
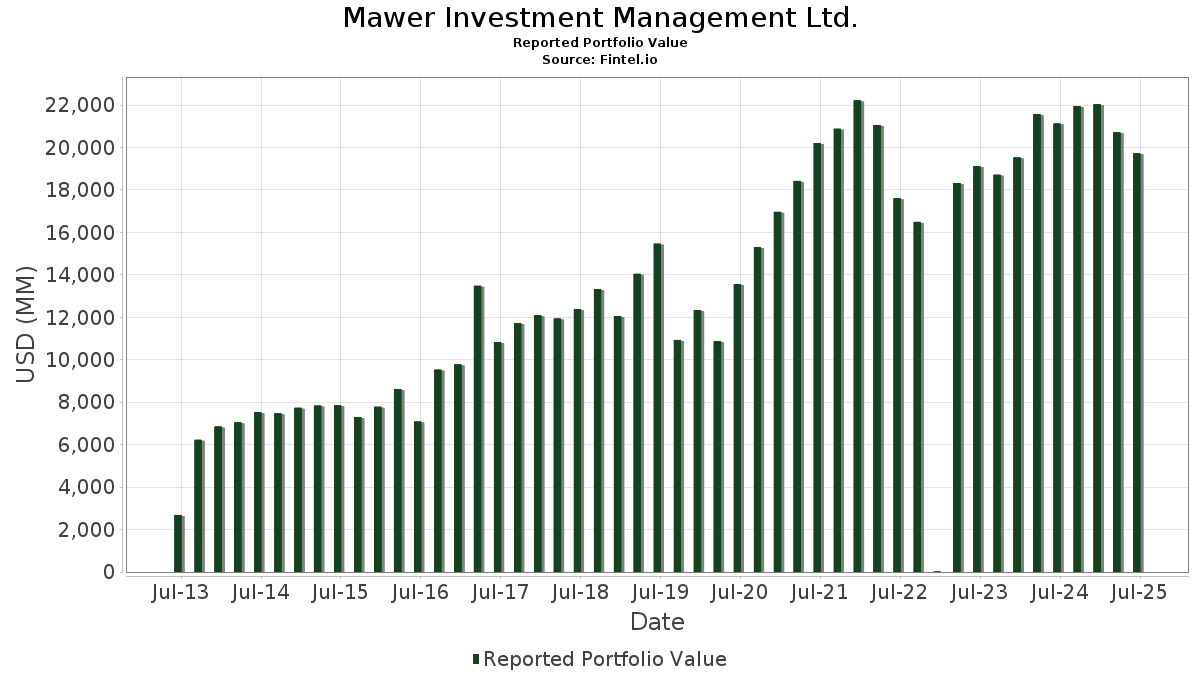
| Valeur du portefeuille | $ 19 720 245 014 |
| Positions actuelles | 110 |
Dernières positions, performances, ASG (à partir des dépôts 13F, 13D)
Mawer Investment Management Ltd. a déclaré un total de 110 positions dans ses derniers dépôts auprès de la SEC. La valeur la plus récente du portefeuille est calculée à 19 720 245 014 USD. Les actifs sous gestion réels (ASG) sont cette valeur plus les liquidités (qui ne sont pas divulguées). Les principales positions de Mawer Investment Management Ltd. sont Microsoft Corporation (US:MSFT) , Marsh & McLennan Companies, Inc. (US:MMC) , Aon plc (US:AON) , Alphabet Inc. (US:GOOG) , and Booking Holdings Inc. (US:BKNG) . Les nouvelles positions de Mawer Investment Management Ltd. incluent Northrop Grumman Corporation (US:NOC) , AerCap Holdings N.V. (US:AER) , Elevance Health, Inc. (US:ELV) , Sprott Inc. (US:SII) , and Zoetis Inc. (US:ZTS) . Les principales industries de Mawer Investment Management Ltd. sont "Printing, Publishing, And Allied Industries" (sic 27) , "Miscellaneous Retail " (sic 59) , and "Apparel And Accessory Stores" (sic 56) .
Meilleures augmentations ce trimestre
Nous utilisons la variation de l'allocation du portefeuille car il s'agit de l'indicateur le plus significatif. Les changements peuvent être dus à des transactions ou à des variations de prix des actions.
| Titre | Actions (en millions) |
Valeur ($ en millions) |
% du portefeuille | ΔPortefeuille % |
|---|---|---|---|---|
| 0,74 | 543,16 | 2,7522 | 2,7522 | |
| 0,98 | 491,98 | 2,4948 | 2,4948 | |
| 2,87 | 1 428,97 | 7,2462 | 1,6938 | |
| 1,24 | 360,06 | 1,8258 | 1,3141 | |
| 1,55 | 181,38 | 0,9197 | 0,9197 | |
| 7,43 | 733,53 | 3,7197 | 0,9116 | |
| 0,16 | 919,34 | 4,6619 | 0,8969 | |
| 3,97 | 870,93 | 4,4130 | 0,8023 | |
| 0,00 | 591,06 | 2,9949 | 0,3577 | |
| 2,68 | 101,45 | 0,5144 | 0,3086 |
Principales baisses ce trimestre
Nous utilisons la variation de l'allocation du portefeuille car il s'agit de l'indicateur le plus significatif. Les changements peuvent être dus à des transactions ou à des variations de prix des actions.
| Titre | Actions (en millions) |
Valeur ($ en millions) |
% du portefeuille | ΔPortefeuille % |
|---|---|---|---|---|
| 1,06 | 330,49 | 1,6746 | -3,5705 | |
| 3,94 | 161,83 | 0,8200 | -1,2360 | |
| 5,37 | 1 175,16 | 5,9592 | -1,0782 | |
| 0,10 | 31,64 | 0,1604 | -0,9771 | |
| 2,97 | 1 060,12 | 5,3758 | -0,9328 | |
| 4,84 | 290,99 | 1,4745 | -0,7241 | |
| 0,82 | 270,93 | 1,3739 | -0,3660 | |
| 0,89 | 162,51 | 0,8241 | -0,3129 | |
| 0,27 | 38,69 | 0,1960 | -0,2907 | |
| 2,11 | 750,54 | 3,8030 | -0,2823 |
Déclarations 13D/G
Il s'agit d'une liste des déclarations 13D et 13G déposées au cours de la dernière année (le cas échéant). Cliquez sur l'icône du lien pour voir l'historique complet des transactions. Les lignes vertes indiquent de nouvelles positions. Les lignes rouges indiquent des positions fermées.
| Date de dépôt | Formulaire | Titre | Actions précédentes |
Actions actuelles |
ΔActions % | % de participation |
% ΔParticipation | |
|---|---|---|---|---|---|---|---|---|
| 2025-09-04 | NSP / Insperity, Inc. | 5 190 036 | 2 726 579 | -47,47 | 7,24 | -47,65 | ||
| 2025-08-07 | XP / XP Inc. | 24 589 426 | 0 | -100,00 | 0,00 | -100,00 | ||
| 2025-08-07 | RHI / Robert Half Inc. | 8 079 597 | 3 942 158 | -51,21 | 3,86 | -50,70 | ||
| 2025-06-06 | SANG / Sangoma Technologies Corporation | 3 125 660 | 3 490 247 | 11,66 | 10,42 | 12,04 | ||
| 2025-05-09 | DFIN / Donnelley Financial Solutions, Inc. | 2 021 103 | 1 332 775 | -34,06 | 4,67 | -32,90 | ||
| 2025-05-09 | ESQ / Esquire Financial Holdings, Inc. | 420 212 | 779 889 | 85,59 | 9,25 | 83,17 | ||
| 2025-05-09 | TNET / TriNet Group, Inc. | 3 653 597 | 3 004 110 | -17,78 | 6,21 | -15,63 | ||
| 2025-05-09 | NOA / North American Construction Group Ltd. | 3 106 914 | 2 678 487 | -13,79 | 8,72 | -21,86 | ||
| 2025-02-12 | BBSI / Barrett Business Services, Inc. | 1 834 452 | 2 110 550 | 15,05 | 8,14 | 15,95 | ||
| 2024-11-12 | TIXT / TELUS International (Cda) Inc. | 6 449 296 | 0 | -100,00 | 0,00 | -100,00 | ||
| 2024-11-08 | BNT / Brookfield Wealth Solutions Ltd. | 1 317 978 | 3,04 | |||||
| 2024-11-08 | GIC / Global Industrial Company | 1 939 649 | 1 826 970 | -5,81 | 4,78 | -6,27 | ||
| 2024-11-08 | WINA / Winmark Corporation | 276 571 | 90 273 | -67,36 | 2,56 | -67,72 | ||
| 2024-11-08 | WMG / Warner Music Group Corp. | 8 217 467 | 5,80 |
Déclarations 13F et dépôts de fonds
Ce formulaire a été déposé le 2025-08-07 pour la période de déclaration 2025-06-30. Cliquez sur l'icône du lien pour voir l'historique complet des transactions.
Mettre à niveau pour débloquer les données premium et exporter vers Excel ![]() .
.
| Titre | Type | Prix moyen de l'action | Actions (en millions) |
ΔActions (%) |
ΔActions (%) |
Valeur ($ en millions) |
Portefeuille (%) |
ΔPortefeuille (%) |
|
|---|---|---|---|---|---|---|---|---|---|
| MSFT / Microsoft Corporation | 2,87 | -6,21 | 1 428,97 | 24,27 | 7,2462 | 1,6938 | |||
| MMC / Marsh & McLennan Companies, Inc. | 5,37 | -10,00 | 1 175,16 | -19,36 | 5,9592 | -1,0782 | |||
| AON / Aon plc | 2,97 | -9,23 | 1 060,12 | -18,85 | 5,3758 | -0,9328 | |||
| GOOG / Alphabet Inc. | 5,21 | -14,31 | 923,67 | -2,70 | 4,6839 | 0,0998 | |||
| BKNG / Booking Holdings Inc. | 0,16 | -6,17 | 919,34 | 17,91 | 4,6619 | 0,8969 | |||
| AMZN / Amazon.com, Inc. | 3,97 | 1,01 | 870,93 | 16,47 | 4,4130 | 0,8023 | |||
| V / Visa Inc. | 2,11 | -12,43 | 750,54 | -11,29 | 3,8030 | -0,2823 | |||
| APH / Amphenol Corporation | 7,43 | -16,22 | 733,53 | 26,14 | 3,7197 | 0,9116 | |||
| FCN / FTI Consulting, Inc. | 3,82 | -3,92 | 616,31 | -5,44 | 3,1229 | -0,0242 | |||
| BRK.A / Berkshire Hathaway Inc. | 0,00 | 18,57 | 591,06 | 8,23 | 2,9949 | 0,3577 | |||
| META / Meta Platforms, Inc. | 0,74 | 543,16 | 2,7522 | 2,7522 | |||||
| NOC / Northrop Grumman Corporation | 0,98 | 491,98 | 2,4948 | 2,4948 | |||||
| CDW / CDW Corporation | 2,64 | -6,60 | 471,90 | 4,09 | 2,3930 | 0,2037 | |||
| JPM / JPMorgan Chase & Co. | 1,24 | 187,50 | 360,06 | 239,78 | 1,8258 | 1,3141 | |||
| UNH / UnitedHealth Group Incorporated | 1,06 | -48,92 | 330,49 | -69,57 | 1,6746 | -3,5705 | |||
| SHEL / Shell plc - Depositary Receipt (Common Stock) | 4,59 | -6,88 | 323,22 | -10,53 | 1,6378 | -0,1066 | |||
| LULU / lululemon athletica inc. | 1,36 | 2,77 | 322,98 | -13,74 | 1,6365 | -0,1715 | |||
| NSP / Insperity, Inc. | 4,84 | -5,14 | 290,99 | -36,09 | 1,4745 | -0,7241 | |||
| DE / Deere & Company | 0,56 | -6,49 | 284,46 | 1,31 | 1,4414 | 0,0855 | |||
| CPAY / Corpay, Inc. | 0,82 | -20,98 | 270,93 | -24,81 | 1,3739 | -0,3660 | |||
| MEDP / Medpace Holdings, Inc. | 0,82 | 17,41 | 256,56 | 20,94 | 1,3010 | 0,2767 | |||
| ATR / AptarGroup, Inc. | 1,40 | 16,39 | 219,12 | 22,70 | 1,1111 | 0,2488 | |||
| AJG / Arthur J. Gallagher & Co. | 0,68 | -7,82 | 218,16 | -14,53 | 1,1063 | -0,1262 | |||
| TNET / TriNet Group, Inc. | 2,81 | -6,58 | 205,27 | -13,77 | 1,0401 | -0,1093 | |||
| FERG / Ferguson Enterprises Inc. | 0,93 | -6,86 | 202,14 | 26,58 | 1,0243 | 0,2531 | |||
| COR / Cencora, Inc. | 0,67 | -2,07 | 201,38 | 5,59 | 1,0204 | 0,0995 | |||
| WMG / Warner Music Group Corp. | 7,37 | -6,48 | 200,84 | -18,74 | 1,0177 | -0,1758 | |||
| CME / CME Group Inc. | 0,73 | -16,76 | 199,87 | -13,52 | 1,0128 | -0,1033 | |||
| TME / Tencent Music Entertainment Group - Depositary Receipt (Common Stock) | 10,15 | -7,63 | 197,74 | 24,93 | 1,0027 | 0,2384 | |||
| ACN / Accenture plc | 0,65 | -14,10 | 194,81 | -17,72 | 0,9879 | -0,1555 | |||
| VZ / Verizon Communications Inc. | 4,28 | -9,03 | 185,10 | -13,22 | 0,9379 | -0,0920 | |||
| AER / AerCap Holdings N.V. | 1,55 | 181,38 | 0,9197 | 0,9197 | |||||
| YUMC / Yum China Holdings, Inc. | 3,77 | -6,78 | 168,55 | -19,94 | 0,8541 | -0,1626 | |||
| WAT / Waters Corporation | 0,48 | -7,20 | 166,34 | -12,11 | 0,8428 | -0,0711 | |||
| ICE / Intercontinental Exchange, Inc. | 0,89 | -35,11 | 162,51 | -30,98 | 0,8241 | -0,3129 | |||
| RHI / Robert Half Inc. | 3,94 | -49,49 | 161,83 | -61,99 | 0,8200 | -1,2360 | |||
| ABT / Abbott Laboratories | 1,19 | -9,58 | 161,26 | -7,29 | 0,8171 | -0,0228 | |||
| MA / Mastercard Incorporated | 0,28 | -8,49 | 158,51 | -6,18 | 0,8038 | -0,0121 | |||
| PG / The Procter & Gamble Company | 0,99 | -9,29 | 158,18 | -15,19 | 0,8021 | -0,0985 | |||
| MLM / Martin Marietta Materials, Inc. | 0,29 | -1,30 | 157,40 | 13,32 | 0,7975 | 0,1268 | |||
| POOL / Pool Corporation | 0,50 | -5,98 | 145,26 | -13,91 | 0,7366 | -0,0782 | |||
| BWXT / BWX Technologies, Inc. | 0,90 | 15,60 | 129,72 | 68,81 | 0,6573 | 0,2862 | |||
| CACI / CACI International Inc | 0,27 | -7,34 | 127,02 | 20,38 | 0,6436 | 0,1341 | |||
| OSIS / OSI Systems, Inc. | 0,51 | 11,20 | 115,28 | 28,66 | 0,5841 | 0,1515 | |||
| AEP / American Electric Power Company, Inc. | 1,09 | -6,54 | 112,98 | -11,26 | 0,5729 | -0,0418 | |||
| VRSK / Verisk Analytics, Inc. | 0,36 | -13,61 | 110,67 | -9,59 | 0,5612 | -0,0299 | |||
| HDB / HDFC Bank Limited - Depositary Receipt (Common Stock) | 1,41 | 2,82 | 107,95 | 18,66 | 0,5474 | 0,1081 | |||
| VVV / Valvoline Inc. | 2,68 | 118,79 | 101,45 | 138,02 | 0,5144 | 0,3086 | |||
| SHW / The Sherwin-Williams Company | 0,27 | -9,77 | 93,83 | -11,28 | 0,4758 | -0,0349 | |||
| NKE / NIKE, Inc. | 1,21 | -12,32 | 85,92 | -1,88 | 0,4353 | 0,0125 | |||
| BBSI / Barrett Business Services, Inc. | 1,95 | -0,67 | 81,30 | 0,64 | 0,4123 | 0,0222 | |||
| DHR / Danaher Corporation | 0,40 | -7,76 | 79,19 | -11,12 | 0,4013 | -0,0290 | |||
| TXN / Texas Instruments Incorporated | 0,37 | 17,64 | 76,86 | 35,92 | 0,3894 | 0,1164 | |||
| SO / The Southern Company | 0,84 | -5,56 | 76,81 | -5,68 | 0,3892 | -0,0040 | |||
| BDX / Becton, Dickinson and Company | 0,44 | -0,33 | 76,16 | -25,05 | 0,3859 | -0,1048 | |||
| ESQ / Esquire Financial Holdings, Inc. | 0,78 | -0,51 | 73,44 | 24,93 | 0,3721 | 0,0883 | |||
| TW / Tradeweb Markets Inc. | 0,48 | -10,16 | 70,00 | -11,41 | 0,3547 | -0,0269 | |||
| SPGI / S&P Global Inc. | 0,13 | -11,65 | 69,68 | -8,31 | 0,3531 | -0,0139 | |||
| KSPI / Joint Stock Company Kaspi.kz - Depositary Receipt (Common Stock) | 0,81 | -6,37 | 68,38 | -14,40 | 0,3465 | -0,0392 | |||
| DFIN / Donnelley Financial Solutions, Inc. | 1,07 | -19,39 | 66,24 | 13,70 | 0,3356 | 0,0543 | |||
| BIO / Bio-Rad Laboratories, Inc. | 0,27 | -9,42 | 64,46 | -10,25 | 0,3266 | -0,0202 | |||
| JNJ / Johnson & Johnson | 0,41 | -17,81 | 62,60 | -24,30 | 0,3174 | -0,0818 | |||
| NTES / NetEase, Inc. - Depositary Receipt (Common Stock) | 0,46 | -30,70 | 62,38 | -9,38 | 0,3163 | -0,0161 | |||
| PAYX / Paychex, Inc. | 0,41 | -31,07 | 59,30 | -35,01 | 0,3007 | -0,1399 | |||
| AAON / AAON, Inc. | 0,79 | 39,67 | 58,30 | 31,83 | 0,2954 | 0,0819 | |||
| ELV / Elevance Health, Inc. | 0,14 | 53,89 | 0,2733 | 0,2733 | |||||
| ITT / ITT Inc. | 0,33 | -5,48 | 51,14 | 14,76 | 0,2593 | 0,0442 | |||
| SII / Sprott Inc. | 0,73 | 50,43 | 0,2557 | 0,2557 | |||||
| TSM / Taiwan Semiconductor Manufacturing Company Limited - Depositary Receipt (Common Stock) | 0,21 | 18,62 | 47,13 | 61,84 | 0,2388 | 0,0982 | |||
| ZTS / Zoetis Inc. | 0,29 | 45,78 | 0,2322 | 0,2322 | |||||
| CGNX / Cognex Corporation | 1,44 | 45,72 | 0,2319 | 0,2319 | |||||
| ABBV / AbbVie Inc. | 0,24 | -5,70 | 45,29 | -16,45 | 0,2295 | -0,0323 | |||
| ARM / Arm Holdings plc - Depositary Receipt (Common Stock) | 0,28 | 44,60 | 0,2262 | 0,2262 | |||||
| AME / AMETEK, Inc. | 0,24 | -30,04 | 42,97 | -26,46 | 0,2177 | -0,0644 | |||
| HSY / The Hershey Company | 0,26 | -5,30 | 42,42 | -8,11 | 0,2151 | -0,0078 | |||
| ICLR / ICON Public Limited Company | 0,27 | -53,83 | 38,69 | -61,62 | 0,1960 | -0,2907 | |||
| STT / State Street Corporation | 0,36 | -29,98 | 38,46 | -16,84 | 0,1949 | -0,0284 | |||
| MKC.V / McCormick & Company, Incorporated | 0,48 | -10,27 | 36,51 | -17,35 | 0,1850 | -0,0283 | |||
| RYAN / Ryan Specialty Holdings, Inc. | 0,50 | -2,78 | 33,79 | -10,52 | 0,1712 | -0,0111 | |||
| BWA / BorgWarner Inc. | 0,98 | -4,91 | 32,97 | 11,12 | 0,1672 | 0,0239 | |||
| SNA / Snap-on Incorporated | 0,10 | -85,46 | 31,64 | -86,57 | 0,1604 | -0,9771 | |||
| SN / SharkNinja, Inc. | 0,29 | -10,67 | 28,93 | 6,02 | 0,1466 | 0,0148 | |||
| BRK.B / Berkshire Hathaway Inc. | 0,06 | 8,37 | 27,99 | -1,15 | 0,1418 | 0,0051 | |||
| IBKR / Interactive Brokers Group, Inc. | 0,45 | 245,47 | 25,05 | 15,60 | 0,1269 | 0,0223 | |||
| CASH / Pathward Financial, Inc. | 0,25 | -11,35 | 20,18 | -3,85 | 0,1022 | 0,0009 | |||
| RMD / ResMed Inc. | 0,08 | -3,36 | 20,12 | 11,38 | 0,1019 | 0,0147 | |||
| LPLA / LPL Financial Holdings Inc. | 0,05 | -3,54 | 19,87 | 10,57 | 0,1007 | 0,0139 | |||
| KNSL / Kinsale Capital Group, Inc. | 0,04 | -3,36 | 17,27 | -3,92 | 0,0876 | 0,0008 | |||
| ENSG / The Ensign Group, Inc. | 0,11 | 16,90 | 0,0857 | 0,0857 | |||||
| FCNCA / First Citizens BancShares, Inc. | 0,01 | -3,34 | 16,87 | 1,99 | 0,0855 | 0,0056 | |||
| CSL / Carlisle Companies Incorporated | 0,04 | -20,96 | 14,76 | -13,32 | 0,0748 | -0,0074 | |||
| RBA / RB Global, Inc. | 0,13 | -3,63 | 13,84 | 2,03 | 0,0702 | 0,0047 | |||
| MUSA / Murphy USA Inc. | 0,03 | 18,95 | 12,90 | 2,99 | 0,0653 | 0,0049 | |||
| DHI / D.R. Horton, Inc. | 0,10 | -3,35 | 12,26 | -1,98 | 0,0622 | 0,0018 | |||
| FOUR / Shift4 Payments, Inc. | 0,11 | 63,63 | 10,59 | 98,48 | 0,0536 | 0,0279 | |||
| ABNB / Airbnb, Inc. | 0,08 | 55,39 | 9,93 | 72,16 | 0,0504 | 0,0225 | |||
| WMS / Advanced Drainage Systems, Inc. | 0,08 | -3,72 | 9,46 | 1,79 | 0,0480 | 0,0031 | |||
| CBZ / CBIZ, Inc. | 0,13 | 9,23 | 0,0468 | 0,0468 | |||||
| KLAC / KLA Corporation | 0,01 | -39,34 | 9,18 | -20,07 | 0,0465 | -0,0089 | |||
| VRSN / VeriSign, Inc. | 0,03 | -18,27 | 8,82 | -7,03 | 0,0447 | -0,0011 | |||
| ORLY / O'Reilly Automotive, Inc. | 0,09 | 859,69 | 8,35 | -39,62 | 0,0423 | -0,0244 | |||
| EEFT / Euronet Worldwide, Inc. | 0,08 | -3,55 | 8,15 | -8,49 | 0,0413 | -0,0017 | |||
| MAR / Marriott International, Inc. | 0,02 | 6,75 | 0,0342 | 0,0342 | |||||
| GOOGL / Alphabet Inc. | 0,03 | -19,73 | 6,09 | -8,52 | 0,0309 | -0,0013 | |||
| YMM / Full Truck Alliance Co. Ltd. - Depositary Receipt (Common Stock) | 0,43 | 42,51 | 5,09 | 31,82 | 0,0258 | 0,0071 | |||
| GSIG / Goldman Sachs ETF Trust - Goldman Sachs Access Investment Grade Corporate 1-5 Year Bond ETF | 0,03 | 4,15 | 0,0211 | 0,0211 | |||||
| PDD / PDD Holdings Inc. - Depositary Receipt (Common Stock) | 0,03 | 0,00 | 2,83 | -11,58 | 0,0143 | -0,0011 | |||
| AAPL / Apple Inc. | 0,00 | 0,00 | 0,81 | -7,62 | 0,0041 | -0,0001 | |||
| NVDD / Direxion Shares ETF Trust - Direxion Daily NVDA Bear 1X Shares | 0,00 | 0,00 | 0,32 | 45,83 | 0,0016 | 0,0006 | |||
| LLY / Eli Lilly and Company | 0,00 | 0,00 | 0,23 | -5,67 | 0,0012 | -0,0000 | |||
| CVS / CVS Health Corporation | 0,00 | -100,00 | 0,00 | 0,0000 | |||||
| WINA / Winmark Corporation | 0,00 | -100,00 | 0,00 | 0,0000 | |||||
| MBC / MasterBrand, Inc. | 0,00 | -100,00 | 0,00 | 0,0000 | |||||
| XPEL / XPEL, Inc. | 0,00 | -100,00 | 0,00 | 0,0000 | |||||
| CRL / Charles River Laboratories International, Inc. | 0,00 | -100,00 | 0,00 | 0,0000 | |||||
| XP / XP Inc. | 0,00 | -100,00 | 0,00 | 0,0000 | |||||
| FDX / FedEx Corporation | 0,00 | -100,00 | 0,00 | 0,0000 |