Statistiques de base
| Profil de l'initié | MARKEL CORP |
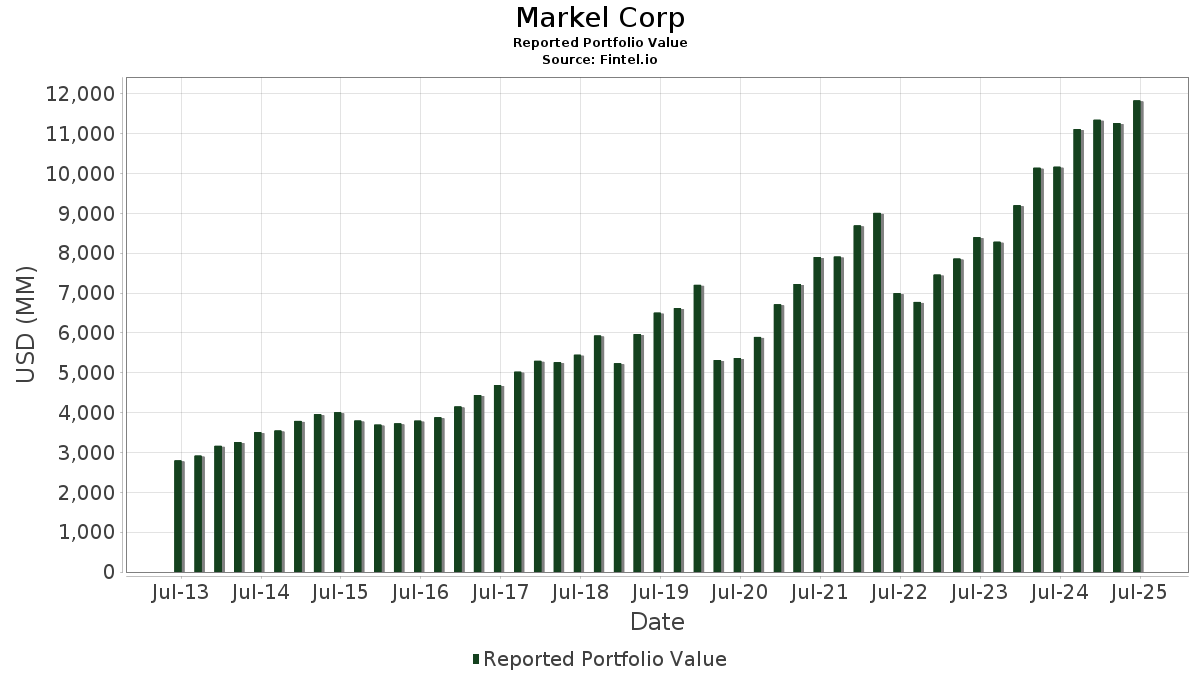
| Valeur du portefeuille | $ 11 827 984 852 |
| Positions actuelles | 137 |
Dernières positions, performances, ASG (à partir des dépôts 13F, 13D)
Markel Corp a déclaré un total de 137 positions dans ses derniers dépôts auprès de la SEC. La valeur la plus récente du portefeuille est calculée à 11 827 984 852 USD. Les actifs sous gestion réels (ASG) sont cette valeur plus les liquidités (qui ne sont pas divulguées). Les principales positions de Markel Corp sont Berkshire Hathaway Inc. (US:BRK.A) , Berkshire Hathaway Inc. (US:BRK.B) , Brookfield Corporation - Preferred Stock (US:BKFOF) , Alphabet Inc. (US:GOOG) , and Deere & Company (US:DE) . Les nouvelles positions de Markel Corp incluent Adobe Inc. (US:ADBE) , Applied Materials, Inc. (US:AMAT) , . Les principales industries de Markel Corp sont "Wholesale Trade-non-durable Goods" (sic 51) , "Restaurants, Dining, Eating And Drinking Places" (sic 58) , and "Apparel And Other Finished Products Made From Fabrics And Similar Materials" (sic 23) .
Meilleures augmentations ce trimestre
Nous utilisons la variation de l'allocation du portefeuille car il s'agit de l'indicateur le plus significatif. Les changements peuvent être dus à des transactions ou à des variations de prix des actions.
| Titre | Actions (en millions) |
Valeur ($ en millions) |
% du portefeuille | ΔPortefeuille % |
|---|---|---|---|---|
| 0,36 | 254,34 | 2,1503 | 0,4070 | |
| 1,17 | 277,93 | 2,3498 | 0,2587 | |
| 0,53 | 262,37 | 1,9083 | 0,1658 | |
| 0,48 | 154,47 | 1,3059 | 0,1490 | |
| 0,72 | 150,32 | 1,2709 | 0,1156 | |
| 0,28 | 206,87 | 1,5046 | 0,0711 | |
| 2,03 | 251,95 | 1,8324 | 0,0518 | |
| 0,01 | 5,42 | 0,0458 | 0,0458 | |
| 0,87 | 99,42 | 0,7231 | 0,0444 | |
| 0,13 | 29,29 | 0,2130 | 0,0380 |
Principales baisses ce trimestre
Nous utilisons la variation de l'allocation du portefeuille car il s'agit de l'indicateur le plus significatif. Les changements peuvent être dus à des transactions ou à des variations de prix des actions.
| Titre | Actions (en millions) |
Valeur ($ en millions) |
% du portefeuille | ΔPortefeuille % |
|---|---|---|---|---|
| 1,53 | 744,19 | 5,4125 | -1,8326 | |
| 0,00 | 811,88 | 6,8641 | -1,0343 | |
| 0,57 | 249,59 | 1,8153 | -0,8500 | |
| 0,92 | 337,31 | 2,4533 | -0,5408 | |
| 1,00 | 354,80 | 2,5805 | -0,5294 | |
| 2,39 | 172,93 | 1,2578 | -0,4503 | |
| 0,75 | 163,71 | 1,1907 | -0,4205 | |
| 0,88 | 446,40 | 3,2467 | -0,4113 | |
| 0,72 | 159,13 | 1,1574 | -0,3094 | |
| 1,23 | 251,80 | 2,1289 | -0,2919 |
Déclarations 13D/G
Il s'agit d'une liste des déclarations 13D et 13G déposées au cours de la dernière année (le cas échéant). Cliquez sur l'icône du lien pour voir l'historique complet des transactions. Les lignes vertes indiquent de nouvelles positions. Les lignes rouges indiquent des positions fermées.
| Date de dépôt | Formulaire | Titre | Actions précédentes |
Actions actuelles |
ΔActions % | % de participation |
% ΔParticipation | |
|---|---|---|---|---|---|---|---|---|
| 2025-04-18 | HGTY / Hagerty, Inc. | 79 380 265 | 79 380 265 | 0,00 | 47,70 | -0,42 |
Déclarations 13F et dépôts de fonds
Ce formulaire a été déposé le 2025-08-01 pour la période de déclaration 2025-06-30. Cliquez sur l'icône du lien pour voir l'historique complet des transactions.
Mettre à niveau pour débloquer les données premium et exporter vers Excel ![]() .
.
| Titre | Type | Prix moyen de l'action | Actions (en millions) |
ΔActions (%) |
ΔActions (%) |
Valeur ($ en millions) |
Portefeuille (%) |
ΔPortefeuille (%) |
|
|---|---|---|---|---|---|---|---|---|---|
| BRK.A / Berkshire Hathaway Inc. | 0,00 | 0,00 | 811,88 | -8,72 | 6,8641 | -1,0343 | |||
| BRK.B / Berkshire Hathaway Inc. | 1,53 | 0,00 | 744,19 | -8,79 | 5,4125 | -1,8326 | |||
| BKFOF / Brookfield Corporation - Preferred Stock | 8,72 | 0,00 | 539,07 | 18,01 | 3,9207 | -0,1356 | |||
| GOOG / Alphabet Inc. | 2,75 | 0,00 | 487,80 | 13,54 | 3,5478 | -0,2671 | |||
| DE / Deere & Company | 0,88 | 0,02 | 446,40 | 8,36 | 3,2467 | -0,4113 | |||
| AMZN / Amazon.com, Inc. | 2,03 | 0,00 | 445,53 | 15,31 | 3,2404 | -0,1906 | |||
| V / Visa Inc. | 1,00 | 0,00 | 354,80 | 1,31 | 2,5805 | -0,5294 | |||
| HD / The Home Depot, Inc. | 0,92 | 0,00 | 337,31 | 0,04 | 2,4533 | -0,5408 | |||
| ADI / Analog Devices, Inc. | 1,17 | 0,00 | 277,93 | 18,02 | 2,3498 | 0,2587 | |||
| MSFT / Microsoft Corporation | 0,53 | 0,91 | 262,37 | 33,71 | 1,9083 | 0,1658 | |||
| GS / The Goldman Sachs Group, Inc. | 0,36 | 0,00 | 254,34 | 29,56 | 2,1503 | 0,4070 | |||
| DIS / The Walt Disney Company | 2,03 | 0,00 | 251,95 | 25,64 | 1,8324 | 0,0518 | |||
| AAPL / Apple Inc. | 1,23 | 0,00 | 251,80 | -7,63 | 2,1289 | -0,2919 | |||
| WSO / Watsco, Inc. | 0,57 | -4,29 | 249,59 | -16,85 | 1,8153 | -0,8500 | |||
| BLK / BlackRock, Inc. | 0,22 | 0,00 | 231,04 | 10,86 | 1,6804 | -0,1703 | |||
| META / Meta Platforms, Inc. | 0,28 | 0,07 | 206,87 | 28,15 | 1,5046 | 0,0711 | |||
| LPLA / LPL Financial Holdings Inc. | 0,54 | 1,02 | 204,21 | 15,79 | 1,4852 | -0,0808 | |||
| PGR / The Progressive Corporation | 0,75 | 0,00 | 201,15 | -5,71 | 1,7006 | -0,1937 | |||
| KKR / KKR & Co. Inc. | 1,45 | 0,00 | 193,13 | 15,07 | 1,4047 | -0,0858 | |||
| BX / Blackstone Inc. | 1,23 | 0,00 | 183,83 | 7,01 | 1,3370 | -0,1884 | |||
| RLI / RLI Corp. | 2,39 | 0,00 | 172,93 | -10,10 | 1,2578 | -0,4503 | |||
| MMC / Marsh & McLennan Companies, Inc. | 0,75 | 0,71 | 163,71 | -9,77 | 1,1907 | -0,4205 | |||
| LOW / Lowe's Companies, Inc. | 0,72 | 1,27 | 159,13 | -3,66 | 1,1574 | -0,3094 | |||
| NVO / Novo Nordisk A/S - Depositary Receipt (Common Stock) | 2,26 | 5,05 | 155,89 | 4,41 | 1,3180 | -0,0078 | |||
| AXP / American Express Company | 0,48 | 0,00 | 154,47 | 18,56 | 1,3059 | 0,1490 | |||
| TXN / Texas Instruments Incorporated | 0,72 | 0,00 | 150,32 | 15,54 | 1,2709 | 0,1156 | |||
| APO / Apollo Global Management, Inc. | 1,01 | 0,00 | 143,64 | 3,60 | 1,0447 | -0,1865 | |||
| DEO / Diageo plc - Depositary Receipt (Common Stock) | 1,37 | 0,00 | 137,82 | -3,77 | 1,0024 | -0,2694 | |||
| CAT / Caterpillar Inc. | 0,33 | 0,18 | 127,59 | 17,93 | 0,9279 | -0,0328 | |||
| SCHW / The Charles Schwab Corporation | 1,36 | 0,00 | 124,52 | 16,56 | 0,9057 | -0,0430 | |||
| BAM / Brookfield Asset Management Ltd. | 2,19 | 0,00 | 121,28 | 14,10 | 0,8821 | -0,0618 | |||
| MA / Mastercard Incorporated | 0,21 | 0,00 | 116,63 | 2,52 | 0,8482 | -0,1619 | |||
| GD / General Dynamics Corporation | 0,39 | 0,00 | 114,04 | 7,00 | 0,8294 | -0,1170 | |||
| MCO / Moody's Corporation | 0,21 | 0,00 | 107,29 | 7,71 | 0,7803 | -0,1042 | |||
| GOOGL / Alphabet Inc. | 0,57 | 2,69 | 100,80 | 17,03 | 0,7332 | -0,0317 | |||
| DG / Dollar General Corporation | 0,87 | 0,00 | 99,42 | 30,08 | 0,7231 | 0,0444 | |||
| HEIA / Heico Corp. - Class A | 0,38 | 0,00 | 98,23 | 22,65 | 0,7145 | 0,0032 | |||
| FNV / Franco-Nevada Corporation | 0,57 | 8,42 | 93,35 | 12,80 | 0,6790 | -0,0559 | |||
| JNJ / Johnson & Johnson | 0,61 | 0,00 | 93,30 | -7,89 | 0,6786 | -0,2209 | |||
| NVR / NVR, Inc. | 0,01 | 0,11 | 87,87 | 2,06 | 0,6391 | -0,1254 | |||
| LIN / Linde plc | 0,19 | 3,09 | 87,55 | 3,88 | 0,6367 | -0,1117 | |||
| ADM / Archer-Daniels-Midland Company | 1,57 | 1,45 | 83,07 | 11,53 | 0,6041 | -0,0572 | |||
| ROL / Rollins, Inc. | 1,47 | 0,48 | 82,90 | 4,92 | 0,6029 | -0,0987 | |||
| MSCI / MSCI Inc. | 0,14 | 0,00 | 82,39 | 1,99 | 0,6965 | -0,0208 | |||
| ITW / Illinois Tool Works Inc. | 0,33 | 0,00 | 80,97 | -0,31 | 0,5889 | -0,1323 | |||
| SPGI / S&P Global Inc. | 0,15 | 0,00 | 79,46 | 3,78 | 0,5779 | -0,1020 | |||
| ECL / Ecolab Inc. | 0,27 | 0,00 | 73,91 | 6,28 | 0,5375 | -0,0800 | |||
| JPM / JPMorgan Chase & Co. | 0,25 | 0,00 | 73,22 | 18,19 | 0,5325 | -0,0176 | |||
| CG / The Carlyle Group Inc. | 1,33 | 0,00 | 68,21 | 17,92 | 0,4961 | -0,0176 | |||
| NSC / Norfolk Southern Corporation | 0,24 | 3,05 | 60,54 | 11,37 | 0,4403 | -0,0424 | |||
| SBUX / Starbucks Corporation | 0,62 | 0,00 | 57,16 | -6,59 | 0,4157 | -0,1276 | |||
| ODFL / Old Dominion Freight Line, Inc. | 0,34 | 9,34 | 55,58 | 7,26 | 0,4042 | -0,0559 | |||
| FDS / FactSet Research Systems Inc. | 0,12 | 0,00 | 52,21 | -1,62 | 0,3797 | -0,0915 | |||
| ROK / Rockwell Automation, Inc. | 0,15 | 0,00 | 51,45 | 28,56 | 0,3742 | 0,0188 | |||
| VRSK / Verisk Analytics, Inc. | 0,16 | 0,00 | 48,58 | 4,66 | 0,3533 | -0,0588 | |||
| FDX / FedEx Corporation | 0,21 | 0,00 | 48,42 | -6,76 | 0,3521 | -0,1090 | |||
| THG / The Hanover Insurance Group, Inc. | 0,28 | 0,36 | 47,73 | -2,00 | 0,3472 | -0,0853 | |||
| ACN / Accenture plc | 0,16 | 0,00 | 47,64 | -4,21 | 0,3465 | -0,0952 | |||
| AON / Aon plc | 0,13 | 0,27 | 46,31 | -10,37 | 0,3368 | -0,1220 | |||
| TSN / Tyson Foods, Inc. | 0,82 | 2,19 | 45,65 | -10,41 | 0,3320 | -0,1205 | |||
| ITIC / Investors Title Company | 0,21 | 0,00 | 45,07 | -12,35 | 0,3278 | -0,1288 | |||
| COST / Costco Wholesale Corporation | 0,04 | 0,00 | 38,76 | 4,67 | 0,3277 | -0,0011 | |||
| CMCSA / Comcast Corporation | 0,96 | 0,00 | 34,33 | -3,28 | 0,2497 | -0,0655 | |||
| YUM / Yum! Brands, Inc. | 0,23 | 0,44 | 33,56 | -5,41 | 0,2837 | -0,0313 | |||
| RTX / RTX Corporation | 0,22 | 0,00 | 32,71 | 10,24 | 0,2379 | -0,0256 | |||
| SHW / The Sherwin-Williams Company | 0,09 | 0,00 | 32,33 | -1,67 | 0,2352 | -0,0568 | |||
| NKE / NIKE, Inc. | 0,45 | 0,45 | 31,78 | 12,41 | 0,2312 | -0,0199 | |||
| HGTY / Hagerty, Inc. | 3,11 | 0,00 | 31,42 | 11,83 | 0,2657 | 0,0162 | |||
| ALL / The Allstate Corporation | 0,15 | 0,00 | 31,11 | -2,78 | 0,2263 | -0,0579 | |||
| TROW / T. Rowe Price Group, Inc. | 0,31 | 0,00 | 30,30 | 5,04 | 0,2204 | -0,0358 | |||
| FERG / Ferguson Enterprises Inc. | 0,13 | 9,35 | 29,29 | 48,60 | 0,2130 | 0,0380 | |||
| LMT / Lockheed Martin Corporation | 0,06 | 1,30 | 28,84 | 5,03 | 0,2097 | -0,0341 | |||
| ABNB / Airbnb, Inc. | 0,21 | 15,33 | 28,06 | 27,77 | 0,2041 | 0,0091 | |||
| HCA / HCA Healthcare, Inc. | 0,07 | 11,23 | 26,42 | 23,31 | 0,1922 | 0,0019 | |||
| CSCO / Cisco Systems, Inc. | 0,35 | 2,19 | 24,25 | 14,90 | 0,1764 | -0,0110 | |||
| URI / United Rentals, Inc. | 0,03 | 0,00 | 23,47 | 20,22 | 0,1984 | 0,0251 | |||
| BFA / Brown-Forman Corp. - Class A | 0,84 | 0,00 | 23,16 | -17,93 | 0,1684 | -0,0821 | |||
| UNP / Union Pacific Corporation | 0,10 | 13,41 | 22,38 | 10,45 | 0,1628 | -0,0172 | |||
| PAYX / Paychex, Inc. | 0,15 | 0,00 | 21,82 | -5,72 | 0,1587 | -0,0468 | |||
| PM / Philip Morris International Inc. | 0,11 | 0,00 | 20,85 | 14,74 | 0,1517 | -0,0097 | |||
| TMO / Thermo Fisher Scientific Inc. | 0,05 | 10,11 | 20,09 | -10,28 | 0,1461 | -0,0527 | |||
| SPOT / Spotify Technology S.A. | 0,03 | 0,00 | 19,87 | 39,52 | 0,1445 | 0,0180 | |||
| CCK / Crown Holdings, Inc. | 0,19 | 0,00 | 19,51 | 15,37 | 0,1419 | -0,0083 | |||
| COF / Capital One Financial Corporation | 0,09 | 0,00 | 19,36 | 18,66 | 0,1408 | -0,0041 | |||
| LAMR / Lamar Advertising Company | 0,16 | 15,33 | 19,17 | 23,01 | 0,1395 | 0,0010 | |||
| EFX / Equifax Inc. | 0,07 | 0,00 | 18,90 | 6,49 | 0,1374 | -0,0201 | |||
| APD / Air Products and Chemicals, Inc. | 0,07 | 0,00 | 18,33 | -4,36 | 0,1333 | -0,0369 | |||
| MMM / 3M Company | 0,12 | -59,74 | 18,00 | -58,27 | 0,1309 | -0,2521 | |||
| CARR / Carrier Global Corporation | 0,23 | 0,00 | 17,20 | 15,44 | 0,1251 | -0,0072 | |||
| RNR / RenaissanceRe Holdings Ltd. | 0,07 | 0,00 | 17,00 | 1,21 | 0,1237 | -0,0255 | |||
| MAR / Marriott International, Inc. | 0,06 | 15,87 | 16,46 | 32,89 | 0,1197 | 0,0097 | |||
| WFC / Wells Fargo & Company | 0,20 | 0,00 | 16,38 | 11,60 | 0,1191 | -0,0112 | |||
| SEIC / SEI Investments Company | 0,17 | 0,00 | 15,56 | 15,75 | 0,1132 | -0,0062 | |||
| CHH / Choice Hotels International, Inc. | 0,12 | 0,00 | 14,65 | -4,45 | 0,1066 | -0,0296 | |||
| TGT / Target Corporation | 0,13 | 0,00 | 13,12 | -5,47 | 0,0954 | -0,0278 | |||
| BFB / Brown-Forman Corp. - Class B | 0,47 | 0,00 | 12,76 | -20,71 | 0,0928 | -0,0501 | |||
| PEP / PepsiCo, Inc. | 0,10 | 0,00 | 12,70 | -11,94 | 0,0924 | -0,0357 | |||
| SHOP / Shopify Inc. | 0,10 | 0,00 | 11,85 | 20,82 | 0,1002 | 0,0131 | |||
| UBER / Uber Technologies, Inc. | 0,12 | 1,23 | 11,52 | 29,64 | 0,0838 | 0,0049 | |||
| OTIS / Otis Worldwide Corporation | 0,11 | 0,00 | 11,35 | -4,05 | 0,0825 | -0,0225 | |||
| SMG / The Scotts Miracle-Gro Company | 0,17 | 0,00 | 11,08 | 20,17 | 0,0806 | -0,0013 | |||
| BK / The Bank of New York Mellon Corporation | 0,12 | 0,00 | 11,07 | 8,63 | 0,0805 | -0,0100 | |||
| HXL / Hexcel Corporation | 0,19 | 0,00 | 10,68 | 3,16 | 0,0903 | -0,0016 | |||
| KMX / CarMax, Inc. | 0,14 | 0,00 | 9,17 | -13,75 | 0,0667 | -0,0277 | |||
| HSY / The Hershey Company | 0,05 | 0,00 | 9,04 | -2,97 | 0,0658 | -0,0170 | |||
| TRU / TransUnion | 0,10 | 0,00 | 8,89 | 6,03 | 0,0647 | -0,0098 | |||
| SONY / Sony Group Corporation - Depositary Receipt (Common Stock) | 0,34 | 0,00 | 8,72 | 2,53 | 0,0634 | -0,0121 | |||
| UNH / UnitedHealth Group Incorporated | 0,03 | -5,40 | 8,27 | -43,65 | 0,0601 | -0,0702 | |||
| NSP / Insperity, Inc. | 0,13 | 0,00 | 7,92 | -32,63 | 0,0576 | -0,0468 | |||
| IQV / IQVIA Holdings Inc. | 0,05 | -15,47 | 7,82 | -24,44 | 0,0569 | -0,0350 | |||
| OI / O-I Glass, Inc. | 0,47 | -45,81 | 6,98 | -30,35 | 0,0508 | -0,0382 | |||
| FIX / Comfort Systems USA, Inc. | 0,01 | 0,00 | 6,97 | 66,35 | 0,0507 | 0,0135 | |||
| CME / CME Group Inc. | 0,02 | 136,84 | 6,20 | 146,07 | 0,0451 | 0,0227 | |||
| EMN / Eastman Chemical Company | 0,07 | 0,00 | 5,60 | -15,27 | 0,0407 | -0,0179 | |||
| ADBE / Adobe Inc. | 0,01 | 5,42 | 0,0458 | 0,0458 | |||||
| HII / Huntington Ingalls Industries, Inc. | 0,02 | 13,89 | 4,95 | 34,78 | 0,0360 | 0,0034 | |||
| GHC / Graham Holdings Company | 0,01 | 0,00 | 4,92 | -1,52 | 0,0358 | -0,0086 | |||
| CE / Celanese Corporation | 0,08 | 0,00 | 4,50 | -2,54 | 0,0327 | -0,0083 | |||
| WRB / W. R. Berkley Corporation | 0,06 | 0,00 | 4,46 | 3,26 | 0,0325 | -0,0059 | |||
| CBOE / Cboe Global Markets, Inc. | 0,02 | 216,67 | 4,43 | 226,46 | 0,0322 | 0,0202 | |||
| GPK / Graphic Packaging Holding Company | 0,17 | -62,27 | 3,67 | -69,38 | 0,0267 | -0,0797 | |||
| AMAT / Applied Materials, Inc. | 0,02 | 3,02 | 0,0255 | 0,0255 | |||||
| MGM / MGM Resorts International | 0,09 | 2,34 | 3,01 | 18,75 | 0,0254 | 0,0029 | |||
| AYI / Acuity Inc. | 0,01 | 0,00 | 2,91 | 13,28 | 0,0212 | -0,0016 | |||
| BALL / Ball Corporation | 0,05 | 0,00 | 2,86 | 7,72 | 0,0242 | 0,0006 | |||
| WTW / Willis Towers Watson Public Limited Company | 0,01 | 0,00 | 2,64 | -9,30 | 0,0192 | -0,0067 | |||
| DPZ / Domino's Pizza, Inc. | 0,01 | 0,00 | 2,48 | -1,90 | 0,0180 | -0,0044 | |||
| IT / Gartner, Inc. | 0,01 | 0,00 | 2,30 | -3,68 | 0,0168 | -0,0045 | |||
| INTU / Intuit Inc. | 0,00 | 0,00 | 2,14 | 28,26 | 0,0156 | 0,0008 | |||
| CSX / CSX Corporation | 0,07 | 2,12 | 0,0154 | 0,0154 | |||||
| EXP / Eagle Materials Inc. | 0,01 | 157,14 | 1,82 | 134,28 | 0,0132 | 0,0063 | |||
| SYY / Sysco Corporation | 0,02 | 166,67 | 1,82 | 169,19 | 0,0132 | 0,0072 | |||
| BC / Brunswick Corporation | 0,03 | 0,00 | 1,63 | 2,58 | 0,0119 | -0,0023 | |||
| CSGP / CoStar Group, Inc. | 0,02 | 0,00 | 1,50 | 1,49 | 0,0109 | -0,0022 | |||
| EL / The Estée Lauder Companies Inc. | 0,01 | 0,00 | 1,21 | 22,42 | 0,0088 | 0,0000 | |||
| ICE / Intercontinental Exchange, Inc. | 0,01 | 0,00 | 0,94 | 6,34 | 0,0068 | -0,0010 | |||
| BUD / Anheuser-Busch InBev SA/NV - Depositary Receipt (Common Stock) | 0,01 | 0,00 | 0,76 | 11,52 | 0,0055 | -0,0005 | |||
| CABO / Cable One, Inc. | 0,00 | -100,00 | 0,00 | 0,0000 |